🐻 CIEN $6.3M Earnings Put Bomb - Someone Is Bracing for a Ciena Earnings Wipeout!
📅 February 25, 2026 | 🔥 Unusual Activity Detected
🎯 The Quick Take
Someone just dropped $6.3 MILLION in CIEN puts - buying 1,500 contracts at BOTH the $352.50 and $330 strikes, all expiring March 6, the day AFTER Ciena's Q1 FY2026 earnings report on March 5. This is a pure earnings play. With the stock up 58.5% in three months and now trading 35% above the average analyst price target, this institutional-sized trader is betting Ciena stumbles on earnings night - and they want heavy downside protection (or profit) when it does.
📊 Company Overview
Ciena Corporation (CIEN) is the optical networking giant powering the AI data center buildout:
- 🌐 What they do: Designs and manufactures networking equipment, including optical transport systems, packet networking, and software automation for telecom carriers and hyperscale cloud providers
- 💰 Market Cap: $48.5B
- 🏢 Sector: Telephone & Telegraph Apparatus (Networking Equipment)
- 📈 Exchange: NYSE
- 📊 Current Price: ~$354.74
- 🤖 Key Story: Riding the AI infrastructure boom with 3 of 4 hyperscalers selecting Ciena's "scale across" optical networking architecture, recently added to the S&P 500, record $5B backlog, and FY2026 revenue guidance raised to $5.7B-$6.1B (~24% YoY growth)
💰 The Option Flow Breakdown
📊 The Tape
| Time | Symbol | Side | Buy/Sell | Type | Expiration | Premium | Strike | Volume | OI | Size | Spot | Option Price | Option Symbol |
|---|---|---|---|---|---|---|---|---|---|---|---|---|---|
| 10:46:08 | CIEN | BTO | BUY | PUT $352.50 | 2026-03-06 | $3.8M | $352.50 | 1,500 | - | 1,500 | $354.74 | $25.33 | CIEN20260306P352.50 |
| 10:46:08 | CIEN | BTO | BUY | PUT $330 | 2026-03-06 | $2.5M | $330 | 1,500 | - | 1,500 | $354.74 | $16.67 | CIEN20260306P330 |
🤓 What This Actually Means
Let me break this down in plain English:
- 💸 $6.3 million total premium spent: Two massive put purchases at the exact same timestamp (10:46:08), same expiration, same volume (1,500 contracts each). This is NOT a coincidence - this is one coordinated trade.
- 📉 $352.50 put is nearly at-the-money - strike is just 0.6% below the $354.74 spot price. This put starts making money almost immediately on any decline.
- 📉 $330 put is 7% out-of-the-money - this is either the short leg of a spread or standalone crash insurance. The $330 level represents a post-earnings gap-down scenario.
- ⏰ 9 days to expiration (March 6, 2026) - and the kicker? March 5 is CIEN's Q1 FY2026 earnings report. These puts expire THE DAY AFTER earnings. This is a textbook earnings event trade.
- 📊 Both classified as Buy-to-Open (BTO) - these are brand new bearish positions, not hedging existing options or rolling down
- 🎯 1,500 contracts each = exposure on 150,000 shares per leg (~$53M notional at current prices). This trader is swinging a very big bat.
Two ways to read this trade:
Interpretation 1: Bear Put Spread ($352.50/$330) If these two legs are a coordinated spread - and the identical timestamp, volume, and expiration strongly suggest they are - the net cost is roughly $3.8M - $2.5M = $1.3M net debit for a $352.50/$330 bear put spread. Maximum profit = ($352.50 - $330) x 1,500 x 100 = $3.375M if CIEN drops below $330 by March 6. That is a 2.6:1 risk/reward ratio - very attractive for an earnings bet.
Interpretation 2: Layered Put Protection (Two Standalone Puts) If these are two independent puts, the trader spent the full $6.3M in premium buying layered downside protection. The $352.50 put provides near-ATM protection that kicks in immediately on any decline, while the $330 put adds additional leveraged exposure to a larger earnings-driven crash. This interpretation suggests genuine fear of a major drawdown - not just a surgical bet.
Our take: Given the identical timestamp, volume, and expiration, these almost certainly came from the same desk. The most likely structure is a bear put spread (buy the $352.50, sell the $330 at a later timestamp or in a separate transaction), possibly with an additional standalone $330 put for extra crash leverage. Either way, the message is clear: this trader expects CIEN to pull back meaningfully after the March 5 earnings report, and they are paying serious money to profit from (or protect against) that decline.
Why $330? The $330 strike aligns perfectly with the gamma support level at that price (0.24B total gamma), and it represents roughly a 7% decline from current levels - well within Ciena's historical 8-15% earnings move range.
📈 Technical Setup / Chart Check-Up
YTD Performance
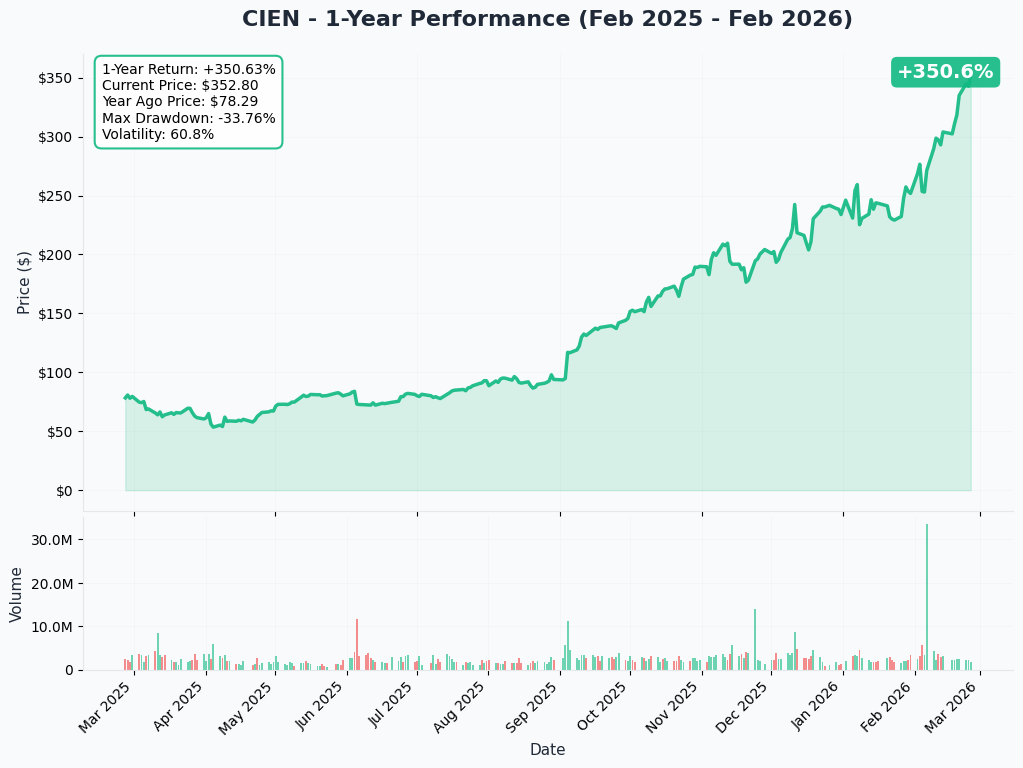
CIEN has been on an absolute tear. The stock is up roughly +58.5% over the last three months, surging from ~$216 in late November 2025 to ~$354.74 today. Here is the story the chart tells:
- 🚀 Massive post-earnings rally: The Q4 FY2025 earnings beat on December 11 and guidance raise triggered a 10%+ surge, kicking off the current run
- 📈 S&P 500 inclusion boost: Added to the S&P 500 on February 9, 2026, driving forced passive fund buying that pushed the stock from ~$250 to $345+ in weeks
- 🔝 New 12-month highs: Stock set new 12-month highs in late February 2026 - trading at all-time-high territory
- ⚠️ 35% above average analyst target: The consensus price target is ~$254, meaning the stock has massively overshot where the Street thinks it should be. Even the street-high target of $305 from Rosenblatt is 14% below the current price.
- 🏃 Extended move: A 58.5% rally in 3 months without a meaningful pullback creates significant snap-back risk - the higher it climbs without resting, the sharper the potential reversal
Key takeaway: CIEN's chart screams "buy the rumor" - the question this put buyer is asking is whether the March 5 earnings report becomes the "sell the news" event.
Gamma-Based Support & Resistance Analysis
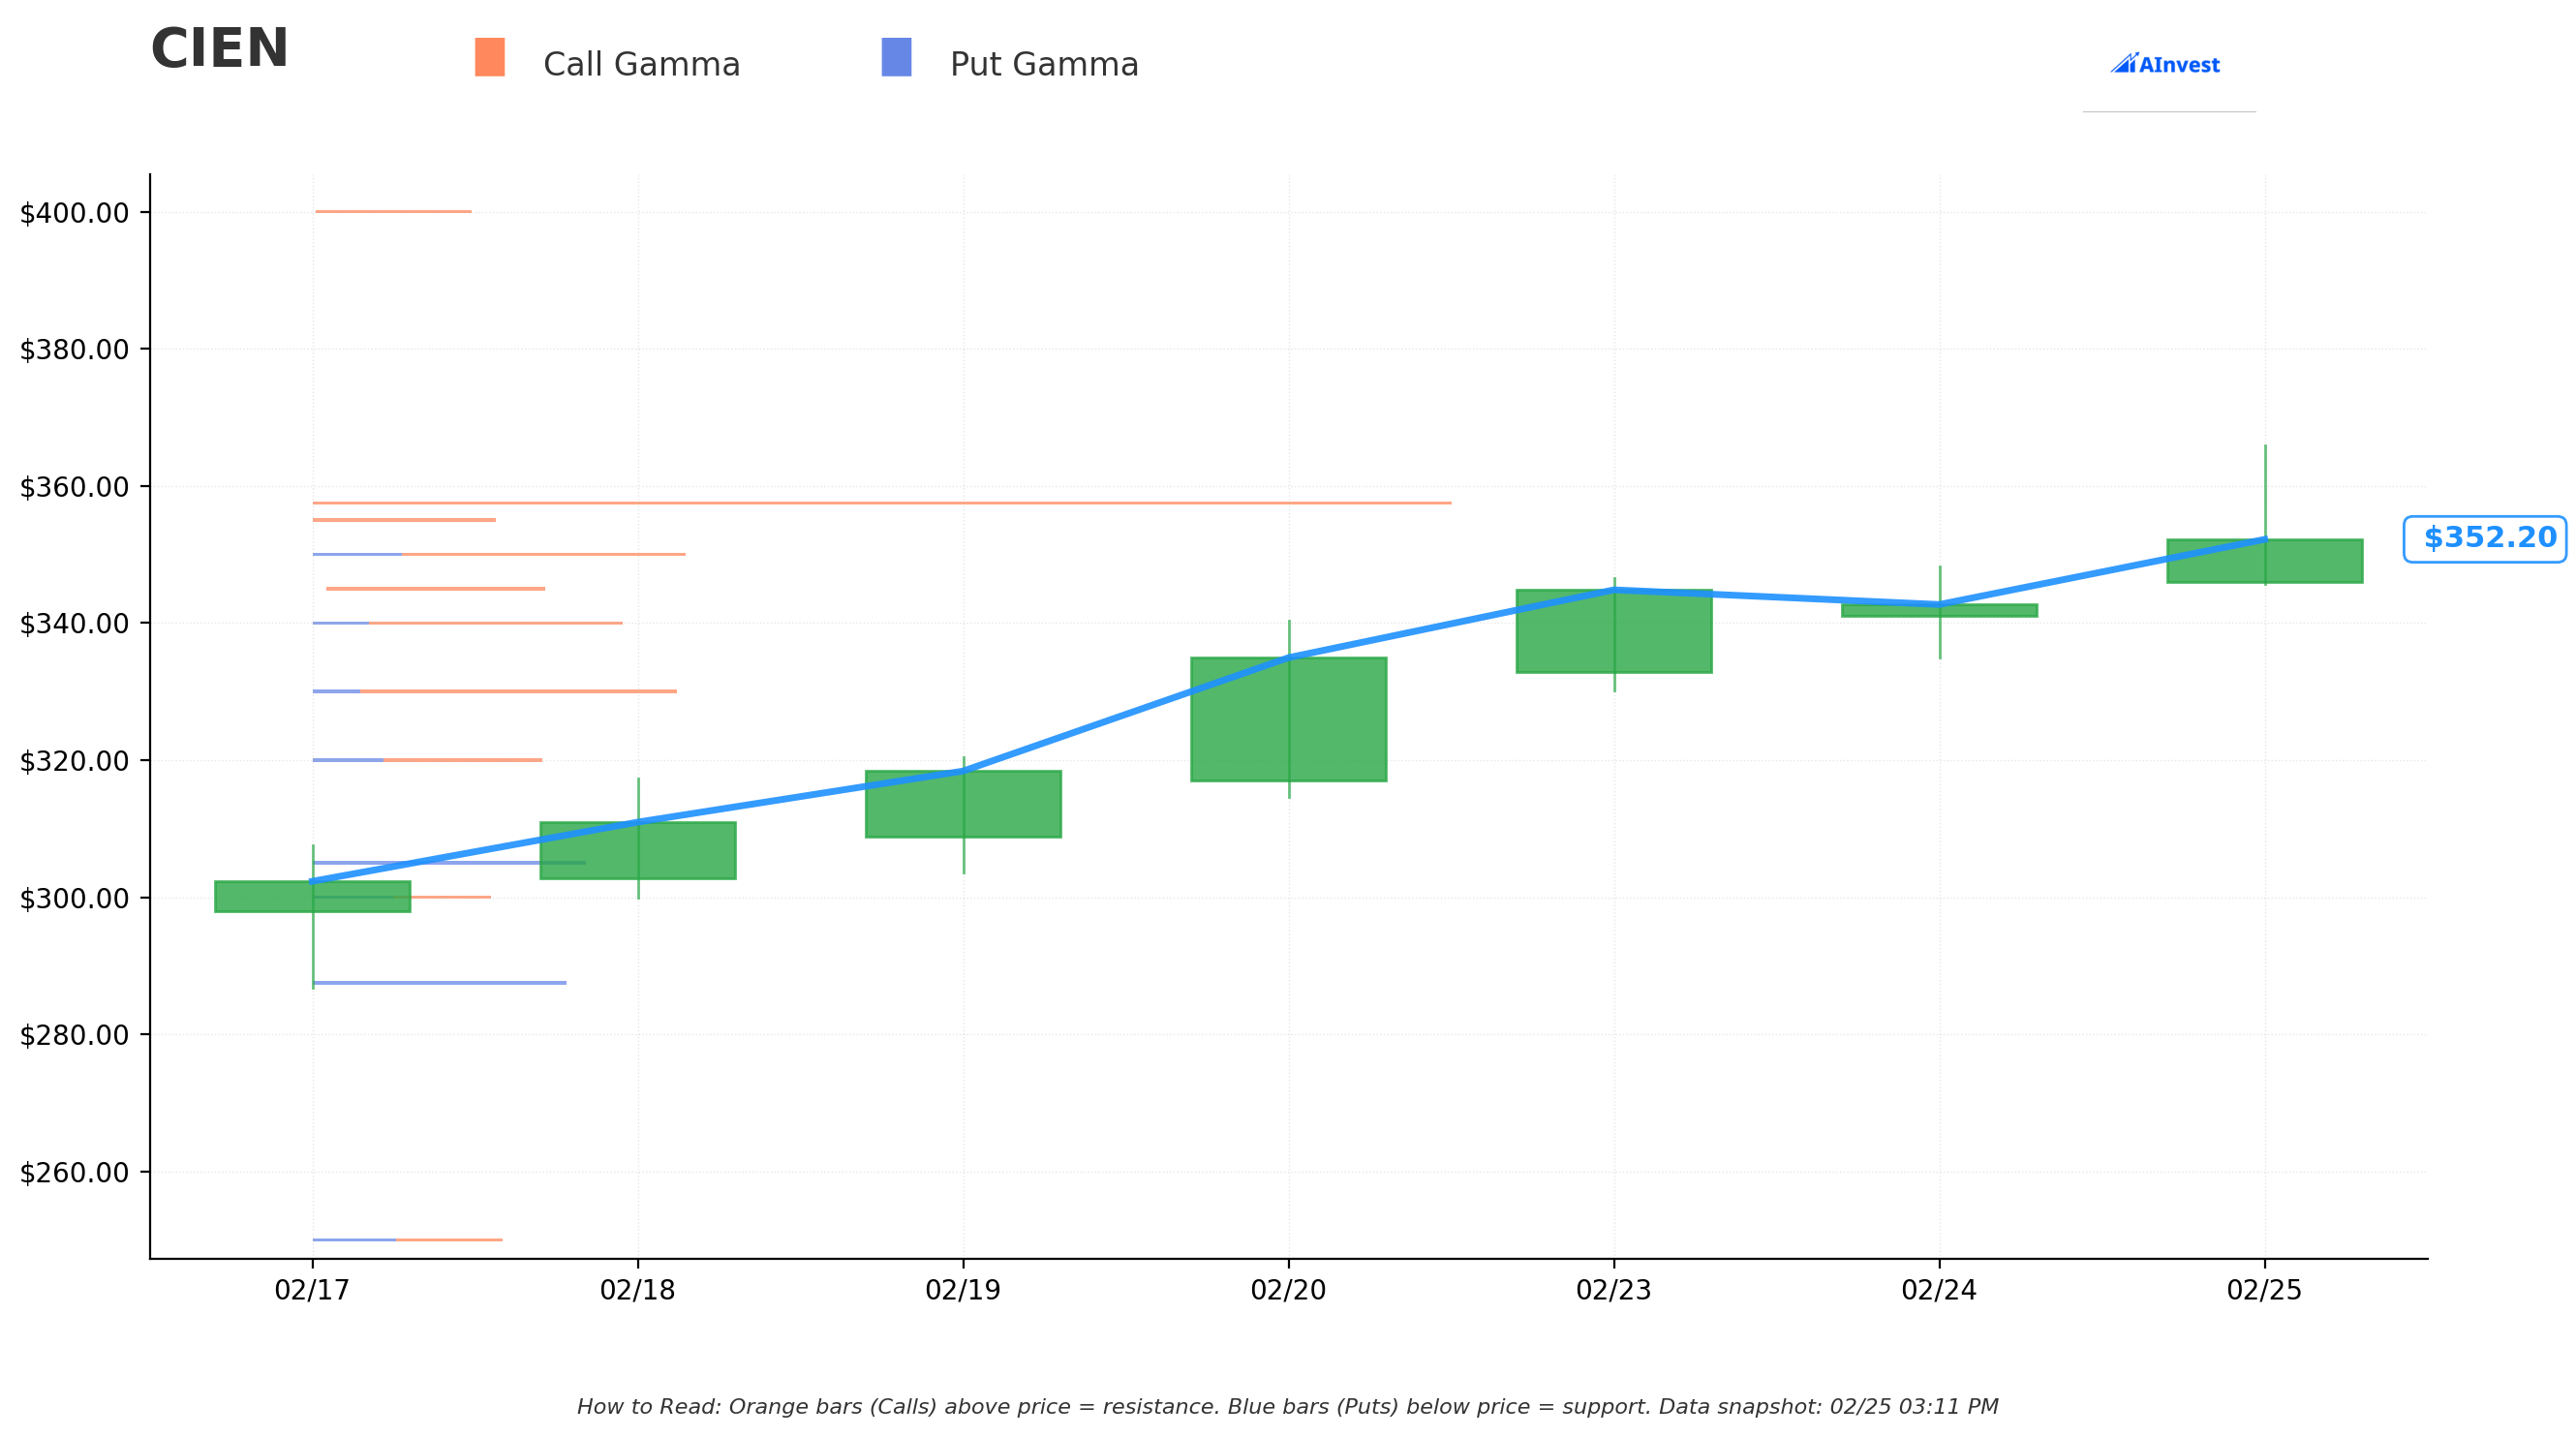
Current Price: $353.43
The gamma exposure map shows where options market makers have concentrated positions, creating natural price magnets and barriers:
🔵 Support Levels (Put Gamma Below Price):
- $350 - Strongest immediate support with 0.25B total gamma (just 1.0% below current price - tight floor)
- $345 - Secondary support at 0.15B gamma (2.4% below)
- $340 - Moderate support at 0.21B gamma (3.8% below)
- $330 - Notable support with 0.24B gamma (6.6% below - THIS IS THE PUT STRIKE!)
- $320 - Extended support at 0.15B gamma (9.5% below)
- $305 - Deep put concentration with 0.18B gamma (13.7% below - heavy hedging zone)
- $287.50 - Disaster-level support at 0.16B gamma (18.7% below)
🟠 Resistance Levels (Call Gamma Above Price):
- $355 - First resistance at 0.12B gamma (just 0.4% above - essentially at-the-money)
- $357.50 - MASSIVE call gamma wall with 0.77B gamma (1.2% above - the single strongest gamma level on the board!)
What this means for traders: CIEN is pinned between $350 support and the enormous $357.50 gamma wall overhead. The near-term battlefield is the $350-$357.50 range. In a post-earnings scenario, if the stock gaps below $350, there is a lot of air down to the next meaningful gamma levels at $340 and $330 - exactly where that second put strike sits. If $330 breaks, the next cluster of support does not appear until $305-$320.
Notice the put buyer's strike selection: The $352.50 put sits right at the $350 gamma support zone - if that level breaks, protection kicks in immediately. The $330 put sits at the next strong gamma support, which would be the natural landing zone if a post-earnings gap-down blows through $350.
Net GEX Bias: Bullish (3.15B total call gamma vs 1.19B total put gamma) - dealer positioning still leans bullish overall, but the concentrated call gamma at $357.50 acts like a ceiling. If that ceiling holds and earnings disappoint, the downside is wide open.
Implied Move Analysis
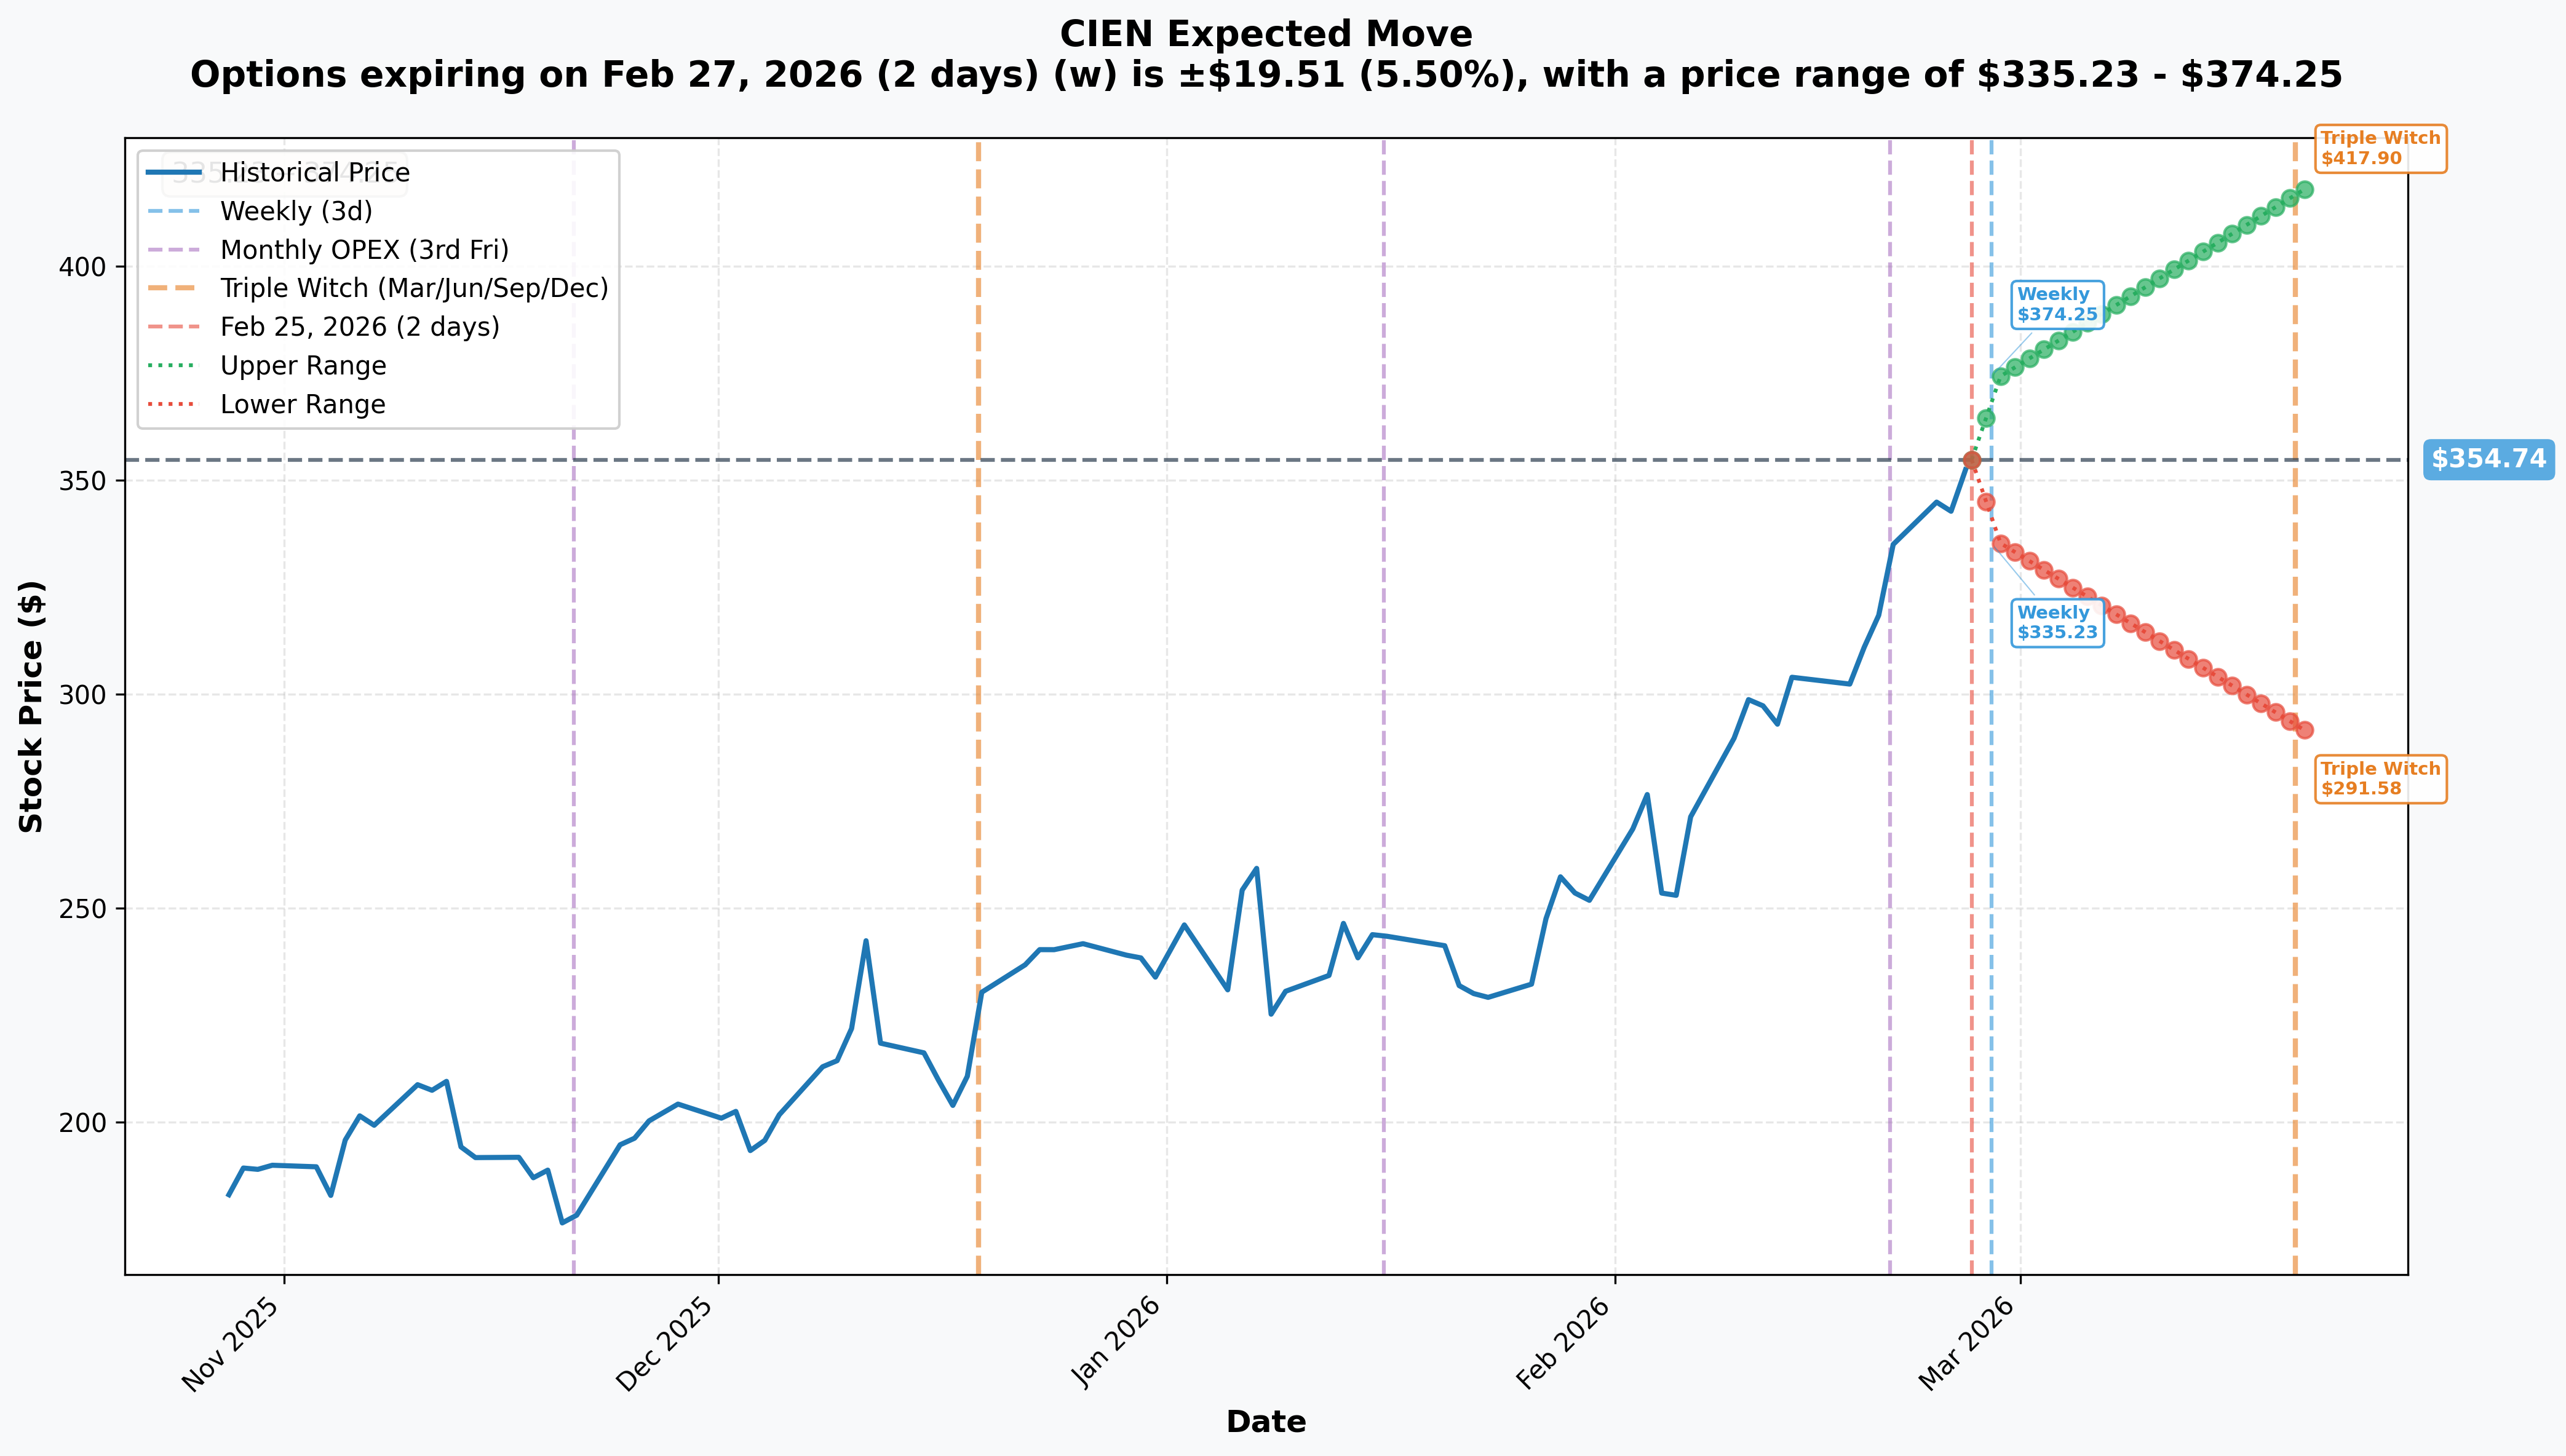
Options market pricing for upcoming expirations:
- 📅 Weekly (Feb 27 - 2 days): ±$19.51 (±5.5%) --> Range: $335.23 - $374.25
- 📅 Monthly OPEX / Triple Witch (Mar 20 - 23 days): ±$63.16 (±17.8%) --> Range: $291.58 - $417.90
Translation: A 5.5% implied move for just TWO DAYS is enormous - the market is clearly pricing in elevated volatility even before the March 5 earnings report. The monthly OPEX range of $291.58 to $417.90 captures the full earnings event and implies the market sees a potential ~18% swing in either direction over the next few weeks. That range is wider than most stocks move in a YEAR.
Critical insight for this put trade: The $352.50 put strike sits comfortably within the weekly lower range of $335.23. The $330 put strike requires roughly a 7% move - well within the historical earnings move range of 8-15%. The monthly implied range down to $291.58 suggests the market acknowledges a scenario where CIEN could crater 17%+ on genuinely bad news. This put buyer is playing in the sweet spot of the expected move distribution.
Why is implied vol so high? Two words: earnings uncertainty. CIEN historically swings 8-15% on earnings, and the December 2025 report sent the stock surging 10%+ on the beat-and-raise. The March 6 expiration captures the full earnings event - whoever holds these puts will know their fate within 24 hours of the print.
🎪 Catalysts
🔥 Upcoming Catalysts
Q1 FY2026 Earnings Report - March 5, 2026 (Pre-Market) - THE BIG ONE 📊
This is THE catalyst. Everything about this put trade revolves around this single event. Ciena has confirmed March 5 for fiscal Q1 results, with the earnings call at 8:30 AM ET.
| Metric | Q1 FY2026 Guidance | Consensus Estimate | Q1 FY2025 Actual |
|---|---|---|---|
| Revenue | $1.35B-$1.43B | ~$1.39B | $1.13B |
| Adj. Gross Margin | 43%-44% | ~43.5% | 42.2% |
| Adj. EPS | - | ~$1.13-$1.16 | $0.55 |
| Adj. OpEx | ~$380M | - | $355M |
Key things the market will scrutinize:
- 📊 Cloud provider revenue as percentage of total (was 40% in Q3 FY2025)
- 📦 Backlog trajectory (was $5.0B at FY2025 end)
- 📈 FY2026 guidance reiteration or raise (currently $5.7B-$6.1B)
- 💰 Margin progression (gross margin improvement expected to be weighted to H2)
- 🌐 Scale-across revenue timing from hyperscaler wins
OFC 2026 Conference - March 15-19, 2026 (Los Angeles) 🎤
Ciena will demonstrate the Vesta 200 6.4T CPX at booth #1927. Major optical networking industry showcase - potential for customer validation announcements and competitive positioning versus the Nokia-Infinera combined entity.
Q2 FY2026 Earnings - Expected Early June 2026 📊
Full-year guidance update likely; consensus expects sequential revenue growth acceleration in H2 FY2026.
✅ Recent Catalysts (Already Happened)
Vesta 200 6.4T CPX Launch - February 25, 2026 (TODAY!) 🚀
Ciena unveiled the Vesta 200 6.4T CPX - the industry's highest-density, lowest-power pluggable co-packaged optics (CPO) solution. This is the first product from the $270M Nubis Communications acquisition. Key specs: 6.4 Tb/s full-duplex bandwidth, up to 70% power reduction versus traditional options, retimer-free linear-drive operation. Targets hyperscaler AI networks. StockTitan called it "slashing energy use 70%".
S&P 500 Inclusion - Effective February 9, 2026 📊
Ciena rejoined the S&P 500 after 17 years (removed in 2009, replaced by Visa at the time). S&P Global confirmed the addition, and it triggered forced passive fund buying that helped push the stock from ~$250 to $345+ in weeks. TIKR noted the stock climbing immediately on the news.
Q4 FY2025 Blowout Earnings - December 11, 2025 📊
Record results that crushed estimates: Revenue $1.35B (+20.1% YoY), beating consensus of $1.29B by $60M. Adjusted EPS $0.91 (+69% YoY), beating by $0.15. Record orders of $7.8B for FY2025 with $5.0B backlog. Management raised FY2026 guidance to $5.7B-$6.1B (~24% growth at midpoint). Stock surged 10%+ on the print. Multiple analysts raised price targets - Barclays to $279, Rosenblatt to $305, Citi to $280.
WaveLogic 6 Extreme (WL6e) Commercial Ramp - Ongoing 🌐
Industry's only 1.6 Tb/s single-carrier coherent optical solution in broad commercial rollout. 50% reduction in space/power per bit versus 800G. Ciena CSO says they have a 2-year head start over Nokia and Cisco.
Hyperscaler "Scale Across" Wins 🤝
Three of four major hyperscalers have selected Ciena for their "scale across" optical networking architecture - purpose-built solutions for distributed AI training across data centers. Revenue expected to begin in FY2026, with larger scaling in FY2027+.
🎲 Price Targets & Probabilities
Using gamma levels, implied move data, analyst targets, and the March 5 earnings catalyst, here are the scenarios through the March 6, 2026 expiration (one day post-earnings):
📉 Bear Case (35% probability)
Target: $310-$330
How we get there:
- 😰 Earnings "meet but no raise" - revenue comes in at $1.39B (guidance midpoint) but management reiterates rather than raises FY2026 guidance. At 51x forward P/E, the market needs a raise, not a reiteration.
- 📉 Gross margin comes in at the low end of 43%-44% with management reiterating that improvement is H2-weighted - frustrating bulls looking for immediate proof
- 💸 Scale-across hyperscaler revenue pushed more heavily toward FY2027, disappointing near-term growth expectations
- ⚠️ Backlog declines from $5.0B as order run-rate normalizes after the record $7.8B FY2025 binge
- 🏃 Profit-taking accelerates - 38 insider sales and 0 purchases in the past 6 months ($37.2M) gives sellers confidence that management agrees the stock is rich
- 📊 Stock gaps down through $350 gamma support, cascading through $340 to $330
- 📈 Analysts cannot justify raising targets - stock is already 35% above the $254 average PT
Put trade P&L (Bear Put Spread interpretation at $330): Maximum profit = ($352.50 - $330) x 1,500 x 100 = $3.375M gain on $1.3M risk = +260% ROI
Put trade P&L (Standalone puts interpretation at $310): $352.50 put worth $42.50/share ($6.375M) + $330 put worth $20/share ($3.0M) = $9.375M total value vs $6.3M cost = +$3.075M gain (+49% ROI)
This is the scenario the put buyer is banking on. After a 58% rally into earnings, even a solid-but-not-spectacular report could trigger a classic "sell the news" pullback of 7-12%.
🎯 Base Case (40% probability)
Target: $340-$360 range
Most likely scenario:
- ✅ Earnings beat modestly - revenue comes in at $1.40B-$1.43B (top end of guidance)
- 📊 Guidance reiterated at $5.7B-$6.1B with positive commentary on scale-across timing but no formal raise
- ⚖️ Gross margins in-line at 43-44% as guided
- 💤 Post-earnings IV crush as implied vol collapses
- 🔄 Stock settles in the $340-$360 range as the market digests a good-but-not-great print
- 📈 $350 gamma support holds, $357.50 gamma wall caps upside
Put trade P&L (Bear Put Spread at $350): $352.50 put worth ~$2.50/share ($375K) minus $330 put worthless = net spread value $375K vs $1.3M cost = -$925K loss
Put trade P&L (Standalone puts at $355): Both puts essentially worthless = -$6.3M loss (100% of premium)
In this scenario, the put trade loses money. The stock stays range-bound and the earnings event does not deliver the downside the trader was positioned for.
📈 Bull Case (25% probability)
Target: $375-$418
How we get there:
- 🚀 Blowout earnings - revenue above $1.45B with FY2026 guidance raised above $6.1B
- 💪 Scale-across revenue materializing faster than expected with specific customer win details
- 📊 Gross margin beats at 44%+ on favorable product mix and WaveLogic 6e ramp
- 🤝 New customer win or expanded deployment announcements
- 📈 Stock breaks through the $357.50 gamma wall and squeezes higher
- 💰 Analysts forced to dramatically raise price targets above the current $254 consensus average
- 🎯 Implied move upper range of $374.25 (weekly) and $417.90 (monthly) provides the roadmap
Put trade P&L: Both puts expire worthless = -$6.3M loss (100% of premium)
This is the worst-case scenario for the put buyer. A blowout report sends CIEN to new all-time highs, and the entire $6.3M premium evaporates overnight.
💡 Trading Ideas
🛡️ Conservative: "Earnings Insurance" - Bear Put Spread
Play: Buy the CIEN March 6 $345 put, sell the March 6 $325 put
Structure: $345/$325 bear put spread, expires the day after earnings
Why this works:
- 📊 Rides the same bearish earnings thesis as the $6.3M whale trade at a fraction of the cost
- 🛡️ Defined risk: you can only lose the net debit paid (roughly $6-$9 per spread)
- 💰 Max profit: $20 per spread minus debit paid (~$11-$14 gain per spread) if CIEN drops below $325
- 📈 The $345 strike is roughly 3% below current price - a very realistic post-earnings dip target that aligns with $345 gamma support
- ⚖️ Even a modest 5% earnings selloff to $337 would put this spread nicely in the money
- ⏰ Only holding through one event - no long-term time decay worry
Position sizing: Risk no more than 2-3% of portfolio. 10 spreads at ~$8 each = ~$8,000 risk for ~$12,000 max profit.
Risk level: Moderate (defined risk, short-dated) | Skill level: Intermediate
⚖️ Balanced: "Play Both Sides" - Pre-Earnings Straddle
Play: Buy the CIEN March 6 $355 call and $355 put (same strike, same expiration)
Structure: At-the-money straddle capturing the full earnings move
Why this works:
- 🎢 Profits from a BIG move in either direction - you do not need to pick a side
- 📊 CIEN has historically moved 8-15% on earnings - if the straddle is priced for less than that, you have edge
- 💥 A 10% move to either ~$319 or ~$390 would generate significant profit
- 🤖 Captures the full pre-market gap and the first day of post-earnings trading
- ⚖️ Removes the directional guesswork - just bet on magnitude
Why it could struggle:
- 💸 Pre-earnings straddles are expensive because IV is already elevated at 5.5% weekly implied move
- 📉 If CIEN moves less than the implied amount (~5-6%), both legs lose to IV crush
- ⏰ Expires the next day - zero room for recovery if the initial move disappoints
- 📊 A "meet expectations" result could leave the stock flat and destroy the entire premium
Position sizing: 5-10 straddles. Be prepared to lose the full debit if the stock does not move enough.
Risk level: Moderate-High (need a big move) | Skill level: Intermediate-Advanced
🚀 Aggressive: "Follow the Whale" - Near-ATM Put Buy
Play: Buy CIEN March 6 $350 puts outright
Why this works (and why it is risky):
- 💥 Mirrors the institutional whale's bearish earnings thesis at a highly liquid strike
- 📊 $350 is the strongest immediate gamma support - if it breaks, the downside opens to $330
- 📉 A 5% post-earnings drop to ~$337 makes these puts worth ~$13 on a likely ~$20-$25 entry
- 🚀 A 10% drop to ~$319 makes them worth ~$31 - potentially a 50%+ return
- 🐋 You are aligning with someone who just spent $6.3M on the same thesis
- 📈 38 insider sales, 0 purchases, $37.2M in selling over 6 months - the people running the company agree it is expensive
Why it could blow up:
- 💸 Premium is expensive with earnings IV baked in - you are paying up for protection
- 📈 If CIEN beats and gaps higher, these go to zero instantly
- ⏰ ONE day after earnings to capture the move - absolutely no second chances
- 🎰 This is essentially a binary bet on the earnings reaction - win big or lose everything
Position sizing: Risk ONLY what you can afford to lose completely. 5 contracts at ~$22 each = ~$11,000 at risk.
Risk level: HIGH (can lose 100% of premium overnight) | Skill level: Advanced
⚠️ Risk Factors
Do not get caught by these potential landmines:
-
📈 The rally has fundamental support: This is not just momentum trading. Ciena has a record $5B backlog, record $7.8B in FY2025 orders, 3 of 4 hyperscaler scale-across wins, and guidance raised to 24% revenue growth. Betting against this kind of fundamental momentum is risky.
-
🏦 S&P 500 passive bid creates a floor: With CIEN added to the S&P 500 on February 9, there is structural demand from index-tracking funds that did not exist before. This makes sharp selloffs harder to sustain.
-
🚀 Vesta 200 CPO launch today: Ciena just announced the industry's highest-density pluggable optical engine - positive product cycle sentiment heading into earnings could carry the stock higher.
-
💪 Guidance was already raised significantly: Management set Q1 revenue guidance at $1.35B-$1.43B, well above the prior $1.25B consensus. They do not typically set a bar they cannot clear.
-
😰 BUT - stock is 35% above average analyst target: The consensus is $254 and the stock trades at ~$355. Even the street-high $305 from Rosenblatt is 14% below here. The stock has gotten way ahead of where the Street thinks it should be.
-
💸 Forward P/E of ~51x is stretched: Ciena trades at ~51x forward earnings compared to Nokia at ~18x and Cisco at ~16x. That is pricing in near-perfect execution - one stumble and the multiple compresses fast.
-
🏃 Insider selling is relentless: 38 insider sales, ZERO purchases in the past 6 months, totaling $37.2M. When the people who know the company best are all selling, that is worth paying attention to.
-
📊 Customer concentration risk: Top 5 customers = ~50% of revenue, with a single cloud provider at ~18%. Any hint of order delays or pushouts from a major customer would hit hard.
-
🏭 Margin improvement is back-loaded to H2: Management expects gross margin improvement weighted toward H2 FY2026. Q1 margins might look flat sequentially even if they are "on plan," potentially disappointing investors expecting immediate improvement.
-
⚔️ Nokia-Infinera reaching full synergy mid-2026: The merged entity creates a rival with comparable scale and pooled R&D. Pricing pressure could emerge faster than Ciena bulls expect.
-
🌐 Supply chain still constrained: CEO expects the supply situation to only start improving in 2027. Component shortages and elevated input costs could pressure near-term margins.
🎯 The Bottom Line
Here's the deal: Someone with serious capital just put $6.3 million on the table betting CIEN drops after its March 5 earnings report. These puts expire the very next day - March 6 - making this about as pure an earnings bet as you can make. The structure is clear: two put buys at $352.50 (near-the-money) and $330 (deep downside), both brand new positions executed at the exact same second.
What this trade tells us:
- 🎯 Institutional money sees meaningful downside risk into earnings - specifically targeting the $330 area (~7% drop)
- 💰 They are willing to risk $6.3M (or $1.3M net if it is a spread) on this thesis, suggesting they have done serious work on the earnings setup
- ⏰ The March 6 expiration is surgical: capture the earnings event and nothing else - no thesis drift, no time decay bleed
- 📊 The identical timestamp, volume, and expiration on both legs screams coordinated institutional execution
- 🐋 When someone spends this kind of money on 9-day puts, they are not guessing - they have a view
The bull/bear tension is real:
On one hand, Ciena's fundamentals are legitimately strong - record backlog, hyperscaler wins, technology leadership with WaveLogic 6, and an AI-driven supercycle in optical networking. On the other hand, the stock is priced for perfection at 51x forward earnings, trades 35% above the average analyst target, and insiders have been selling hand over fist.
If you're bearish heading into earnings:
- ✅ Consider defined-risk put spreads (like the $345/$325 suggested above) rather than naked puts
- 📊 The $350 gamma support is the first line to watch - a break below opens the path to $330
- ⏰ Remember: these options expire THE NEXT DAY. Size appropriately for a binary outcome.
- 🐋 You have a $6.3M whale on your side - but even whales can be wrong
If you're bullish and own the stock:
- 🛡️ The $6.3M put trade is a warning sign - consider buying some put protection or taking partial profits before March 5
- 📈 If you believe in the long-term AI optical story, a post-earnings dip to $330-$340 could be an excellent buying opportunity
- ⚖️ Consider selling covered calls at $370-$380 against your position to generate income heading into the event
- 📊 Set a mental stop at $340-$350 (gamma support zone) - if that breaks post-earnings, momentum could carry toward $305-$330
If you're watching from the sidelines:
- 🎯 Wait for the earnings dust to settle before initiating a new position - do NOT chase at these levels
- 📊 A pullback to $310-$330 (gamma support cluster) would offer a much better risk/reward entry
- 📈 The analyst consensus average of ~$254 with a range up to $305 from Rosenblatt suggests significant downside risk from current levels
- ⏰ Post-earnings IV crush will make options 40-50% cheaper - better time to deploy capital
- 💤 The OFC 2026 conference (March 15-19) is the next potential catalyst after earnings
Key dates to mark:
- 📅 March 5, 2026 (pre-market) - Q1 FY2026 earnings report and 8:30 AM ET call - THE EVENT
- 📅 March 6, 2026 - These $6.3M puts expire - moment of truth for the trade
- 📅 March 15-19, 2026 - OFC 2026 conference in Los Angeles - Vesta 200 demo and industry validation
- 📅 March 20, 2026 - Monthly/Triple Witch OPEX
- 📅 Early June 2026 - Q2 FY2026 earnings - next guidance checkpoint
Final verdict: Ciena's transformation into an AI optical networking leader is legitimate - WaveLogic 6 technology leadership, the Vesta 200 CPO launch, hyperscaler scale-across wins, and a record $5B backlog are all real competitive advantages. But at 58.5% in three months with 51x forward P/E, the risk/reward heading into earnings is NOT in your favor for new positions. The $6.3M institutional put buy is a clear signal: smart money respects the story but is managing risk ahead of the binary event.
Be patient. Let earnings clear. The AI optical networking opportunity will still be there next week - and you will likely get a better entry price one way or another. Protect your capital first. 💪
Disclaimer: Options trading involves substantial risk of loss and is not suitable for all investors. This analysis is for educational purposes only and not financial advice. Past performance does not guarantee future results. Short-dated puts expiring the day after earnings are extremely high-risk instruments that can lose 100% of premium overnight. Always do your own research and consider consulting a licensed financial advisor before trading.
About Ciena Corporation: Ciena Corporation designs, manufactures, and sells networking equipment, including optical transport systems, packet networking platforms, and software automation tools for telecommunications carriers, cable operators, and hyperscale cloud providers globally. The company's solutions enable high-bandwidth, reliable data transport for AI infrastructure, cloud computing, and next-generation network architectures, with a market cap of $48.5B in the Telephone & Telegraph Apparatus industry.