🛒 COST Options Analysis: Big Money Bets on Costco's Pullback
September 26, 2025 | Unusual Options Activity Alert
🏢 Company Overview
Costco Wholesale Corp (COST) 📊 Market Cap: $418.3 Billion 🛍️ Sector: Retail (Variety Stores) 💼 Employees: 333,000
Costco operates a membership-based warehouse club model, offering bulk products at low prices through a frugal cost structure. With over 600 warehouses in the US and 280 internationally, Costco dominates the warehouse club industry with over 60% market share. Think of it as the place where you go to buy 48 rolls of toilet paper and somehow leave with a kayak and a year's supply of almonds. 🎯
🚨 Unusual Options Activity Detected
Today's tape lit up with some serious put buying activity. Let me break down exactly what happened at 13:55:40:
📋 Options Flow Detail (September 26, 2025)
| Time | Symbol | Buy/Sell | Type | Expiration | Premium | Strike | Volume | OI | Size | Spot Price | Option Price | Option Symbol |
|---|---|---|---|---|---|---|---|---|---|---|---|---|
| 13:55:40 | COST | BUY | PUT | 2025-10-17 | $5.1M | $1,050 | 384 | 58 | 380 | $917.64 | $134 | COST20251017P1050 |
| 13:55:40 | COST | BUY | PUT | 2025-10-17 | $4.6M | $1,100 | 250 | 21 | 250 | $917.64 | $183.8 | COST20251017P1100 |
| 13:55:40 | COST | BUY | PUT | 2025-10-17 | $979K | $1,055 | 70 | 7 | 70 | $917.64 | $139.8 | COST20251017P1055 |
| 13:55:40 | COST | BUY | PUT | 2025-10-17 | $863K | $1,060 | 60 | 8 | 60 | $917.64 | $143.9 | COST20251017P1060 |
Total Premium Spent: $11.5 Million 💰
🎯 What This Means in Plain English
Someone (or multiple someones) just dropped $11.5 million betting that COST will fall below these strike prices by October 17th. Here's the kicker - all these strikes are WAY above the current price of $917.64:
- The $1,050 strike is 14.4% above current price
- The $1,100 strike is 19.9% above current price
Wait, that doesn't make sense, right? Let me explain what's really happening here...
These are likely protective puts - basically expensive insurance policies. Big institutions who own millions of dollars worth of COST stock are buying protection in case the stock drops. They're not necessarily betting on a crash, they're just making sure their portfolios don't get crushed if one happens.
Unusual Score: 8.5/10 🔥 (Based on the $5.1M single premium trade relative to typical daily flow)
📊 Technical Analysis
Year-to-Date Performance
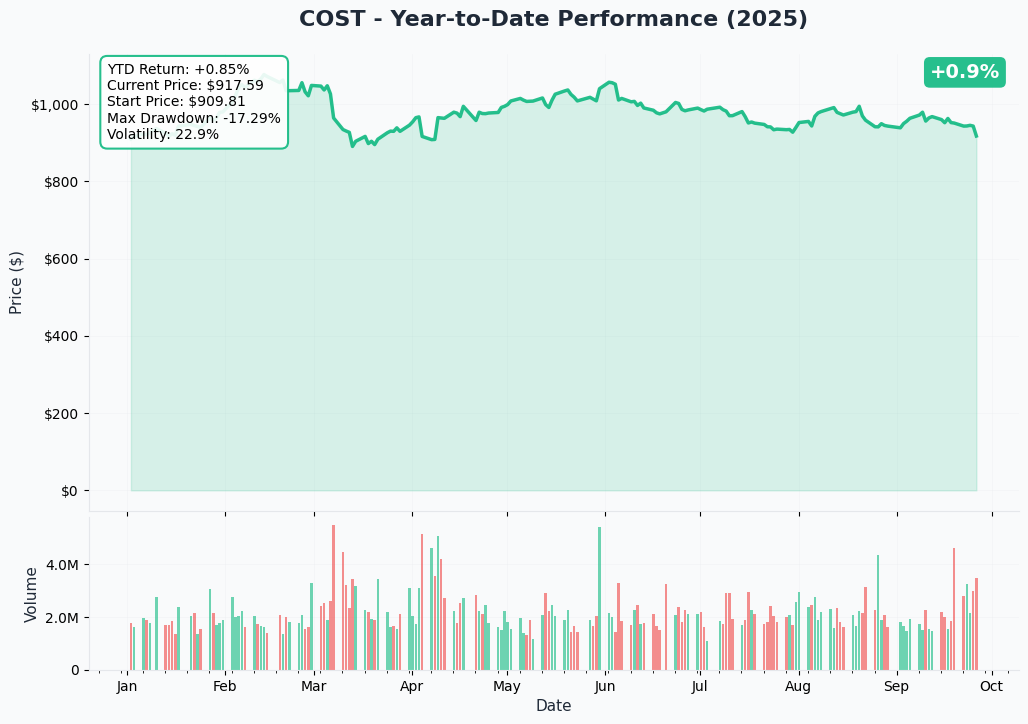
Looking at the YTD chart, COST tells an interesting story:
- YTD Return: +0.85% (basically flat)
- Current Price: $917.59
- Starting Price: $909.81
- Peak: ~$1,050 (March 2025)
- Max Drawdown: -17.3% from peak
The stock had a strong run early in the year, peaking around $1,050 in March, but has been in a steady downtrend since. We're now sitting near the lows of the year. Volume has been picking up recently, suggesting increased interest (both bulls and bears are battling it out).
🎯 Gamma Levels & Key Support/Resistance
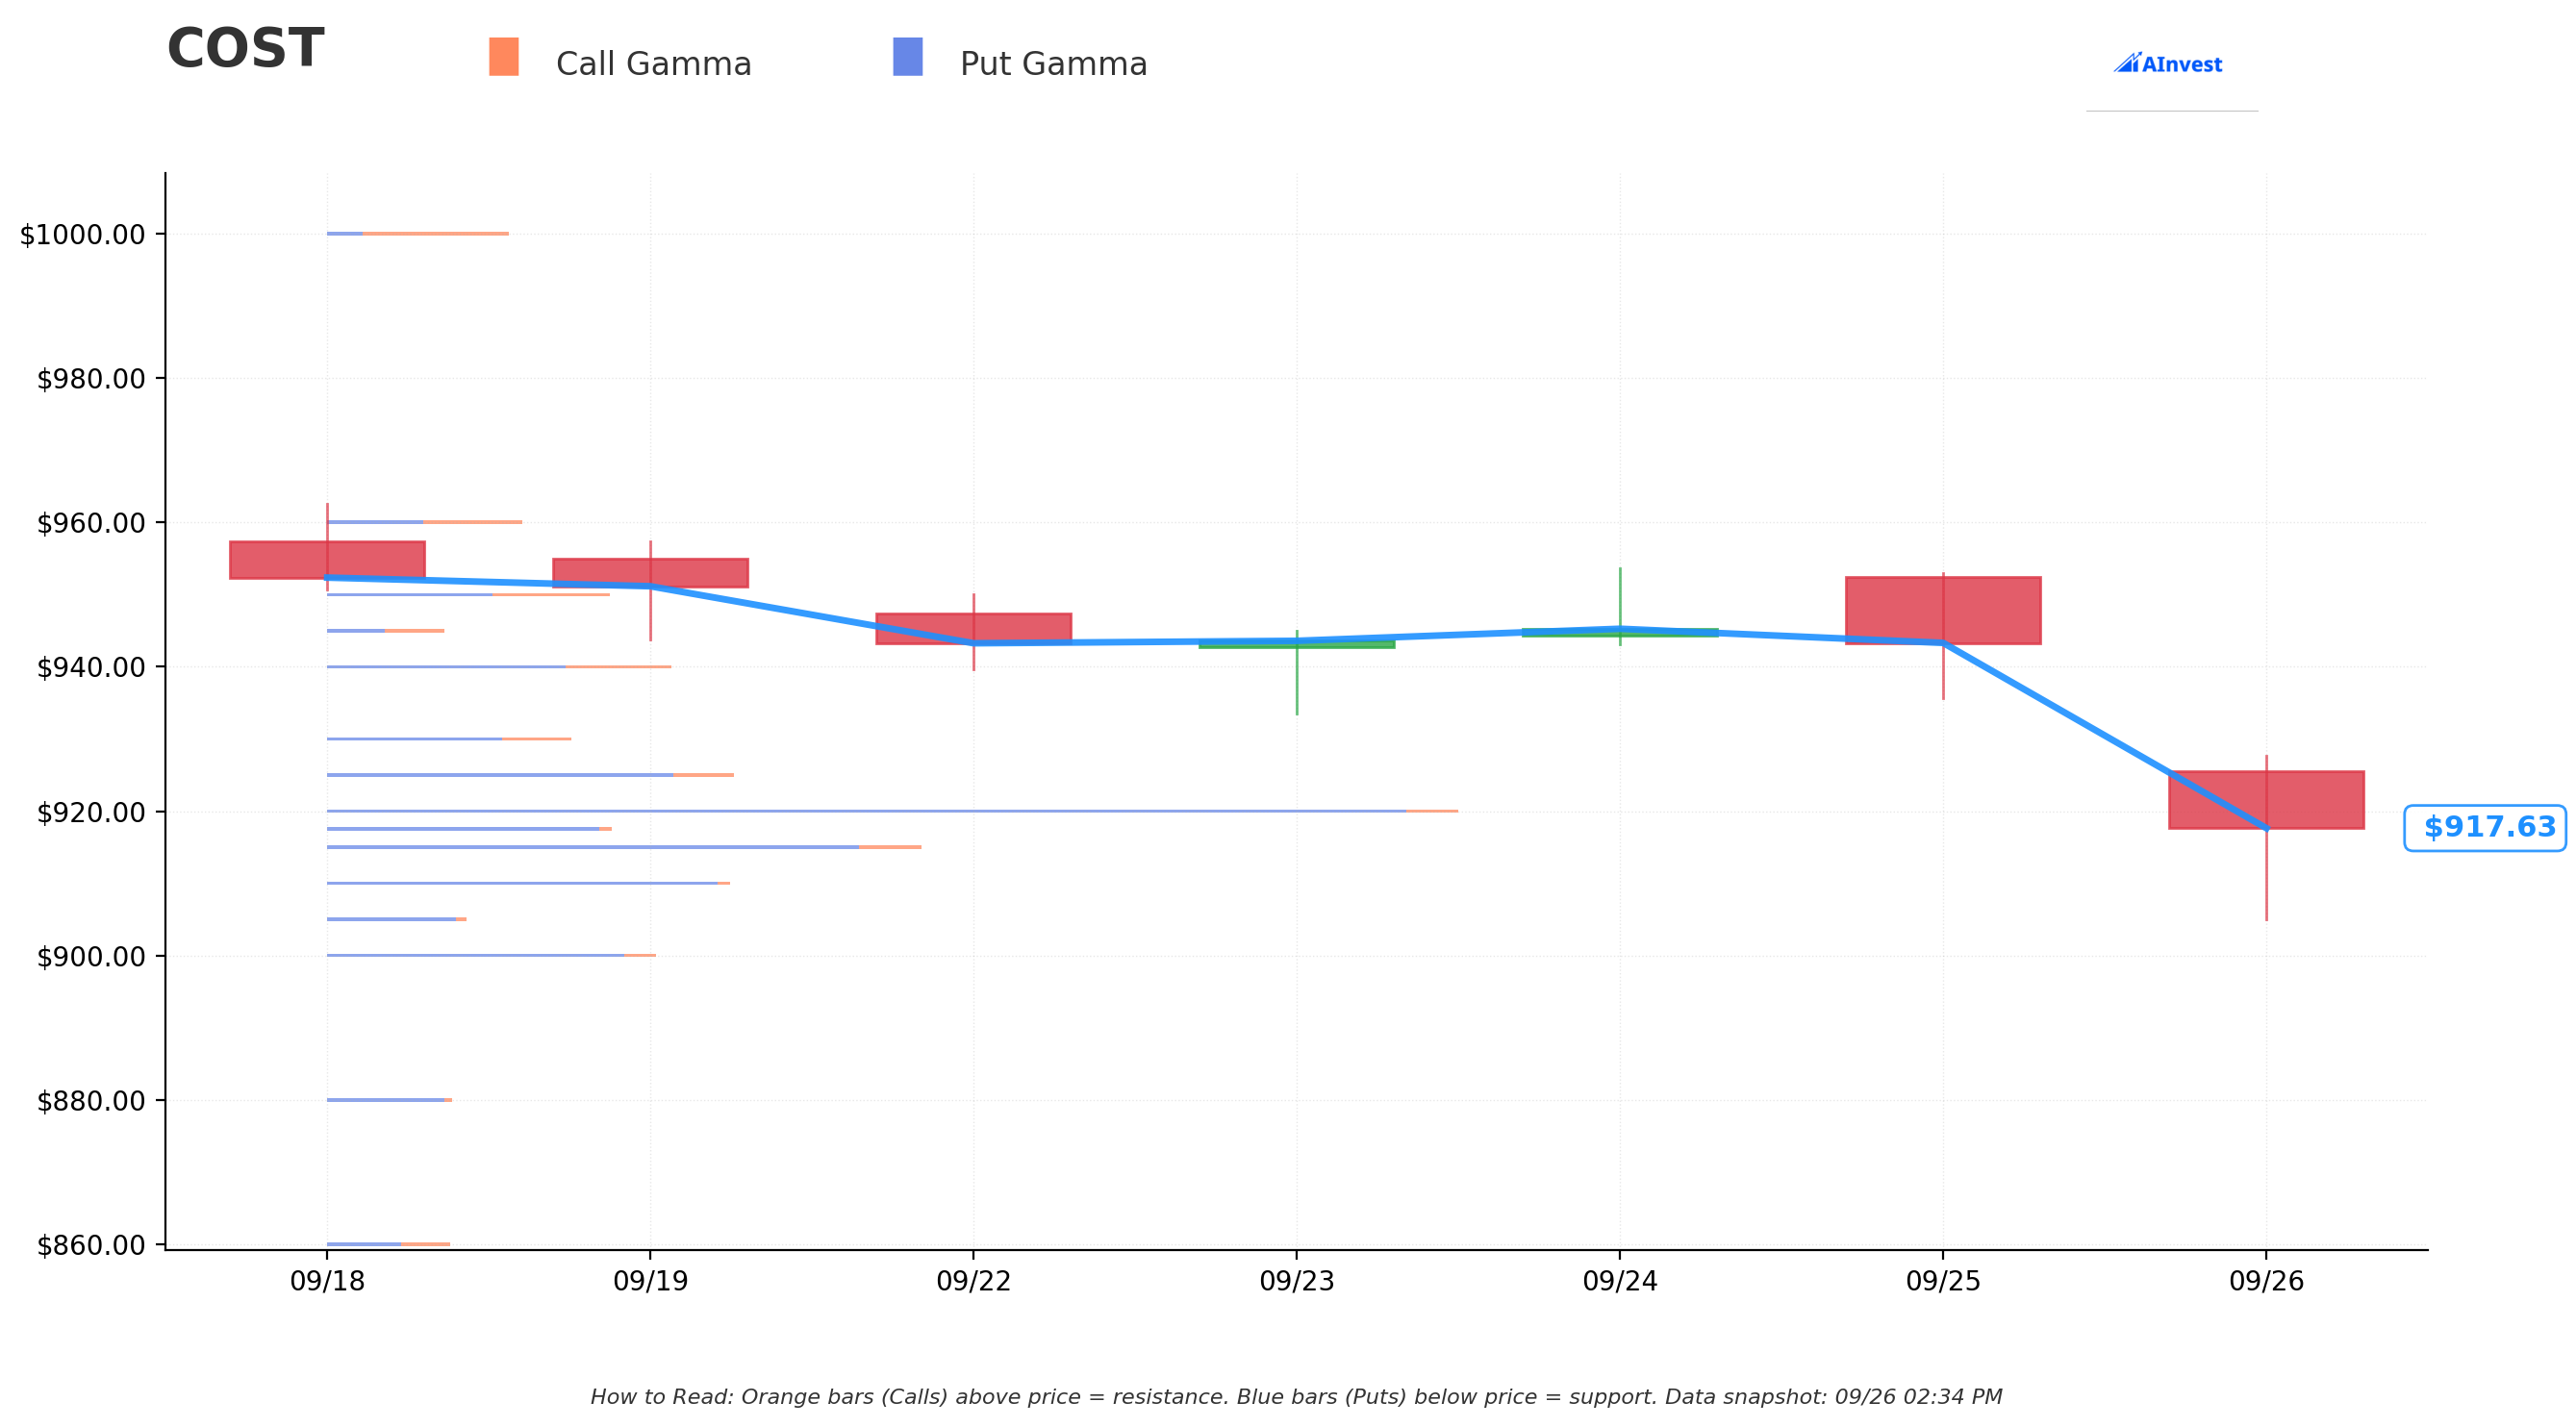
Let me translate the gamma chart into something useful. Think of these levels as magnets for the stock price:
Key Support Levels (Where buying might come in):
- $917.50 - Immediate support (strongest gamma level) 🛡️
- $915.00 - Secondary support
- $910.00 - Major support floor
- $900.00 - Psychological level & gamma support
Key Resistance Levels (Where selling pressure builds):
- $920.00 - Immediate resistance (massive gamma wall) 🧱
- $925.00 - Next resistance
- $930.00 - Breaking above here changes the game
- $940.00 - Major resistance zone
The gamma chart shows we're currently stuck between $917.50 support and $920 resistance - a super tight range. The blue put gamma below suggests strong support, while the red call gamma above creates resistance. We're basically in a pressure cooker here. 🍲
📰 Catalyst Research & Upcoming Events
✅ Recently Completed
- Q4 2025 Earnings (Sept 25): Beat on EPS ($5.87 vs $5.81 expected), Revenue up 8% YoY ^1
- Membership Fee Increase (Sept 2024): First hike in 7 years, adding ~$290M to income ^2
🔜 Upcoming Catalysts
Near Term (Next 30 Days):
- Holiday Sales Preview - Early October data releases
- October Comparable Sales - Due first week of November
- Tariff Policy Updates - Ongoing monitoring of 25% Canada/Mexico tariffs ^3
Medium Term (Q4 2025 - Q1 2026):
- 35 New Store Openings planned for fiscal 2026 ^4
- China Expansion - Continued growth from 7 current locations ^5
- Japan Target - Aiming for 60 warehouses by 2030 (currently 37) ^6
- Digital Growth - E-commerce growing 13.6% YoY ^7
⚠️ Risk Factors
- Valuation Concerns: Trading at 47-53x forward earnings (expensive!) ^8
- Tariff Pressures: Potential margin squeeze from import tariffs ^9
- Consumer Spending: Management noted weakening demand for discretionary items ^10
🎯 Price Targets & Probabilities
Based on gamma levels and technical analysis:
🐂 Bull Case: $940-950
- Probability: 25%
- Catalyst: Strong holiday sales, tariff relief, membership growth surprises
- Timeline: 2-3 months
📊 Base Case: $915-925
- Probability: 50%
- Catalyst: Steady execution, inline comps, range-bound trading
- Timeline: Next 30 days
🐻 Bear Case: $900-910
- Probability: 25%
- Catalyst: Tariff implementation, consumer slowdown, valuation reset
- Timeline: If breaks $915 support
💡 Trading Ideas
🛡️ Conservative Play: Cash-Secured Put
Sell COST Oct 18 $910 Put @ $3.50
- Collect $350 premium per contract
- Break-even: $906.50
- Win if COST stays above $910 (current support)
- Risk: Owning COST at $910 if assigned
⚖️ Balanced Strategy: Put Spread
Buy COST Nov 15 $920 Put @ $12.00 Sell COST Nov 15 $900 Put @ $4.50
- Net Cost: $750 per spread
- Max Profit: $1,250 (if COST at/below $900)
- Break-even: $912.50
- Good risk/reward for bearish view
🚀 Aggressive Play: Call Calendar Spread
Sell COST Oct 18 $925 Call @ $3.20 Buy COST Nov 15 $925 Call @ $8.50
- Net Cost: $530 per spread
- Profits from time decay if COST stays near $925
- Benefits if volatility increases after Oct expiration
- Max profit at $925 at October expiration
🎬 Bottom Line
Look, someone just spent $11.5 million on put protection - that's not pocket change. But before you panic, remember these are way out-of-the-money puts that are likely portfolio insurance from big funds.
The stock is sitting right at a critical support level ($917.50) after already falling 17% from its March highs. The gamma setup suggests we're coiled for a move - either a bounce off support toward $930, or a breakdown toward $900.
My Take: The heavy put buying combined with stretched valuation (50x earnings is rich for retail) suggests caution. But COST is a quality company with solid fundamentals. I'd wait for either:
- A break below $915 to get bearish
- A bounce above $925 to get bullish
- Or sell puts at $900-910 to collect premium while we wait
Remember: This is a marathon stock, not a sprint. Don't bet the farm on short-term moves. The institutions buying those puts aren't betting on disaster - they're just being careful. You should be too. 💪
Disclaimer: This analysis is for educational purposes only. Always do your own research and manage your risk. Options trading involves substantial risk of loss.
Data Sources:
- Options flow data from tape analysis
- Gamma levels from GEX calculations
- Price data from market feeds
- Company information from Polygon.io API
- Catalyst research from cited sources