🐻 CRM Bear Put Spread Unwind: $35M Smart Money Exit!
📅 December 31, 2025 | 🔥 Unusual Activity Detected
🎯 The Quick Take
Someone just unwound a massive $35M bear put spread on Salesforce (CRM) just 16 days before expiration! This isn't a retail trader closing positions - this is institutional money taking profits or cutting losses on a bearish bet. The timing is interesting: right at year-end with the stock down 21% YTD, and just before Q4 earnings expected late February. Let's break down what smart money is doing...
🏢 Company Overview
Salesforce, Inc. (CRM)
- Market Cap: $249.2 billion
- Sector: Software Services - Prepackaged Software
- What They Do: Salesforce is the leading enterprise cloud computing provider specializing in customer relationship management (CRM). Their Customer 360 platform integrates customer data across systems to enable sales, service, marketing, and commerce functions. The portfolio includes Service Cloud for support, Marketing Cloud for campaigns, Commerce Cloud for e-commerce, plus MuleSoft for data integration and their new AI-powered Agentforce platform.
💰 The Option Flow Breakdown
📊 What Just Happened
Here's the complete breakdown of the massive year-end position unwind:
| Time | Symbol | Buy/Sell | C/P | Expiration | Strike | Premium | Volume | OI | Size | Spot | Option Price | Option Symbol |
|---|---|---|---|---|---|---|---|---|---|---|---|---|
| 14:58:05 | CRM | BUY | PUT | 2026-01-16 | $300 | $13.0M | 8,900 | 652 | 3,900 | $265.44 | $34.31 | CRM20260116P300 |
| 14:58:05 | CRM | SELL | PUT | 2026-01-16 | $320 | $9.0M | 3,700 | 99 | 1,660 | $265.44 | $54.25 | CRM20260116P320 |
| 14:58:05 | CRM | SELL | PUT | 2026-01-16 | $340 | $9.7M | 3,100 | 74 | 1,310 | $265.44 | $74.26 | CRM20260116P340 |
| 14:58:05 | CRM | SELL | PUT | 2026-01-16 | $310 | $3.9M | 2,100 | 52 | 880 | $265.44 | $44.50 | CRM20260116P310 |
Total Premium: $35M worth of bear put spread adjustments
🤓 What This Actually Means
Real talk: This is someone unwinding a complex bearish position on CRM. The classification shows these are "Bear Put Spread (Closing/Adjusting)" trades with MEDIUM confidence. Here's what's fascinating:
🔍 Z-Score Analysis:
- $300 PUT BUY: Z-Score of 3.94 = EXTREMELY UNUSUAL (this happens maybe a few times per year!)
- $320 PUT SELL: Z-Score of 2.57 = HIGHLY UNUSUAL (555x average size for similar activity)
- $340 PUT SELL: Z-Score of 2.64 = HIGHLY UNUSUAL
- $310 PUT SELL: Z-Score of 1.62 = ABOVE AVERAGE
Translation for us regular folks: This trader was betting CRM would drop below $300 by mid-January 2026. They bought the $300 put for downside exposure and sold the $320/$340/$310 puts to offset costs. Now they're closing it all out.
📈 Volume vs Open Interest Signals:
- Volume-to-OI ratios are sky-high (13.65x to 41.89x), meaning these are definitely CLOSING trades, not new positions
- All four legs show "HIGH_ACTIVITY" volume signals
- The synchronized timing (all at 14:58:05) confirms this is a single institutional trade, not retail
Why close now? Either they're:
- 📈 Taking profits if they entered when CRM was higher ($300+)
- 🛑 Cutting losses as CRM stabilizes around $265
- 🔄 Rolling to different strikes/dates ahead of Q4 earnings
📈 Technical Setup
YTD Chart Analysis
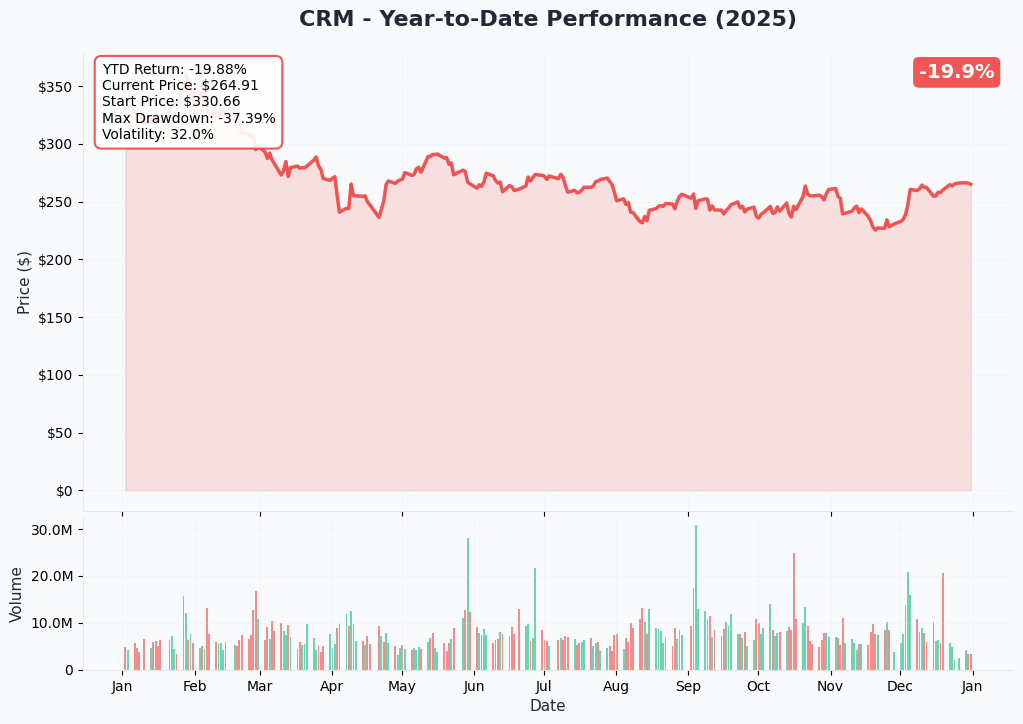
The YTD chart tells a brutal story for CRM bulls. After hitting an all-time high of $365.07 in early December 2024, the stock has crashed 27.6% to current levels around $265. That's not a correction - that's a bear market in a single name!
Key observations from the chart:
- 📉 Clear downtrend since December 2024 highs
- 💔 Lost $100 per share in just over a year
- 🎯 Currently testing the $260-$265 support zone
- 📊 Recent stabilization pattern forming - potential base building?
The aggressive bear put spread unwind makes sense in this context. If someone bought these puts when CRM was trading $300+, they're sitting on massive profits and year-end is the perfect time to lock them in.
🔵 Gamma-Based Support & Resistance Analysis
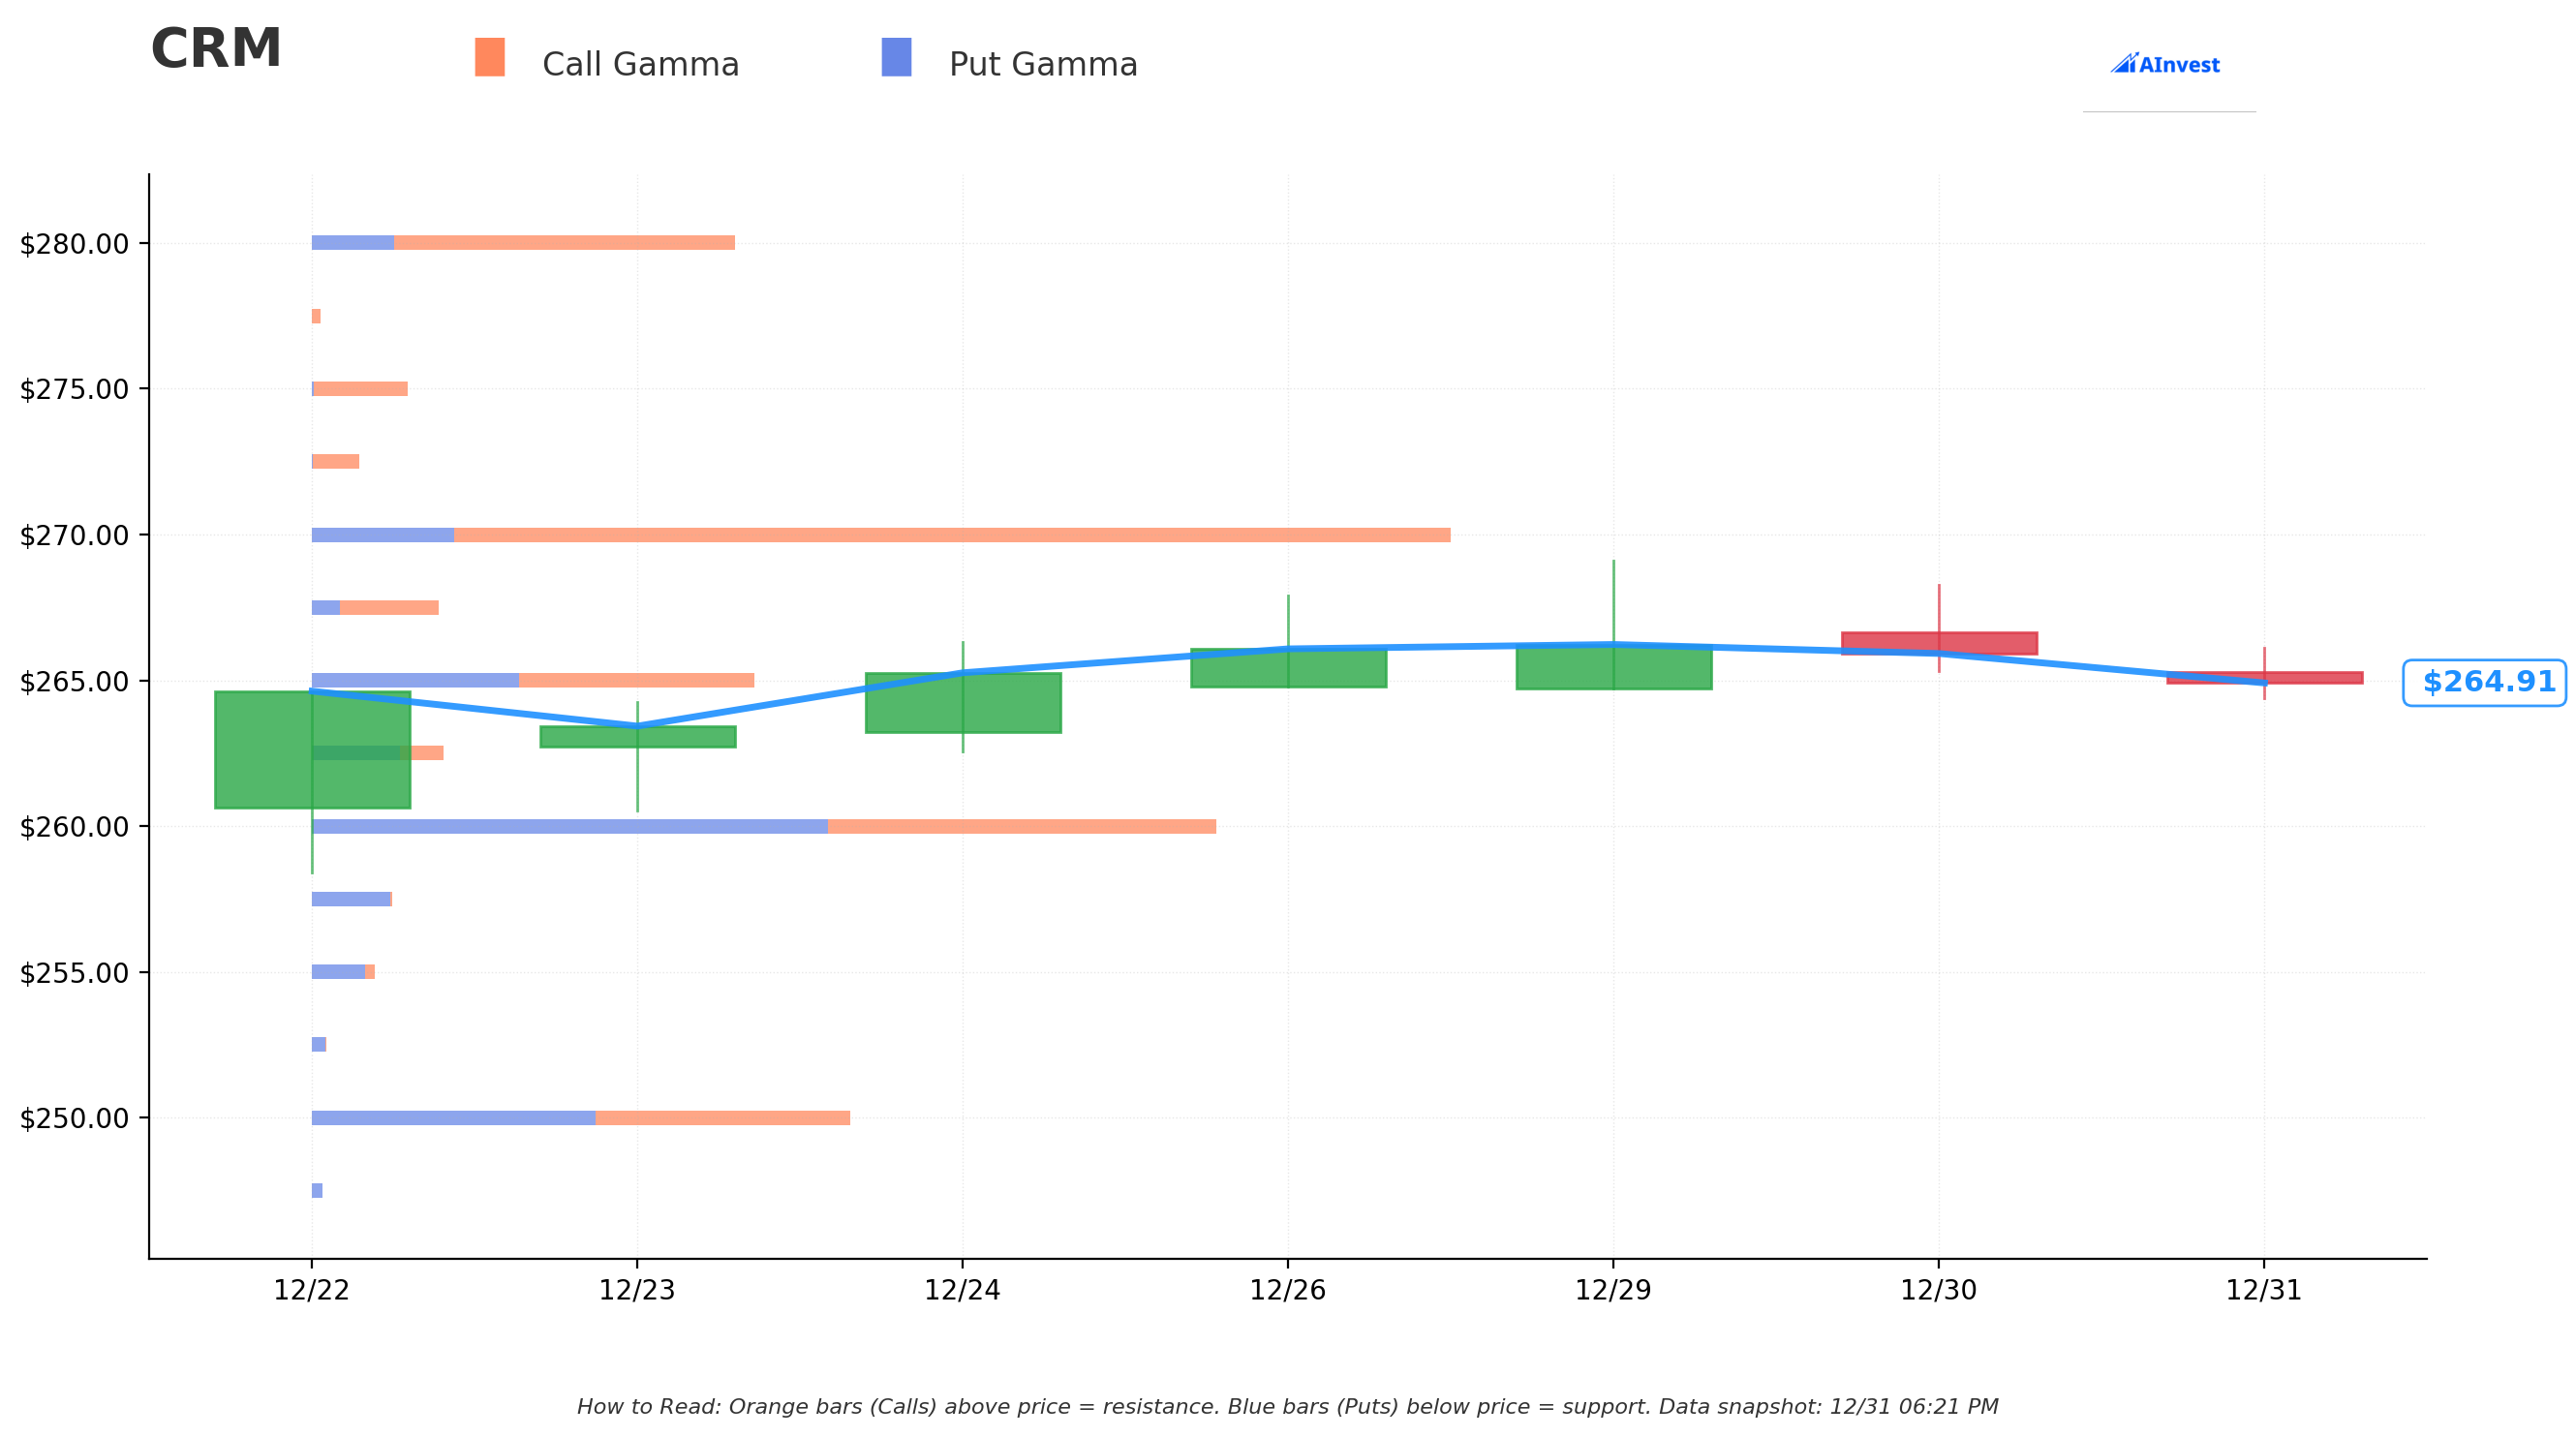
Here's where it gets interesting for 2026 trading...
The gamma exposure map shows where option dealers have concentrated positions - these act as magnets for price action. Think of it like this: big bars = strong levels where the stock tends to pause or reverse.
Support Levels (Blue Bars - Put Gamma):
- 🛡️ $260: Strongest support (17.29M total GEX, -2.33M net) - just 1.85% below current price
- 🛡️ $250: Secondary support (10.26M total GEX) - critical psychological level
- 🛡️ $240: Tertiary support (4.76M total GEX) - would represent a 9.4% drop
- 🛡️ $230: Deep support (2.88M total GEX) - bear case floor
Resistance Levels (Orange Bars - Call Gamma):
- 🚧 $265: Immediate micro-resistance (8.60M total GEX) - basically at current price
- 🚧 $270: First real resistance (22.22M total GEX, 16.79M net) - MASSIVE call gamma wall here!
- 🚧 $280: Secondary resistance (8.23M total GEX) - 5.7% above current
- 🚧 $290: Major resistance (3.66M total GEX) - reclaim would be very bullish
- 🚧 $300: Psychological resistance (4.33M total GEX) - where the bear put spread was anchored
The Big Picture: Net GEX bias is BULLISH with 67.83M call GEX vs 41.46M put GEX. But that huge $270 call gamma wall tells the real story - dealers are short tons of $270 calls, which means the stock might struggle to break through there without a major catalyst. The floor at $260 looks solid though, which aligns with the recent price stabilization we're seeing.
📊 Implied Move-Based Analysis
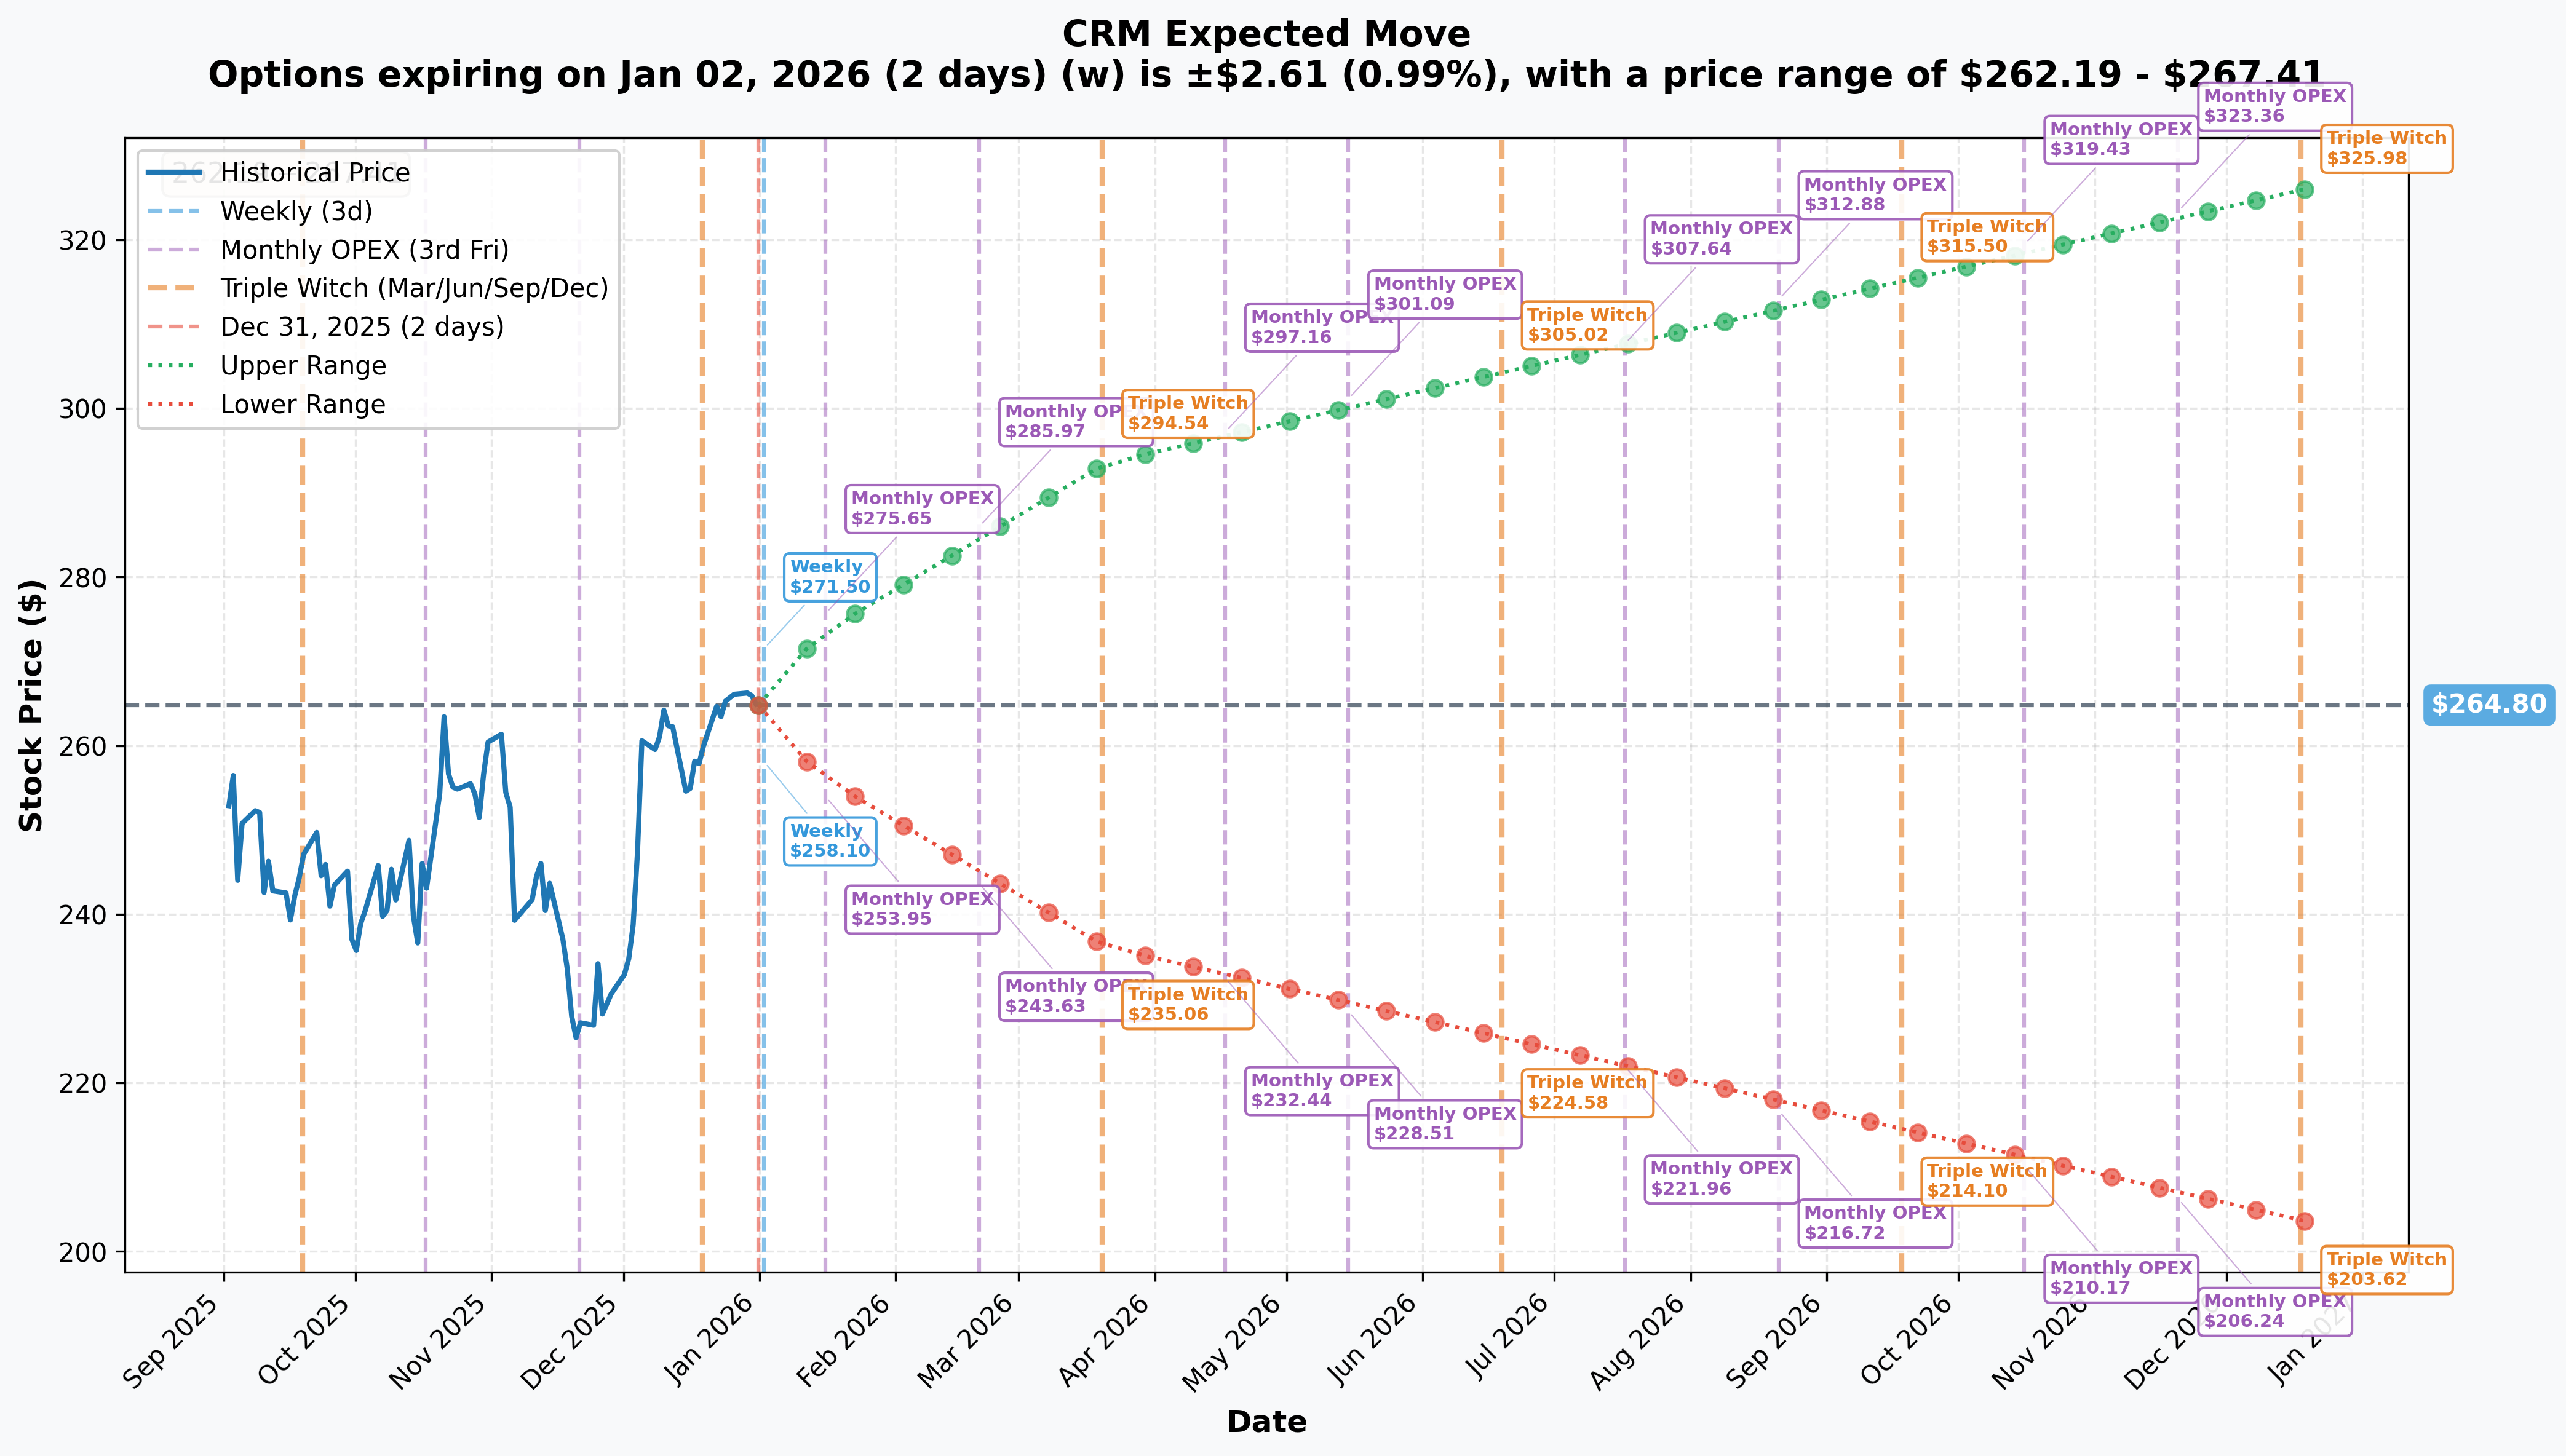
The implied volatility market is pricing in some serious potential movement across different timeframes:
Weekly (2026-01-02 expiry - 2 days out):
- Implied Move: ±0.99% ($2.61)
- Range: $262.19 - $267.41
- Translation: Dead week ahead - market expects basically no movement post-New Year's
Monthly OPEX (2026-01-16 expiry - 16 days out):
- Implied Move: ±3.39% ($8.97)
- Range: $255.83 - $273.77
- Translation: This is the exact expiration for those unwound bear puts! Market pricing a $9 move in either direction
Quarterly Triple Witch (2026-03-20 expiry - 79 days out):
- Implied Move: ±10.83% ($28.67)
- Range: $236.13 - $293.47
- Translation: Buckle up! This includes Q4 earnings (late Feb) where Agentforce numbers will be scrutinized
Yearly LEAPs (2026-12-18 expiry - 352 days out):
- Implied Move: ±23.1% ($61.18)
- Range: $203.62 - $325.98
- Translation: Market sees a massive $122 potential range for 2026 - from disaster to recovery
The monthly OPEX range ($255.83-$273.77) perfectly frames our gamma levels. Notice how the $260 gamma support and $270 gamma resistance match the implied move boundaries? That's not coincidence - that's where the real battle lines are drawn.
🎪 Catalysts
Already Happened (Past Catalysts)
✅ Q3 Fiscal Year 2026 Earnings (December 3, 2025):
- Revenue: $10.26B, up 9% YoY - beat expectations
- Non-GAAP EPS: $3.25 vs $2.86 consensus (14% beat)
- Record 35.5% operating margin
- Yet stock still declined on competitive concerns
✅ Informatica Acquisition Closed (November 18, 2025):
- $8B deal completed, strengthening data management for AI
- Expected to be accretive within 12 months
✅ Agentforce 2.0 Launch:
- 18,500 enterprise customers now on platform (up 48% from prior quarter)
- Combined Agentforce/Data 360 ARR: $1.4B (up 114% YoY)
- Described as "fastest growing product ever" in Salesforce history
Upcoming (Future Catalysts)
🔮 Q4 FY26 Earnings (February 25 or March 4, 2026):
- Consensus EPS: $3.05 expected
- Full year revenue guidance: $41.45-$41.55B
- KEY WATCH: Agentforce deal momentum, Data 360 ARR growth, Informatica integration progress
- This is THE catalyst that could break the $270 gamma ceiling or test $260 support
🔮 Informatica Integration Milestones (Q1-Q2 2026):
- Full integration with Data Cloud, MuleSoft, Agentforce 360 expected
- Revenue contribution target: ~3 percentage points to FY26 growth
- Margin accretion tracking - ahead of schedule per management
🔮 Dreamforce 2026 (September 15-17, 2026):
- Premier annual conference in San Francisco
- Expected Agentforce 3.0 announcements and AI platform evolution
- Historically major stock catalyst with product reveals
🎲 Price Targets & Probabilities
Let me combine the gamma levels, implied move data, and catalyst calendar to give you three realistic scenarios:
🐂 Bull Case ($280-$293) - 30% Probability
Path: Q4 earnings crush expectations with Agentforce deal count exceeding 25,000 customers and ARR accelerating to $2B+. Informatica integration ahead of schedule. Market realizes AI monetization timeline is pulling forward.
Key Levels:
- Break through $270 gamma wall (22.22M GEX) on earnings pop
- Clear $280 resistance (implied move allows for $273.77 by Jan OPEX)
- Target $293 (Q1 triple witch upper range)
What Needs to Happen:
- Earnings beat + raised FY27 guidance
- Macro sentiment shift favoring enterprise software
- Analyst upgrades following earnings
Trade Idea: Wait for confirmed $270 break, then buy $280/$290 call spreads
🎯 Base Case ($260-$270) - 50% Probability
Path: Stock continues consolidating in the gamma-defined range. Q4 earnings are solid but not spectacular. Agentforce growth continues but doesn't re-rate the multiple. Competition narrative persists with Microsoft/Oracle/SAP.
Key Levels:
- Defend $260 support (17.29M GEX) - strongest gamma floor
- Chop between $260-$270 through January OPEX
- Implied weekly move of just ±$2.61 supports this range-bound view
What Needs to Happen:
- In-line earnings, no major surprises
- Continued macro uncertainty on enterprise spending
- Neutral analyst commentary
Trade Idea: Sell premium via iron condors $255/$260/$270/$275
🐻 Bear Case ($236-$250) - 20% Probability
Path: Q4 earnings disappoint on weaker consumption trends. Agentforce deals slow as enterprises delay AI spending. Microsoft Dynamics gains market share. Macro deteriorates with recession fears.
Key Levels:
- Break $260 support on earnings miss
- Test $250 psychological level (10.26M GEX support)
- Worst case hits $236 (Q1 triple witch lower bound)
What Needs to Happen:
- Earnings miss or guidance cut
- Deteriorating enterprise IT spending data
- Competitive losses or pricing pressure
Trade Idea: If $260 breaks, buy $250/$240 put spreads for protection
Analyst Targets: The Street's average price target of $327 (range $223-$450) implies 23% upside, but these were mostly set before the recent selloff. More conservative targets around $300 from recent downgrades seem more realistic near-term.
💡 Trading Ideas
🛡️ Conservative: "Show Me The Money" Strategy
Setup: Wait for Q4 earnings clarity, then sell cash-secured puts at $260 support
Trade:
- SELL CRM Feb 21 $260 Puts
- Collect ~$8-10 per contract premium
- Breakeven: $250-252 (well below gamma support)
Why This Works:
- 💪 Strongest gamma support level at $260 (17.29M GEX)
- 📊 Implied move for monthly OPEX only goes down to $255.83
- 🎯 You're getting paid to potentially buy CRM at $260, which is 27% below all-time highs
- 🛡️ Even if assigned, you own a market-leading AI/CRM play at a discount
Risk Level: Low (you must be willing to own CRM at $260) Max Risk: $250 per contract (if CRM somehow goes to zero) Max Gain: $8-10 premium ($800-1,000 per contract)
⚖️ Balanced: "Gamma Sandwich" Strategy
Setup: Play the defined range with an iron condor targeting the $260-$270 gamma boundaries
Trade:
- SELL CRM Jan 16 $255/$260 Put Spread
- SELL CRM Jan 16 $270/$275 Call Spread
- Net Credit: ~$2.50-3.00 per spread
Why This Works:
- 🎯 Gamma walls at $260 (support) and $270 (resistance) define the range
- 📉 Implied weekly move is only ±$2.61 - market expects low volatility
- ⏰ Just 16 days to expiration = rapid time decay working for you
- 🏆 Profit if CRM stays between $257.50-$272.50 at Jan OPEX
Risk Level: Moderate (defined risk on both sides) Max Risk: $250 per spread (if stock moves >$5 beyond your strikes) Max Gain: $250-300 per spread (if stock stays in range) Probability of Profit: ~60-65% based on current IV
🚀 Aggressive: "Earnings Lottery Ticket" Strategy
Setup: Bet on a Q4 earnings catalyst breaking the $270 gamma ceiling with a call spread
Trade:
- BUY CRM Mar 20 $270 Calls
- SELL CRM Mar 20 $290 Calls
- Net Debit: ~$6-8 per spread
Why This Works:
- 🎯 Captures Q4 earnings expected late February
- 📊 Quarterly implied move goes up to $293.47 (your upper strike is $290)
- 💥 If Agentforce numbers explode higher, CRM could gap through $270 resistance
- 🚀 Analyst targets averaging $327 imply 23% upside - this spread captures half that move
- ⏰ March expiry gives you time for post-earnings momentum
The Kicker: Remember that massive $35M bear put spread that just closed? Smart money might know something about those upcoming earnings numbers...
Risk Level: High (can lose entire premium) Max Risk: $600-800 per spread Max Gain: $1,200-1,400 per spread (if CRM closes above $290 in March) Breakeven: $276-278 (need ~4-5% move from current levels)
⚠️ Risk Factors
Let's be honest about what could go wrong here:
Competitive Threats Are Real
- 🏢 Microsoft is crushing it: Dynamics 365 up 16% YoY while MSFT stock is up 24% vs CRM down 21% YTD. Microsoft's AI integration with Copilot is resonating with enterprise customers
- ⚡ Oracle/SAP momentum: Oracle stock up 78% YTD, SAP up 18.7%. Both showing stronger cloud growth than Salesforce
- 💰 Market share erosion risk: CRM holds ~22-29% of the market, but competitors are gaining
Agentforce Monetization Uncertainty
- ⏰ Revenue impact delayed: Management admits meaningful Agentforce revenue won't hit until FY2027, creating a "show me" moment
- 💸 Premium pricing resistance: Einstein 1 editions at $500/user/month may face enterprise budget pushback in a macro slowdown
- 🎰 Execution risk: $8B Informatica integration could hit snags
Macro Headwinds Persist
- 📉 Enterprise spending slowdown: Customers elongating purchase cycles and scrutinizing software budgets
- 🌍 Geographic concentration: 66% of revenue from Americas = heavy US recession exposure
- 💹 Valuation still rich: P/S ratio of 7.3x (vs S&P 500 at 3.0x) leaves little margin for error
Technical Risks
- 📊 Downtrend not broken: Stock still in clear downtrend from December 2024 highs
- 🐻 Year-end tax loss selling: That $35M bear put unwind might be just the start of year-end profit-taking
- 📈 Volume concerns: Heavy put activity and bear spread closing suggests smart money skepticism
That $270 Gamma Wall Is No Joke
The 22.22M GEX at $270 (16.79M net call gamma) represents massive dealer short call exposure. Breaking through that level without a major catalyst (like blowout earnings) will be extremely difficult. Price could get pinned there for weeks.
🎯 The Bottom Line
Real talk: CRM is at a crossroads heading into 2026.
What We Know:
- ✅ Agentforce is legitimately the fastest-growing product in Salesforce history (18,500 customers, $1.4B ARR, 114% growth)
- ✅ The $260 gamma support level is rock-solid with 17.29M total GEX
- ✅ $35M of bearish positioning just got unwound at year-end - someone's taking chips off the table
- ✅ Q4 earnings in late February will be THE catalyst to watch
- ✅ Analyst targets average $327 (23% upside) but with wide $223-$450 range showing uncertainty
What's Uncertain:
- ❓ Can Agentforce actually move the revenue needle in FY2027 or will it be table stakes by then?
- ❓ Will that $270 gamma wall act as a ceiling until we get an earnings catalyst?
- ❓ Are competitors (MSFT, ORCL, SAP) really taking market share or just riding a cloud wave?
- ❓ Is this year-end tax-loss selling creating a buy-the-dip opportunity or catching a falling knife?
Action Plan for Different Scenarios:
📊 If You Own CRM:
- Hold through Q4 earnings with a $255 stop loss (just below monthly implied move floor)
- Consider selling covered calls at $270 to collect premium against that gamma wall
- Mark your calendar for February 25/March 4 earnings - that's decision time
👀 If You're Watching:
- Wait for $260 support test to deploy capital (could happen if market sells off early January)
- Watch for $270 breakout on volume - that would signal trend change
- Best risk/reward probably comes AFTER earnings volatility settles
🐻 If You're Bearish:
- Don't fight the $260 gamma support without a clear catalyst
- If you must short, use defined-risk spreads (like put debit spreads $265/$255)
- Remember: the smart money that had those bear puts on just closed them for a reason
My Take: That $35M bear put spread closure tells me someone who was very bearish (positioned for sub-$300) is now done with that trade. Combined with the stock finding support at $265 and building a base, this feels more like capitulation than the start of a new leg down.
The gamma analysis suggests we're stuck in a $260-$270 range until Q4 earnings break us out. The implied move data confirms it - just ±3.39% for the monthly expiration. That's an option seller's paradise.
For aggressive traders, the risk/reward on bullish call spreads targeting $280-$290 for post-earnings looks compelling given analyst targets. For conservatives, selling puts at $260 support or iron condors in the $255-$275 range offers solid probability of profit.
Bottom line: CRM isn't dead, it's just... resting. And smart money just closed their bearish bets right before earnings. That's worth paying attention to. 👀
Disclaimer: Options trading involves substantial risk and is not suitable for all investors. The strategies discussed require active monitoring and can result in significant losses. Past performance does not guarantee future results. This analysis is for educational purposes only and should not be considered financial advice. Always conduct your own research and consult with a licensed financial advisor before making investment decisions. The unusualness scores (Z-scores) represent statistical analysis of historical trade patterns and do not predict future price movements.
Analysis Date: December 31, 2025 Data Sources: Options trade data, market analysis, and catalyst research CRM Stock Price at Analysis: $265.44