📊 EFA $12.8M Conversion Play - Sophisticated Hedge Adjustment Before Year-End! 💰
📅 November 10, 2025 | 🔥 Complex Institutional Activity Detected
🎯 The Quick Take
Someone just executed $12.8 MILLION in complex options positioning on the iShares MSCI EAFE ETF in back-to-back trades! These two multi-legged transactions - buying back puts for $7.6M and $4.6M while simultaneously selling calls for $350k and $210k - represent sophisticated institutional positioning at the $100 strike expiring January 16, 2026. With EFA trading at $95.15 and riding a historic 28.20% year-to-date rally powered by dollar weakness, smart money is adjusting their hedges and locking in gains before year-end.
📊 ETF Overview
iShares MSCI EAFE ETF (EFA) is the world's most liquid developed international equity ETF, providing exposure to large and mid-cap securities across Europe, Australasia, and the Far East:
- Net Assets: $67.47 billion
- Industry: Developed International Equity
- Current Price: $95.15 (near 52-week high of $95.95)
- Holdings: 696 securities across 21 developed markets
- Expense Ratio: 0.32%
- Dividend Yield: 2.75%
- Primary Business: Tracks MSCI EAFE Index covering Europe, Japan, Australia, excluding U.S. and Canada
Top Holdings:
- SAP SE (1.67%) - European enterprise software leader
- ASML Holding (1.66%) - Dutch semiconductor equipment maker
- Nestlé SA (1.37%) - Swiss consumer goods giant
- Roche & Novartis - Swiss pharmaceuticals
💰 The Option Flow Breakdown
The Tape (November 10, 2025):
| Time | Symbol | Buy/Sell | Type | Expiration | Premium | Strike | Volume | OI | Size | Spot | Option Price | Z-Score | Classification | Strategy |
|---|---|---|---|---|---|---|---|---|---|---|---|---|---|---|
| 12:48:40 | EFA | BUY | PUT | 2026-01-16 | $7.6M | $100 | 13,000 | 10,000 | 12,500 | $95.09 | $6.09 | 2.43 | HIGHLY_UNUSUAL | Complex Roll |
| 12:48:40 | EFA | SELL | CALL | 2026-01-16 | $350K | $100 | 13,000 | 16,000 | 12,500 | $95.09 | $0.28 | 10.36 | EXTREMELY_UNUSUAL | Complex Roll |
| 12:49:17 | EFA | BUY | PUT | 2026-01-16 | $4.6M | $100 | 20,000 | 10,000 | 7,500 | $95.10 | $6.09 | 4.04 | EXTREMELY_UNUSUAL | Complex Roll |
| 12:49:17 | EFA | SELL | CALL | 2026-01-16 | $210K | $100 | 20,000 | 16,000 | 7,500 | $95.10 | $0.28 | 16.04 | EXTREMELY_UNUSUAL | Complex Roll |
🤓 What This Actually Means
This is a synthetic short conversion or hedge adjustment - and it's telling us something important:
Trade Structure Breakdown:
- 💸 Total capital deployed: $12.8M ($7.6M + $4.6M in puts, minus $560k collected from calls)
- 🎯 Strike positioning: $100 strike with EFA at $95.15 = 5.1% out of the money
- ⏰ Time horizon: 67 days to January 16 expiration
- 📊 Position size: 33,000 contracts representing 3.3 million shares worth ~$314M notional
- 🏦 Institutional signature: Z-scores of 2.43, 10.36, 4.04, and 16.04 confirm this is NOT retail activity
What's really happening here: This trader is buying back existing short puts (closing a previous bullish position) while selling calls to partially offset the cost. The structure suggests they originally sold puts betting on EFA staying above $100, collected premium, and now they're unwinding that position by buying back the puts at a loss. The call sales indicate they're still willing to cap upside at $100 but want to reduce downside exposure.
Translation for regular folks: Someone bet EFA would stay strong but now wants to reduce their exposure. They're paying $12.2M net to exit their bullish bet, suggesting concern about European economic weakness or potential dollar strength reversing the 2025 rally.
Unusual Score Context:
- 🔥 Z-scores ranging from 2.43 to 16.04 = This happens approximately 1-5 times per year for EFA
- 📊 Position size represents 0.019% of entire $67.47B fund - comparable to small institutional desk allocation
- 🐋 The 16.04 Z-score on the second call sale indicates this volume is 16x standard deviations above normal - exceptional activity
📈 Technical Setup / Chart Check-Up
YTD Performance Chart
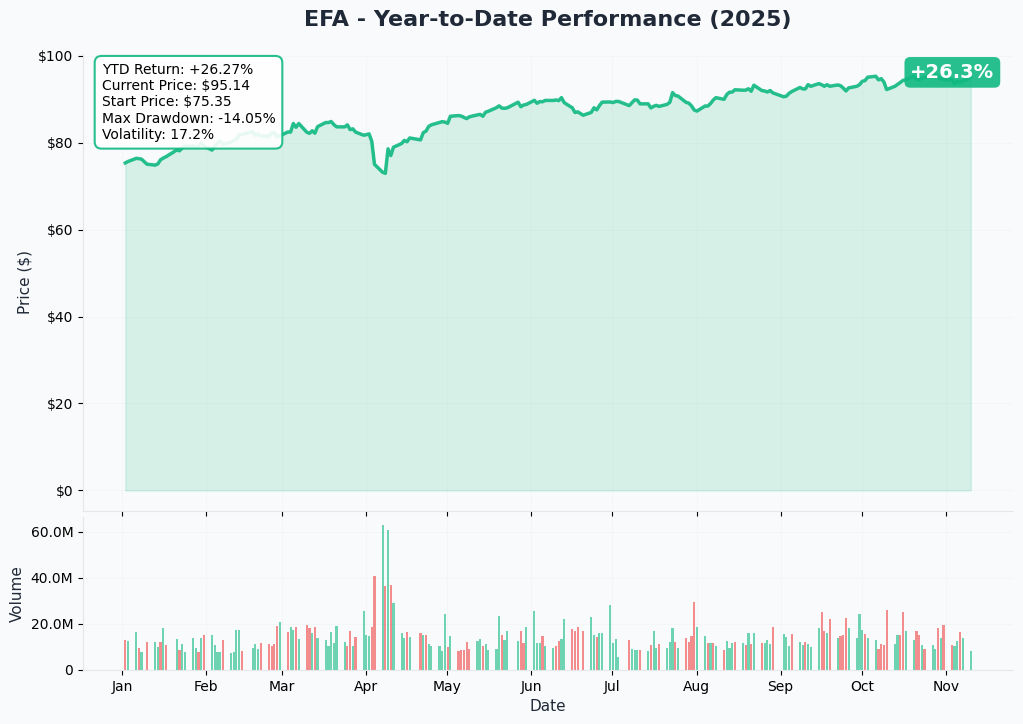
EFA is crushing it with +28.20% year-to-date performance, significantly outperforming U.S. equities. The chart tells a compelling international rotation story:
Key observations:
- 📈 Explosive 2025 rally: Consistent uptrend driven by historic dollar weakness
- 💹 Dollar correlation: 10.7% dollar decline in H1 2025 (worst in 50 years) added ~10% to returns
- 🎢 Near all-time highs: Trading at $95.15 vs 52-week high of $95.95
- 📊 Q4 2024 pullback recovered: 8.11% decline in Q4 2024 fully reversed
- 🌍 Regional divergence: Europe up 25%, far outpacing S&P 500's 3% YTD gain
Gamma-Based Support & Resistance Analysis
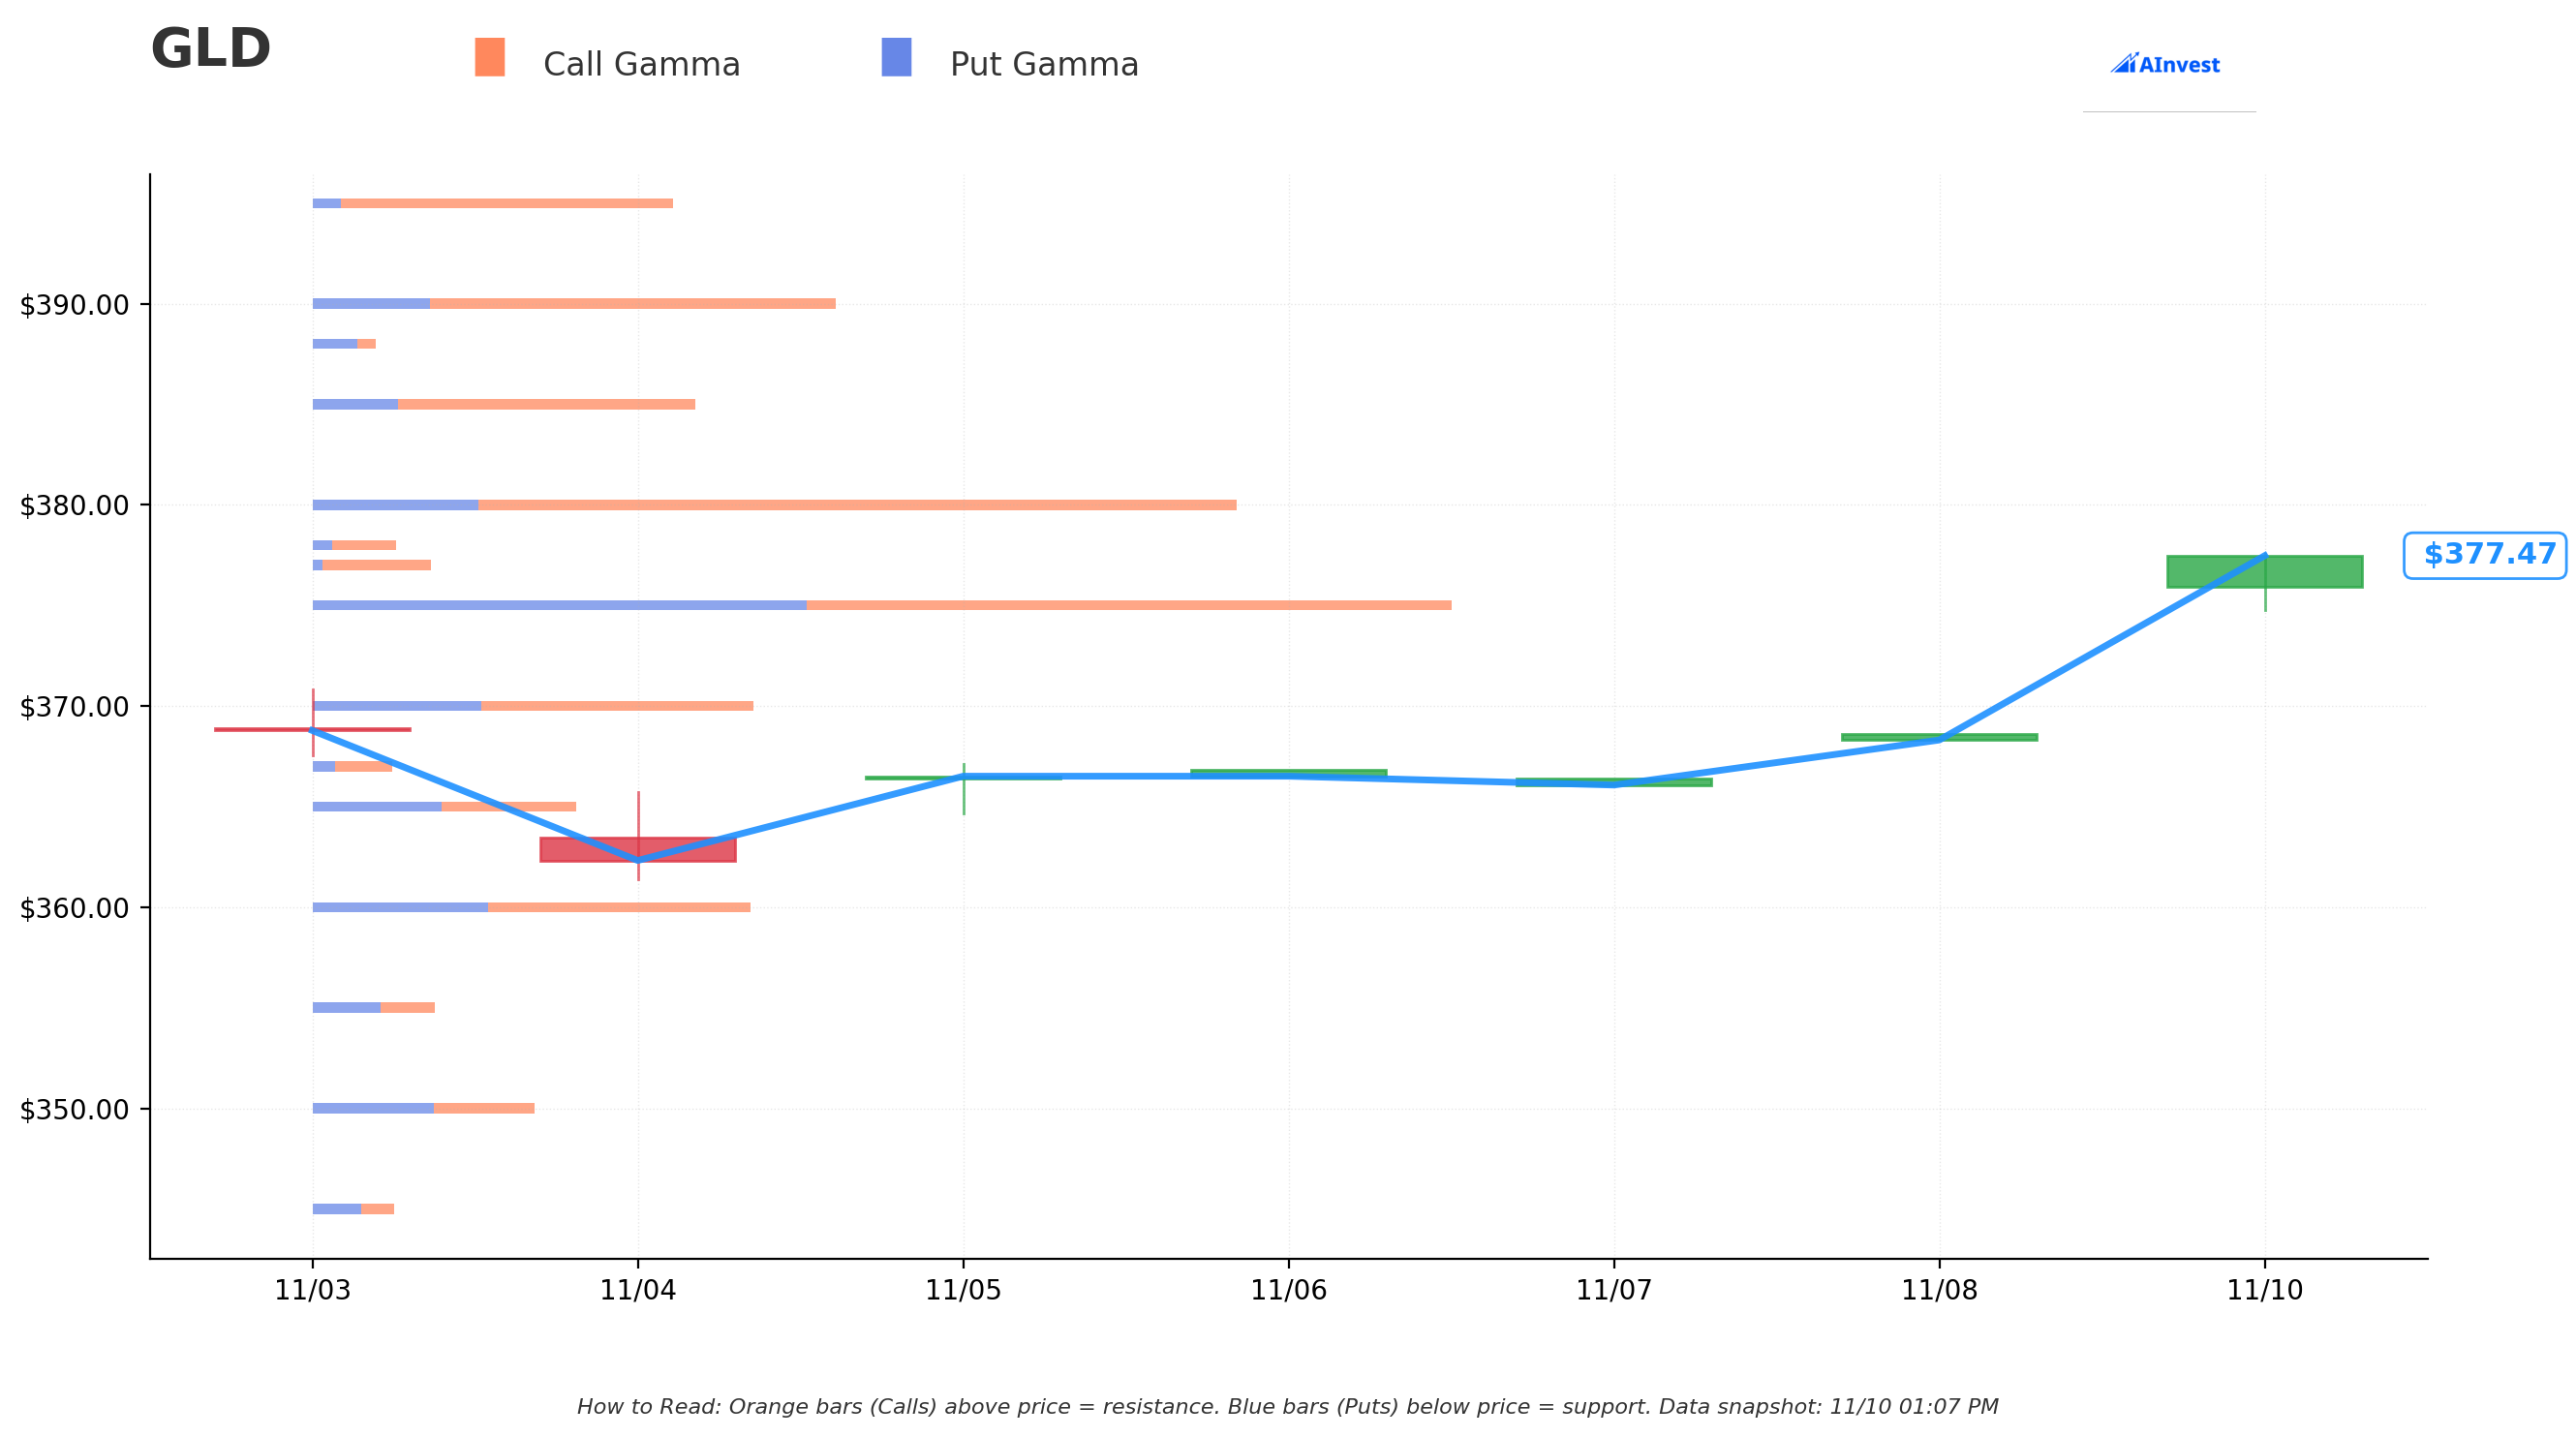
Current Price: $95.15
The gamma exposure map reveals critical price magnets heading into year-end for EFA:
🔵 Support Levels (Put Gamma Below Price):
- $95.00 - Strongest support with 205.08B total gamma exposure (just 0.16% below current price!)
- $94.00 - Secondary floor at 114.77B gamma (1.21% downside)
- $93.00 - Major support with 97.11B gamma (2.26% below)
- $92.00-$90.00 - Deep support zone providing safety net
🟠 Resistance Levels (Call Gamma Above Price):
- $96.00 - Immediate resistance with 81.99B gamma (0.89% above price)
- $97.00 - Secondary ceiling at 55.22B gamma (1.94% upside)
- $98.00 - Major resistance zone with 100.50B gamma (2.99% above)
What this means for traders: The gamma data shows EFA trading right in the sweet spot between massive support at $95 (205B gamma) and resistance at $96 (82B gamma). This creates a natural trading range into year-end. Market makers will buy dips aggressively at $95 and sell rallies near $96, creating a relatively stable environment.
Net GEX Bias: Bullish (517.06B call gamma vs 466.73B put gamma) - Overall positioning remains constructive despite recent hedge adjustments.
Implied Move Analysis
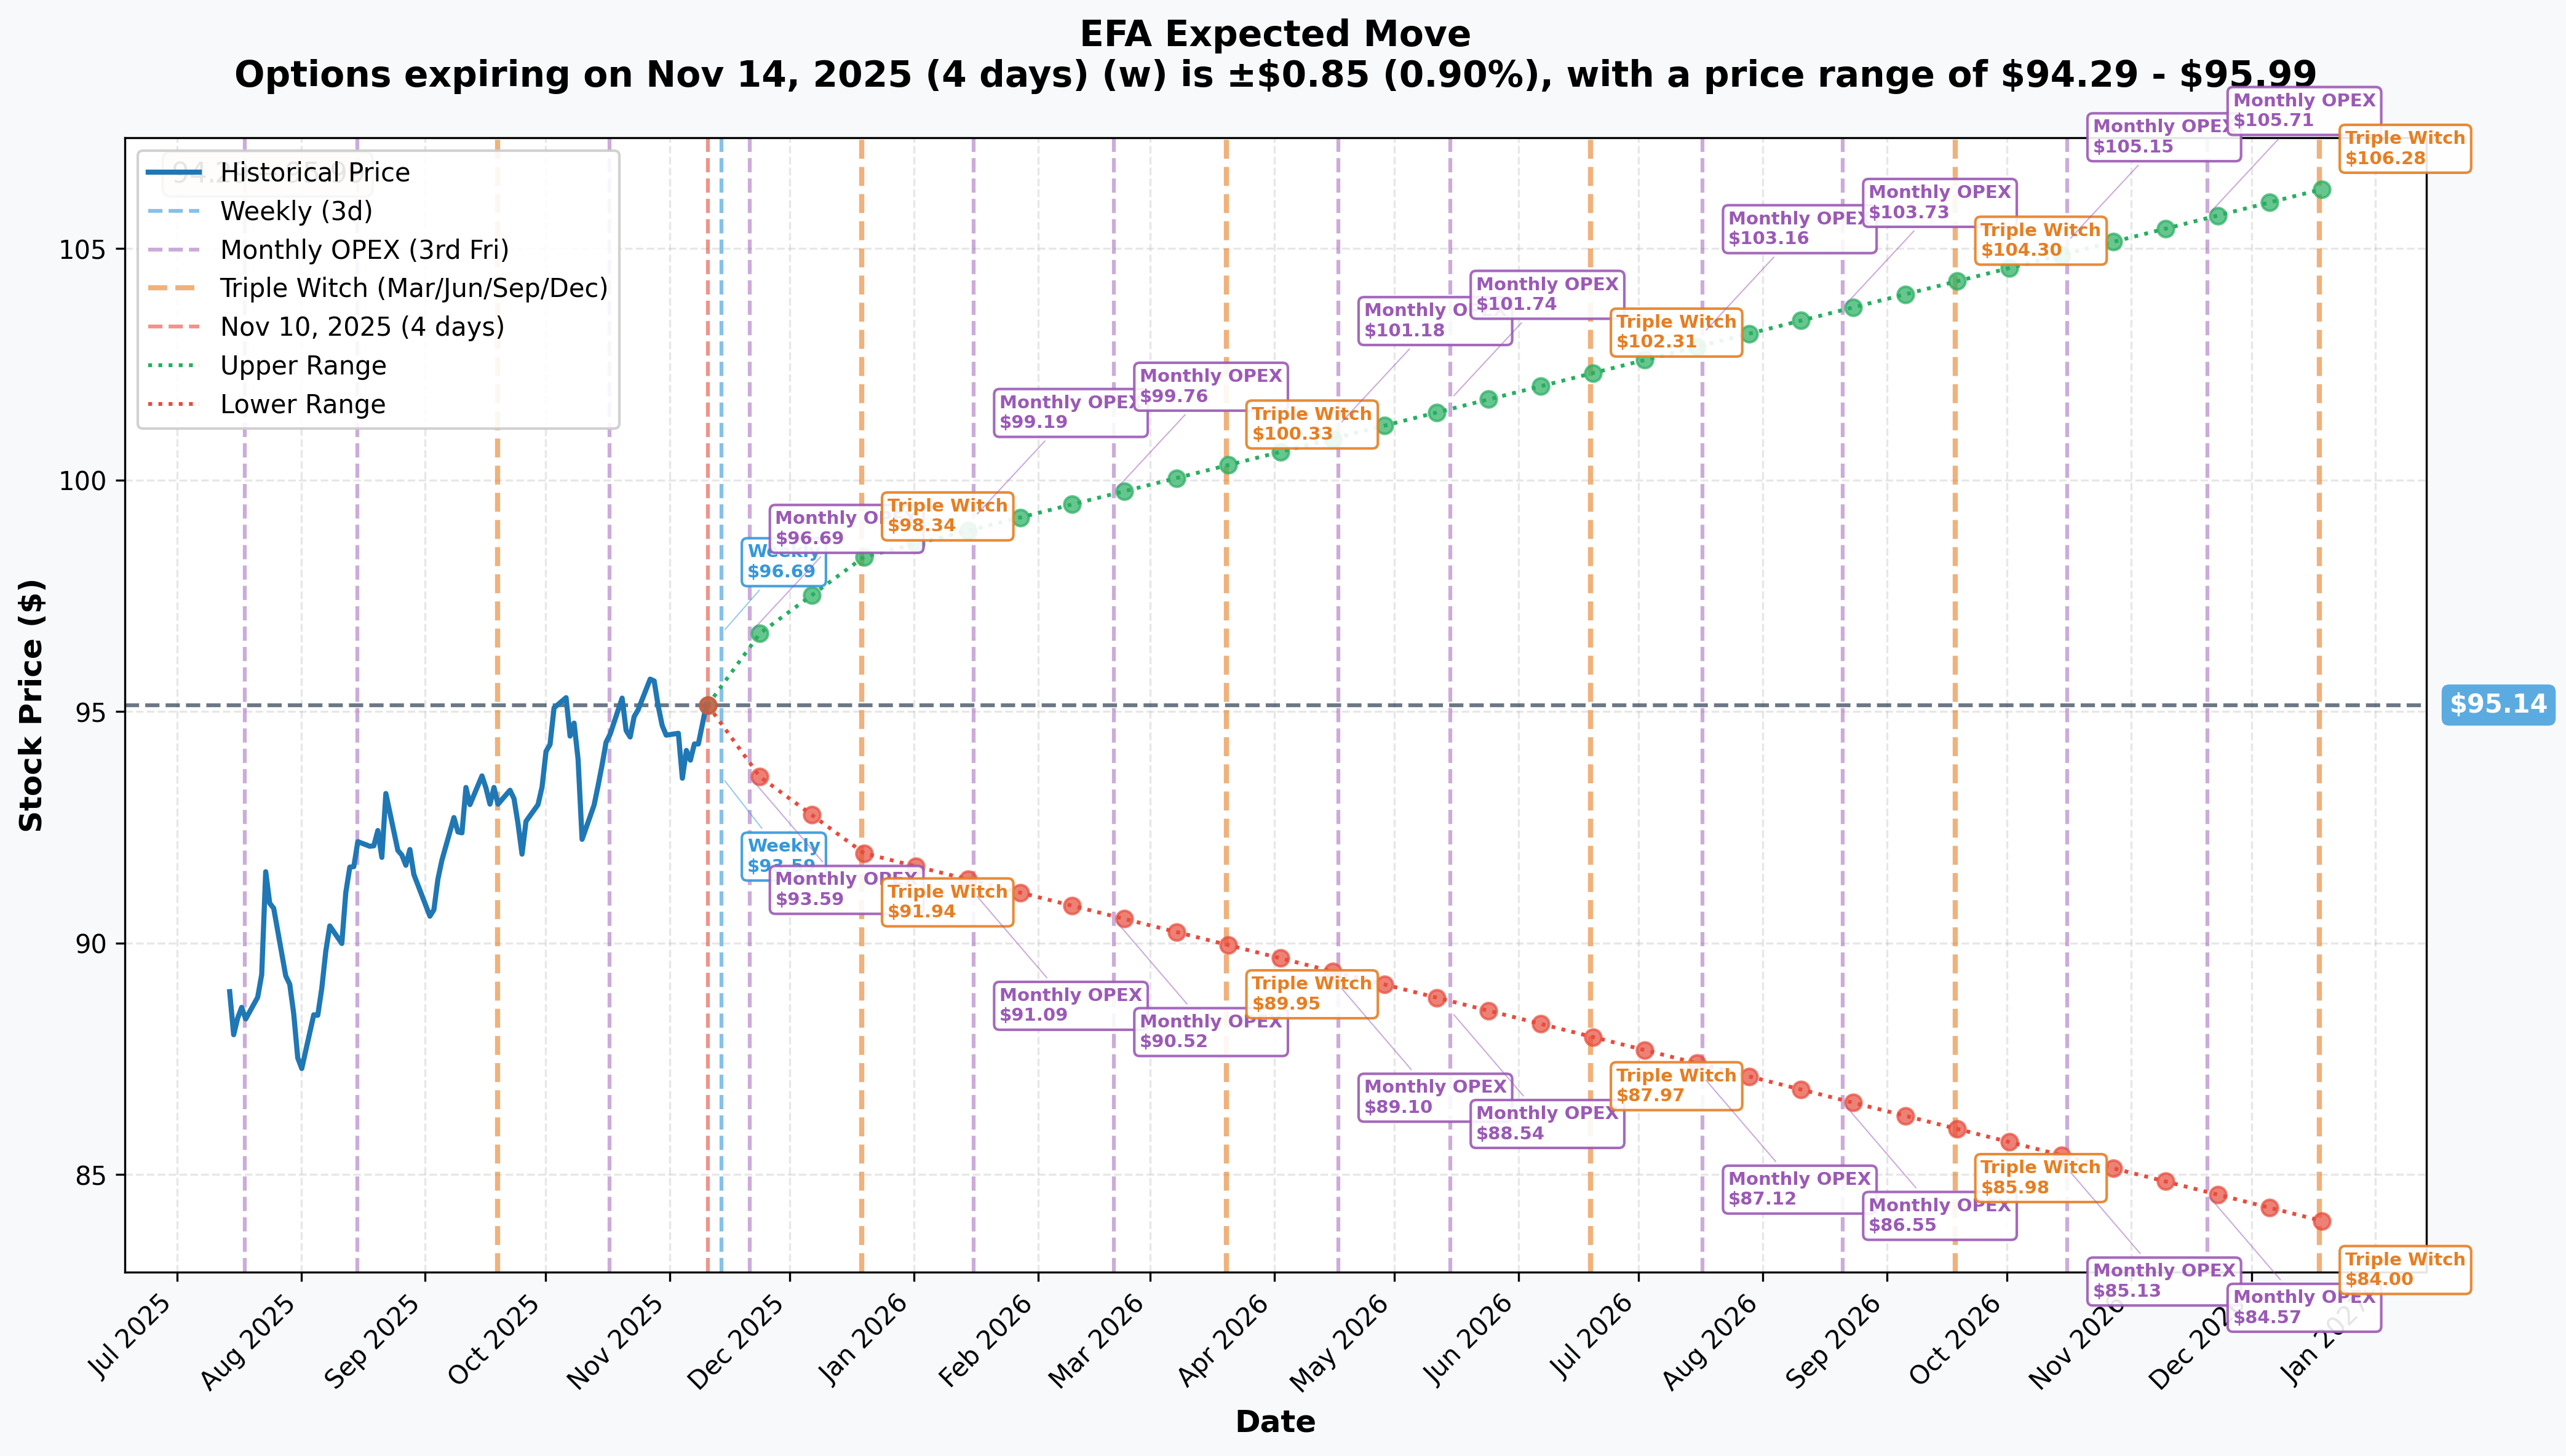
Options market pricing for upcoming expirations:
- 📅 Weekly (Nov 14 - 4 days): ±$0.85 (±0.9%) → Range: $94.29 - $95.99
- 📅 Monthly OPEX (Nov 21 - 11 days): ±$1.42 (±1.49%) → Range: $93.72 - $96.56
- 📅 Quarterly Triple Witch (Dec 19 - 39 days): ±$3.20 (±3.36%) → Range: $91.94 - $98.34
- 📅 Trade Expiration (Jan 16 - 67 days): ±$4.05 (±4.26%) → Range: $91.09 - $99.19
Translation for regular folks: Options traders are pricing in modest volatility for an international equity ETF. The 0.9% weekly move expectation suggests a quiet near-term environment, while the January expiration (when these trades expire) prices in a 4.26% move - meaning the market sees decent chance EFA trades between $91-$99 over the next two months.
The $100 strike on these trades sits above the upper implied range ($99.19), suggesting the trader believes there's low probability of EFA rallying above $100 by expiration. This aligns with their call sales capping upside.
🎪 Catalysts
🔥 Immediate Catalysts (Already Happened)
Dollar Weakness Driving 2025 Rally 💵
The most powerful catalyst for EFA's 28% YTD performance has been historic U.S. dollar weakness:
- 📉 DXY fell 10.7% in H1 2025 - worst first-half in over 50 years
- 💰 Approximately 10% of EFA's 28% return attributed to currency effects
- 🌍 MSCI EAFE returned 18.1% in local currency but 28.1% for U.S. investors after conversion
- ⚖️ Key risk: Any dollar reversal could eliminate this tailwind
European Central Bank Rate Cuts 🇪🇺
ECB lowered rates by 25bps to 3.00% on December 12, 2024, with staff projections showing:
- 📊 Inflation averaging 2.4% in 2024, 2.1% in 2025, 1.9% in 2026
- 📈 Growth expected at 0.7% in 2024, 1.1% in 2025, 1.4% in 2026
- 💼 Additional cuts already priced into market expectations
Q4 2024 Market Volatility ⚠️
MSCI EAFE Index fell 8.11% in Q4 2024, with all eleven sectors posting negative returns:
- 🇪🇺 MSCI Europe down 9.7%, with France falling 10.3%
- 🇯🇵 MSCI Japan down 3.6% (relative outperformer)
- 🏗️ Materials, Health Care, Real Estate led losses
- ✅ Recovery: This selloff has been fully reversed in 2025
🚀 Near-Term Catalysts (Next 90 Days)
Semi-Annual Dividend Distribution (December 2025) 💰
- Expected Ex-Date: Mid-December 2025 (six months after June 16, 2025 ex-date)
- Recent Distribution: $1.519 per share (paid June 20, 2025)
- Annual Dividend: Approximately $2.58 per share
- Current Yield: 2.72%
- Impact: Provides income support and reflects stable developed market corporate health
European Central Bank Continued Easing (Q1 2025) 🇪🇺
Bank of America expects ECB to cut rates at every meeting until reaching 1.5% by September 2025:
Next Meeting Dates:
- January 30, 2025
- March 13, 2025
- April 17, 2025
Market Impact: Further rate cuts should support European equity valuations and economic activity, though weak GDP growth (1.1% expected for 2025) limits upside potential.
MSCI Index Rebalancing (February 2025) 📊
MSCI announced the February 2025 Index Review for February 11, 2025:
- 🔄 EFA must adjust holdings to match benchmark changes
- 💰 With $67.47B in assets and 2% turnover rate, rebalancing creates concentrated trading
- 📈 Can drive flows and volatility around announcement date
- 🎯 Typically occurs 2-3 weeks before effective date
Bank of Japan Policy Normalization (Q1 2025) 🇯🇵
Bank of Japan held rates at 0.5% in October 2025, with further hikes anticipated:
- 📈 Core CPI expected to grow 2.4% in FY25, up 0.5% from October forecast
- ⏰ Majority of economists expect 25bp hike by year-end, likely October or January 2026
- 💴 Yen depreciation beyond 150/USD could accelerate normalization timeline
- ⚠️ Risk: Aggressive tightening could pressure Japanese equities (significant EFA component)
Trump Tariff Implementation (Q1 2025) 🇺🇸
Current tariff environment affecting EFA holdings:
- 🇪🇺 15% baseline tariff on European Union goods, with EU committing $750B in U.S. energy purchases
- 🇯🇵 15% tariff on Japanese goods including automobiles
- 📊 J.P. Morgan estimates reduced tariffs could lift Japanese earnings by 3 percentage points
- 💹 Following tariff announcement, investors pulled $8.9B from U.S. equities while sending $7.8B to foreign stocks
📊 Major Holdings Earnings Catalysts (Next 6 Months)
ASML Holding (1.66% of EFA) 🔬
Dutch semiconductor equipment giant delivering strong results:
- 💰 Q2 2025: €7.7B net sales, 53.7% gross margin, €2.3B net income
- 📈 Full-year 2025 guidance: €30-35B revenue (~15% growth), 51-53% gross margin
- 🤖 Riding AI chip demand tailwind
- ⚠️ Risk: Tariff uncertainties and China export restrictions
SAP SE (1.67% of EFA) 💻
German enterprise software leader showing cloud momentum:
- ☁️ Q3 2025: Cloud revenue surged 27% YoY - fifth consecutive quarter of 25%+ growth
- 💵 Cloud revenue targeting €21.6-21.9B (trending toward lower end)
- 📊 Operating profit expected at upper end of €10.3-10.6B range
- 💰 Free cash flow targeting €8.0-8.2B (2024: €4.22B)
Nestlé SA (1.37% of EFA) 🍫
Swiss consumer goods giant navigating macro challenges:
- 📈 Organic growth improved from 2.9% in H1 to 4.3% in Q3 2025
- 🎯 Full-year guidance: Growth expected to improve vs 2024's 2.2%
- 📉 UTOP margin expected at/above 16.0%, down from 17.2% (growth investments)
- ☕ Coffee and confectionery leading organic growth
🌍 Regional Economic Catalysts (2025-2026)
Germany Economic Stagnation 🇩🇪
Goldman Sachs expects Germany's GDP to contract 0.3% in 2025:
- 📉 Government forecasts cut to just 0.3% growth (down from 1.1%)
- ⏰ Longest period of economic inactivity in seven decades
- 🏭 Industrial sector weakness persisting
- 🚨 Major headwind: Germany is Europe's largest economy and significant EFA weight
France Fiscal Challenges 🇫🇷
European Commission projects France real GDP growth of 0.6% in 2025:
- 💸 Government debt ratio estimated to increase to 116.0% in 2025, 118.4% in 2026
- ⚖️ Policy uncertainty and contractionary fiscal stance weighing on growth
- 🚨 Goldman Sachs expects economy to shrink 0.7% (more pessimistic than consensus)
Japan Market Performance 🇯🇵
Sumitomo Mitsui DS Asset Management expects Nikkei 225 to reach 45,400 by end 2025:
- 📈 Real GDP growth estimates raised from +0.3% to +0.6% for FY2025
- 💰 Massive 17 trillion yen in share buybacks in FY2024 supporting market
- 💴 Currency headwind: If yen appreciates, Nikkei could underperform by ~4% through 2025
🔄 Competitive Dynamics
Emerging Markets Outperformance 🌏
Emerging markets providing competition for investor capital:
- 📊 MSCI EM rose 12.7% in Q2 2025 vs MSCI World's 11.5%
- 📈 Emerging market earnings growth expected to accelerate to 17% in 2025, up from 10% in 2024
- 💵 U.S. equities trading at 21x forward earnings vs 12x for EM - widest valuation gap in 20 years
- 🔗 Correlation between EM and DM fell below 0.45 - second-lowest in 25 years, suggesting diversification benefits
🎲 Price Targets & Probabilities
Using gamma levels, implied move data, catalyst analysis, and trade positioning, here are the scenarios for EFA through January 16, 2026 expiration:
📈 Bull Case (25% probability)
Target: $98-$100
How we get there:
- 💪 Dollar weakness continues as U.S. exceptionalism fades, adding another 5-7% currency tailwind
- 🇪🇺 ECB cuts to 1.5% by Q3 2025 boost European equity valuations significantly
- 🇯🇵 Japan Nikkei 225 reaches 45,400 target, lifting Asia Pacific component
- 🔬 ASML delivers on €30-35B revenue guidance with strong AI chip demand
- 💻 SAP cloud revenue acceleration continues 27%+ growth trajectory
- 📊 $98 gamma resistance overcome by sustained international rotation flows
Key challenges:
- Must break through major $98 resistance (100.5B gamma)
- Requires Germany to avoid contraction and France to stabilize
- Analyst consensus price target of $103.26 suggests upside possible but requires multiple catalysts for EFA
🎯 Base Case (50% probability)
Target: $93-$97 range
Most likely scenario:
- 📊 Trading within strong gamma support ($95) and resistance ($96-$97) bands
- 💵 Dollar stabilizes rather than strengthening significantly
- 🇪🇺 ECB rate cuts proceed as expected but weak GDP growth (1.1%) limits upside
- 🇯🇵 BOJ policy normalization gradual, no surprises
- 💰 December dividend distribution ($1.52) provides support
- 🔄 MSCI rebalancing in February creates temporary volatility but no lasting impact
- 📈 Modest gains into year-end driven by seasonal patterns and yield support
This explains the trade: The $100 strike calls expire worthless, trader keeps premium collected while their put buying protects against downside. They're essentially betting EFA stays range-bound below $100 through expiration.
📉 Bear Case (25% probability)
Target: $90-$93
What could go wrong:
- 💪 Dollar strength resumes as Fed policy diverges from global easing, reversing 10.7% H1 decline
- 🇩🇪 Germany's 0.3% contraction deepens into broader European recession
- 🇫🇷 France's 118.4% debt ratio by 2026 triggers EU fiscal enforcement
- 🇯🇵 BOJ accelerates rate hikes, pressuring Japanese equities
- 🚨 Trump tariff escalation beyond current 15% rates
- 🌏 Emerging markets continue outperforming, attracting capital away from developed markets
- 📉 Repeat of Q4 2024's 8.11% decline on macro fears
- 🛡️ Key support: Strong put gamma at $93-$95 (205B+ total gamma) should limit downside unless fundamentals deteriorate significantly
Trade protection: The put buying component of this trade provides downside protection - if EFA falls toward $90, the puts gain value offsetting losses. This suggests trader is hedging against exact this scenario.
💡 Trading Ideas
🛡️ Conservative: Wait for Clarity Strategy
Play: Stay on sidelines until dollar and European growth trends clarify
Why this works:
- 🎢 Major uncertainty around dollar trajectory - entire 2025 rally dependent on currency
- 📉 Germany contracting 0.3% and France struggling with 116%+ debt - weak fundamentals
- 🐋 Sophisticated money is reducing exposure (buying back puts) rather than adding - follow the smart money
- 💰 Better entry likely after clarity on Q4/Q1 economic data
- 📊 Trading at 52-week highs ($95.15 vs $95.95) with limited margin of safety
Action plan:
- 👀 Monitor dollar index (DXY) closely - weakness = bullish for EFA
- 📈 Watch Q4 European GDP releases (Germany, France) in January/February
- 🇪🇺 Track ECB January 30 and March 13 meetings for guidance tone
- 🎯 Look for pullback to $93-$94 gamma support for entry
- ✅ Confirm ASML and SAP earnings momentum continues
Risk level: Minimal (cash position) | Skill level: Beginner-friendly
⚖️ Balanced: Covered Call for Income
Play: Buy EFA shares or add to existing position, sell monthly calls for income
Structure: Buy 100 shares of EFA at ~$95, Sell $97 calls (December 19 expiration)
Why this works:
- 💰 Collect option premium ($0.50-0.75 estimated) + 2.75% dividend yield = total income ~5-6% annualized
- 🎯 Gamma resistance at $97 makes strike logical - price likely caps there
- 📅 December 19 expiration captures dividend payment (expected mid-December)
- 📊 Base case scenario (range-bound $93-$97) generates maximum profit
- 🛡️ Strong support at $95 limits downside risk for underlying shares
- 🇪🇺 ECB cuts and yield support provide safety net
Estimated P&L (per 100 shares):
- 💰 Collect ~$50-75 in call premium
- 💵 Receive ~$76 dividend (expected mid-December)
- 📈 Max profit if EFA at/above $97: ~$200 from share appreciation + $126 income = $326 total (3.4%)
- 📉 Downside protection: $126 income offsets losses down to $93.74 breakeven
- 🎯 Annualized return if repeated: 10-12% in sideways/up market
Management:
- If assigned at $97, total return = 3.4% in 39 days (excellent)
- If not assigned, roll to January expiration and repeat
- Set mental stop at $93 (gamma support) to protect capital
Risk level: Low-Moderate (defined risk, income-focused) | Skill level: Intermediate
🚀 Aggressive: Short Put Spread (Bullish, Limited Risk)
Play: Sell bull put spread betting on gamma support holding
Structure: Sell $94 puts, Buy $92 puts (January 16, 2026 expiration - same as unusual trades)
Why this could work:
- 🎯 Massive gamma support at $94-$95 (205B+ total gamma) - dealers will aggressively buy dips
- 💵 Betting dollar weakness continues providing tailwind
- 📊 Defined risk spread ($2 wide = $200 max risk per spread)
- 💰 Collect
$0.40-0.50 credit per spread ($40-50 premium) - ⏰ 67 days to expiration aligns with unusual trade timeframe
- 🇪🇺 ECB cuts in January and March should support European equities
- 📈 Analyst price target of $103.26 suggests downside limited
Why this could go wrong:
- 💪 Dollar strength resumes unexpectedly, eliminating 10% currency tailwind
- 🇩🇪 Germany recession deepens, dragging down European component
- 🇯🇵 BOJ aggressive policy surprises pressure Japan equities
- 🚨 Repeat of Q4 2024's 8.11% decline on macro shocks
- 📉 Break below $94 support accelerates to $92-$93 zone quickly
- ⚠️ Max loss: $150-160 per spread if EFA drops below $92 (1.75% decline from current)
Estimated P&L:
- 💰 Collect ~$40-50 credit per spread
- 📈 Max profit: Keep full premium if EFA above $94 at January 16 (52% probability based on implied move)
- 📉 Max loss: $150-160 if EFA below $92 at expiration
- 🎯 Breakeven: ~$93.50-93.60
- 💵 Return on risk: 25-33% if successful
Entry strategy:
- Wait for any spike in volatility to sell at better prices
- Consider selling only 1-2 spreads per $10k portfolio (position sizing critical)
- Set alert if EFA breaks below $94 to consider closing early
Risk level: Moderate-High (defined but significant risk) | Skill level: Advanced
⚠️ WARNING: Only attempt if you:
- Understand EFA's currency exposure dynamics
- Can monitor position through MSCI rebalancing on February 11
- Accept max $150+ loss per spread if thesis wrong
- Have sufficient margin for short puts (broker may require $1,000+ per spread)
⚠️ Risk Factors
Don't get caught by these potential landmines:
-
💵 Dollar reversal risk - THE BIG ONE: Entire 2025 rally built on 10.7% dollar weakness in H1, contributing ~10% of EFA's 28% return. Any Fed policy shift or U.S. economic strength that reverses dollar trends would eliminate this massive tailwind for EFA. DXY rally of 5-10% could wipe out most 2025 gains instantly.
-
🇩🇪 European economic stagnation deepening: Germany expecting 0.3% contraction with longest inactivity period in 70 years. As Europe's largest economy and significant EFA weight, German recession would drag down entire fund. Industrial weakness showing no signs of reversal.
-
🇫🇷 France fiscal crisis: Debt spiraling to 118.4% of GDP by 2026 could trigger EU fiscal enforcement and austerity measures. Policy uncertainty already weighing on projected 0.6% growth. Any ratings downgrade or bond market pressure could spill over to broader European equities.
-
🇯🇵 Bank of Japan policy error risk: BOJ walking tightrope between normalizing from 0.5% rates and managing economic uncertainties. Yen already weak beyond 150/USD - aggressive rate hikes to defend currency could pressure Japanese stocks (significant EFA component). Conversely, continued delay risks inflation spiraling.
-
🚨 Trump tariff escalation: Current 15% baseline tariffs on EU and Japan already creating headwinds. Any escalation beyond current levels would materially impact major EFA holdings like ASML, SAP, and auto manufacturers. Trade war escalation risk remains elevated heading into 2026.
-
🌏 Emerging markets stealing thunder: EM equities up 12.7% in Q2 with 17% earnings growth expected in 2025 vs developed markets. Capital rotating from developed international to EM could pressure EFA flows. Valuation gap of 21x vs 12x forward earnings makes EM increasingly attractive.
-
🐋 Smart money reducing exposure: These $12.8M trades show sophisticated player buying back puts (closing bullish position) rather than adding exposure. When institutions derisk at 52-week highs after 28% rally, it signals caution about further upside. Z-scores of 2.43-16.04 indicate extremely unusual position reduction activity.
-
📉 Q4 2024 repeat risk: MSCI EAFE fell 8.11% in Q4 2024 with all eleven sectors negative. Pattern could repeat if macro uncertainties resurface or year-end profit-taking intensifies. Materials, Healthcare, Real Estate particularly vulnerable.
-
🔄 MSCI rebalancing volatility: February 11, 2025 index review can create outsized short-term volatility. With $67.47B in assets and low 2% turnover, rebalancing trades concentrated and potentially disruptive to technical levels.
-
💰 Valuation stretched on currency gains: Analyst consensus $103.26 target implies 8.7% upside, but most 2025 gains currency-driven rather than fundamental improvement. MSCI EAFE returned 18.1% in local currency vs 28.1% for U.S. investors - suggests underlying earnings growth modest.
-
🏭 Sector concentration risk: Top holdings (ASML 1.66%, SAP 1.67%, Nestlé 1.37%) face company-specific challenges. ASML exposed to AI chip cycle volatility and China restrictions. SAP facing cloud revenue trending toward lower guidance range. Nestlé margin compression to 16% from 17.2%.
🎯 The Bottom Line
Real talk: Someone just paid $12.8 million net to reduce their bullish EFA exposure at 52-week highs after a historic 28% rally. They're buying back put shorts (acknowledging they don't want unlimited downside) while selling calls to cap upside at $100. This isn't panic - it's sophisticated risk management by a player who's made good money and wants to lock in gains.
What this trade tells us:
- 🎯 Institutional view: EFA stays below $100 through mid-January (high conviction given call sales)
- 📉 Risk management priority: Willing to pay $12.2M net to reduce downside exposure - that's serious derisking
- ⚖️ Not bearish, just cautious: Still willing to cap upside for premium income, suggesting base case is range-bound
- 💰 Classic late-cycle behavior: Taking chips off table after big run, positioning defensively into year-end
If you own EFA:
- ✅ Consider trimming 20-30% at these levels (up 28% YTD, near 52-week highs, fundamentals weak)
- 📊 Strong gamma support at $95 (205B) and $94 (115B) provides some cushion for remaining position
- ⏰ Hold through December dividend payment (~$1.52) for income
- 🎯 If dollar weakness continues and ECB cuts accelerate to 1.5%, $98-$100 realistic
- 🛡️ Set mental stop at $93 (major gamma support) to protect gains
If you're watching from sidelines:
- ⏰ Wait for clarity on dollar direction - this is 35% of the trade (10% of 28% return)
- 🎯 Pullback to $93-$94 gamma support would be attractive entry (2-3% off current levels)
- 📈 Looking for confirmation German/French economic data stabilizes in Q1 2025
- 🇪🇺 ECB meetings January 30 and March 13 critical for guidance
- 🚀 Long-term (6-12 months), analyst consensus $103.26 suggests value if entry improves
If you're bearish:
- 🎯 Current position reasonable: Smart money reducing exposure is validating signal
- 📊 First meaningful support at $95 (205B gamma), major support at $93-$94
- ⚠️ Watch for dollar strength catalysts - DXY rally of 5%+ would pressure EFA significantly
- 📉 Put spreads ($95/$93 or $94/$92) offer defined risk way to play downside
- 💵 Consider shorting via put spreads rather than naked puts given 2.75% dividend yield cost
Mark your calendar - Key dates:
- 📅 Mid-December 2025 - Semi-annual dividend distribution (~$1.52/share)
- 📅 December 19, 2025 - Quarterly triple witch options expiration
- 📅 January 16, 2026 - Expiration date for this $12.8M unusual trade
- 📅 January 30, 2025 - ECB rate decision
- 📅 February 11, 2025 - MSCI Index Review announcement
- 📅 March 13, 2025 - ECB rate decision
- 📅 Q1 2025 - European GDP releases (Germany, France critical)
Final verdict: This is a textbook "take profits and derisk" signal from institutional money. At 52-week highs with fundamentals showing German contraction, French fiscal crisis, and 2025 rally 35% currency-driven, smart money is reducing exposure. That doesn't mean EFA crashes - it means risk/reward no longer favors aggressive bullish positioning. Be patient, wait for dollar trend confirmation, and look for better entry points. The structural case for international diversification remains, but timing and valuation matter.
Disclaimer: Options trading involves substantial risk of loss and is not suitable for all investors. This analysis is for educational purposes only and not financial advice. Past performance doesn't guarantee future results. The Z-scores (2.43-16.04) reflect these specific trades' sizes relative to recent history - they do not imply the trades will be profitable or that you should follow them. Currency exposure in EFA creates additional volatility and risk. ETF values fluctuate with underlying holdings and currency exchange rates. Always do your own research and consider consulting a licensed financial advisor before trading.
About iShares MSCI EAFE ETF: EFA is the world's most liquid developed international equity ETF with $67.47 billion in net assets, tracking the MSCI EAFE Index across 696 securities in 21 developed markets including Europe, Japan, Australia, and other international markets excluding the U.S. and Canada.