🎯 FISV: $28M Bearish Bet Signals Major Institutional Move!
📅 December 11, 2025 | 🔥 Unusual Activity Detected
🎯 The Quick Take
Someone just dropped $28 million in a bearish combo on Fiserv (FISV) heading into January 2026 expiration! This isn't your typical retail trade - we're looking at 87,000 put contracts bought and 46,000 call contracts sold in a coordinated strike. With FISV already down 67.5% year-to-date following the catastrophic Q3 earnings disaster, big money is betting the pain isn't over yet.
💼 Company Overview
Fiserv, Inc. (NASDAQ: FISV) - Financial Services Technology Giant
- Market Cap: $35.8 billion
- Sector: Business Services (Financial Technology)
- Employees: 38,000
- Current Price: $68.22 (as of December 11, 2025)
What They Do: Fiserv provides core processing and complementary services like electronic funds transfer, payment processing, and loan processing for US banks and credit unions, with a focus on small and midsize banks. Following their 2019 merger with First Data, they expanded into merchant payment solutions through their Clover platform. About 10% of revenue comes from international operations.
Recent Performance:
- 52-Week Range: $59.56 - $238.59
- YTD Performance: -67.5%
- 3-Month Performance: -47% (post-October 29 crash)
- Forward P/E: 7.2x (trading at multi-year lows)
💰 The Option Flow Breakdown
📊 What Just Happened
Here's the massive institutional trade that hit the tape on December 11, 2025:
| Time | Symbol | Type | Expiration | Strike | Volume | Premium | Size | Spot Price | Order Type | Z-Score |
|---|---|---|---|---|---|---|---|---|---|---|
| 11:37:09 | FISV | BUY PUT | 2026-01-16 | $65 | 87,000 | $16.0M | 87,000 | $68.22 | BTO | 976.24 |
| 11:37:09 | FISV | SELL CALL | 2026-01-16 | $70 | 46,000 | $12.0M | 46,000 | $68.22 | STO | 106.61 |
Total Premium: $28 million Net Position: Short Combo / Synthetic Short
🤓 What This Actually Means
This is a short combo (also called a synthetic short stock position) - one of the most aggressively bearish strategies in the options playbook. Here's what's happening:
The Put Side (87,000 contracts @ $65 strike):
- Buying puts = betting FISV drops below $65 by January 16, 2026
- $16M in premium paid upfront
- Breakeven needs stock to fall below $63.16 (accounting for $1.84 per share premium)
- Z-Score of 976.24 - this is approximately 976 times the normal trading volume for this strike!
The Call Side (46,000 contracts @ $70 strike):
- Selling calls = obligated to sell shares at $70 if stock rallies
- Collected $12M in premium
- Creates additional bearish pressure by capping upside
- Z-Score of 106.61 - roughly 106 times normal activity
Translation for Regular Folks: This trader paid a net $4 million ($16M - $12M) to construct a position that profits if FISV drops below $65. The sold calls finance part of the put purchase while also limiting potential upside participation - meaning they're 100% confident this stock isn't going up.
Why This Matters:
- Volume/OI ratios of 37.8x (puts) and 6.6x (calls) signal these are NEW positions opening, not old ones closing
- Combined Z-scores this extreme happen maybe a few times a year in any given stock
- The timing - just weeks before Q4 2025 earnings (February 10, 2026) - suggests institutional knowledge or conviction
- At current market cap, this represents meaningful downside exposure
📈 Technical Setup
📊 YTD Chart Analysis
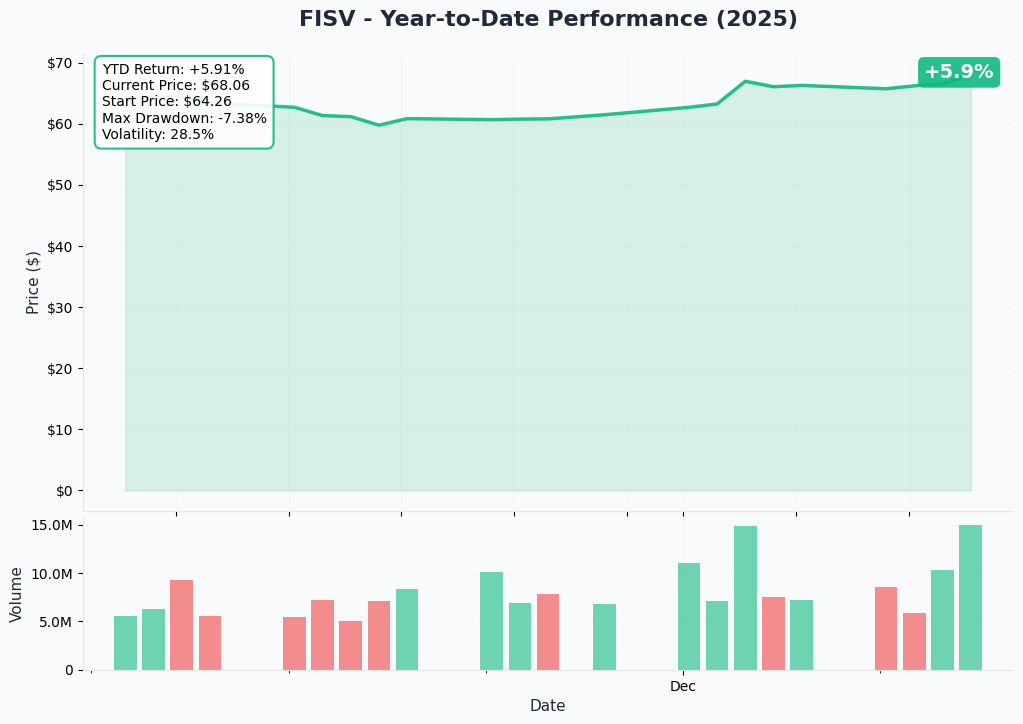
The Chart Tells a Brutal Story:
FISV started 2025 around $210 and has been on a relentless downtrend, culminating in the October 29 earnings catastrophe where shares crashed 47% in a single day. The stock now trades around $68 - down over two-thirds from its 52-week high of $238.59.
Key Technical Observations:
- Trend: Severe downtrend with no meaningful support holding
- Recent Action: Stock has been consolidating in the $60-70 range post-crash
- Volume: Elevated volume on down days suggests continued selling pressure
- Momentum: Multiple analyst downgrades have kept the stock under pressure, with J.P. Morgan's December 4 downgrade to Hold citing "worst year for payment stocks in 15 years"
🎯 Gamma-Based Support & Resistance Analysis
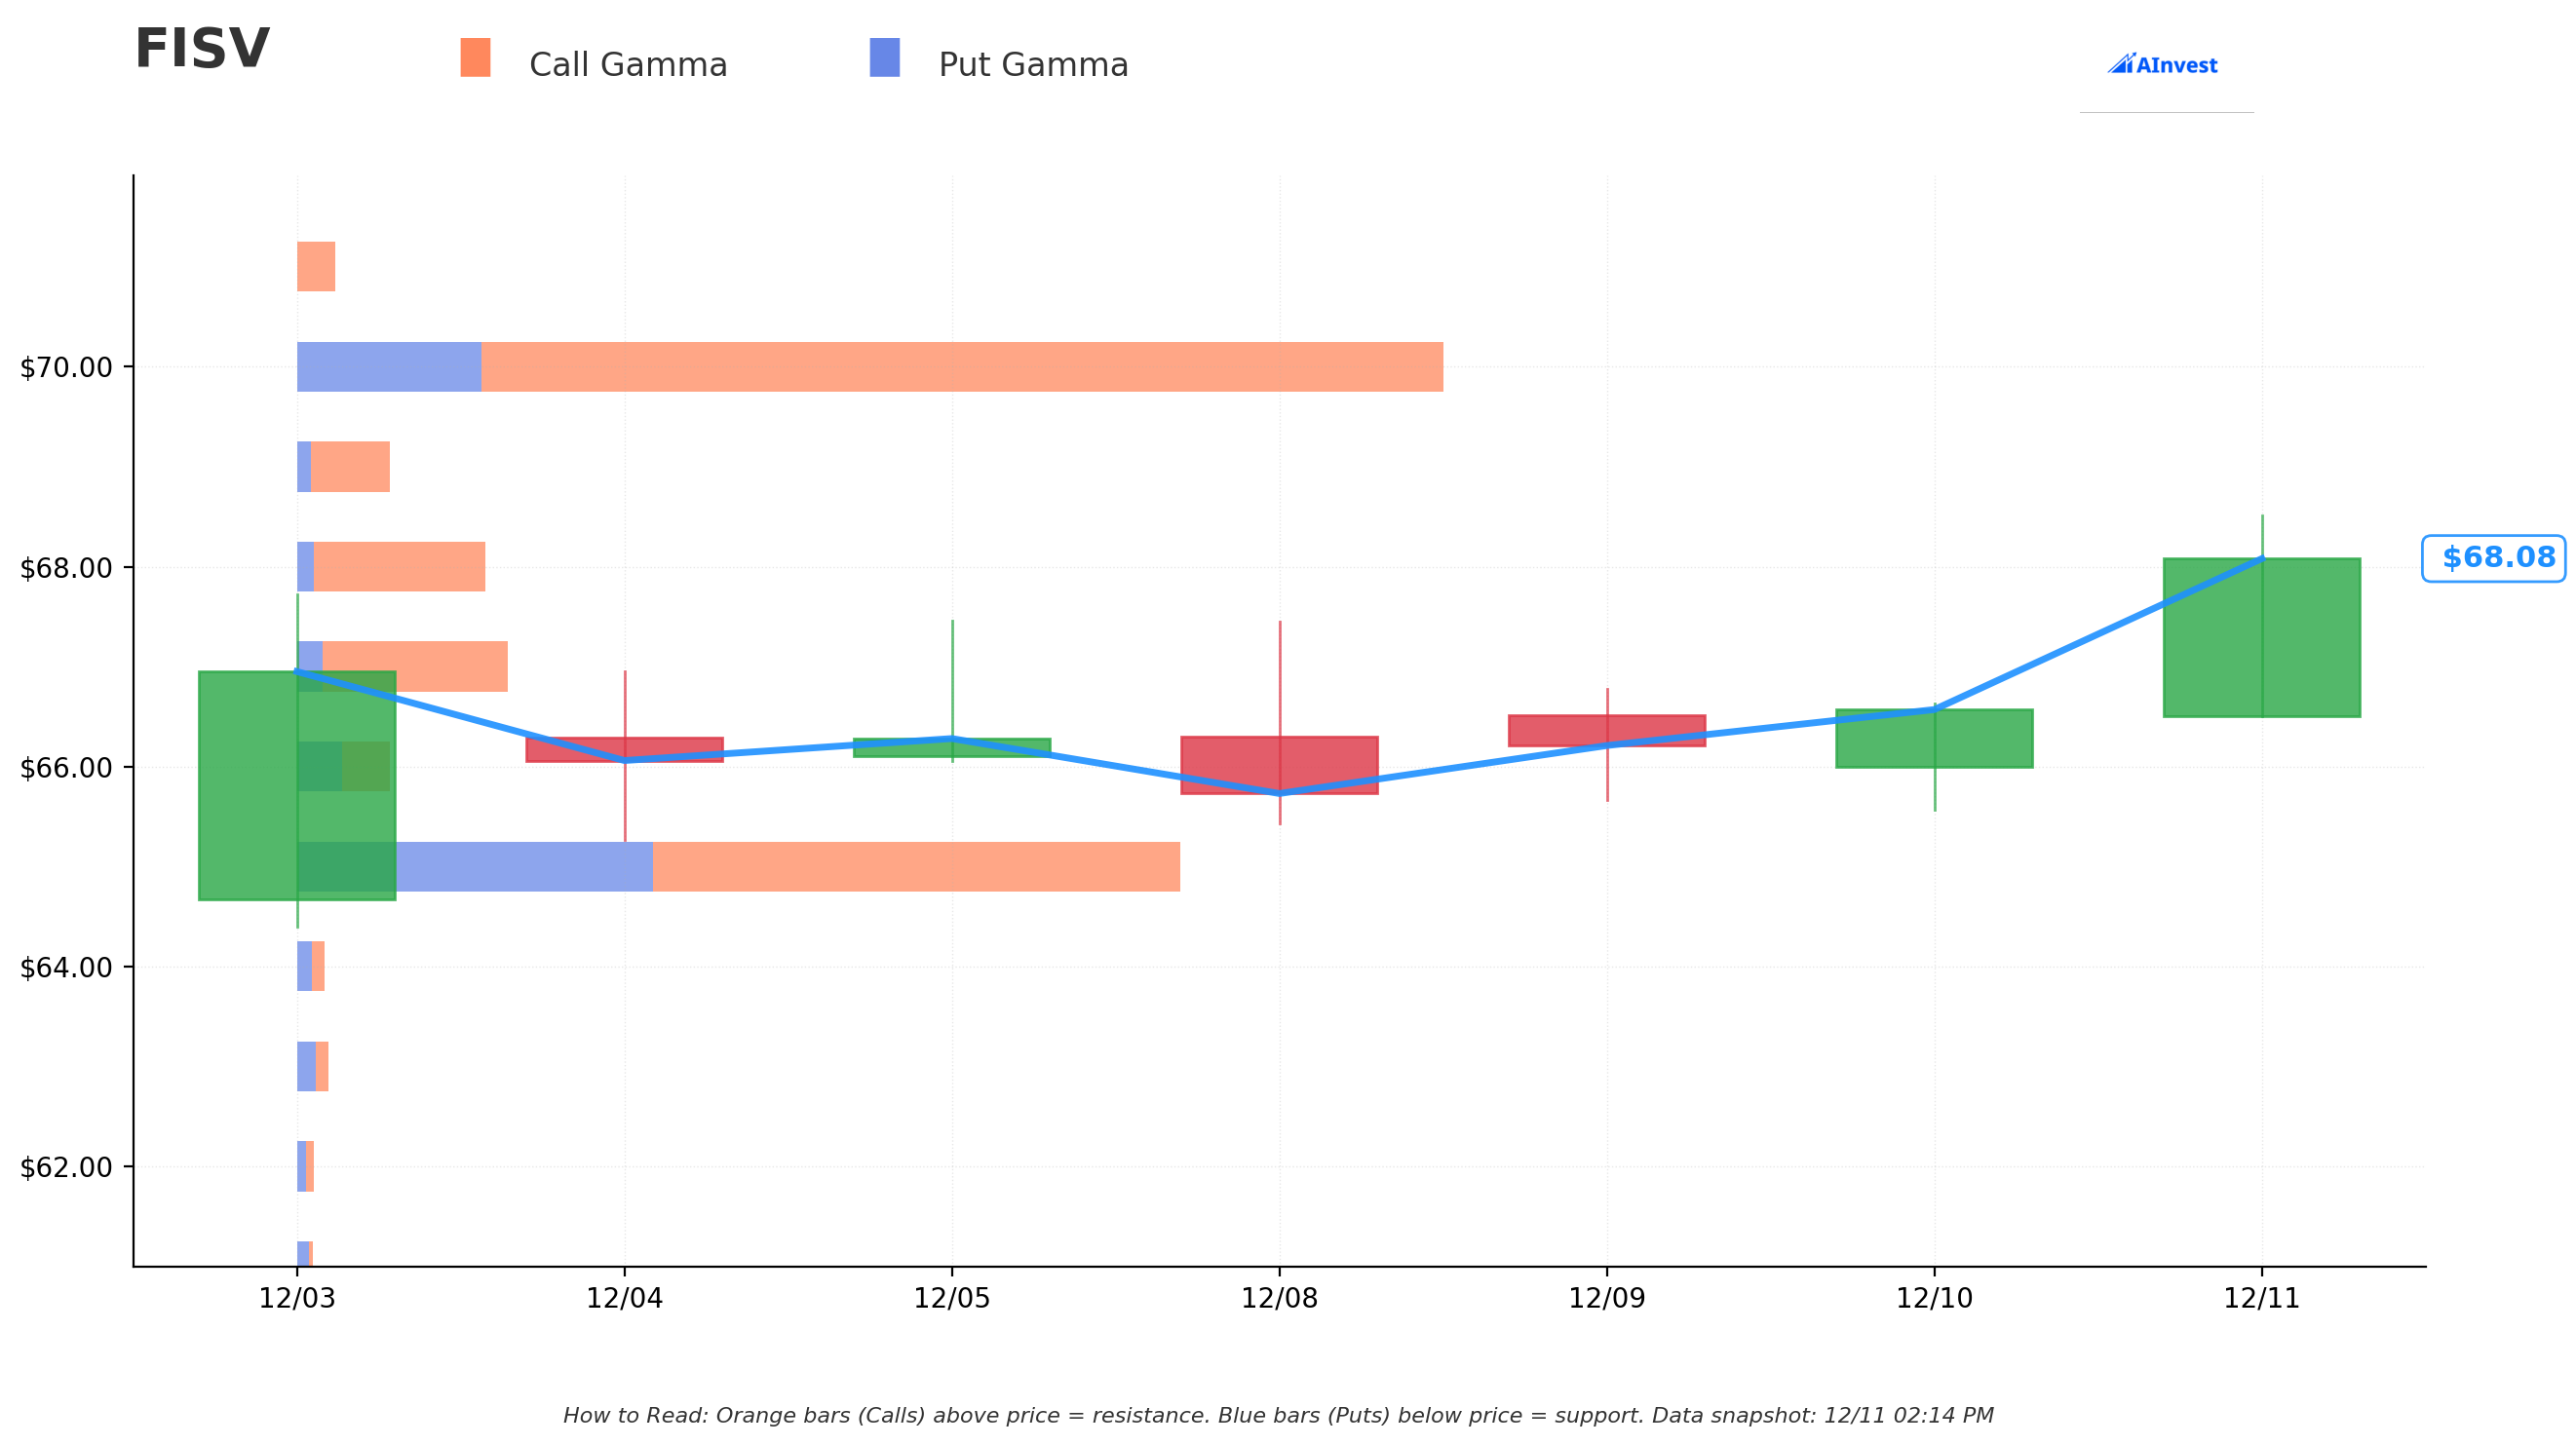
What the Gamma Map Shows:
Based on options positioning, here are the key levels where heavy gamma concentration creates natural support/resistance:
🔵 Support Levels (Put Gamma - Blue Bars):
- $68 (Strongest Support): Massive put gamma at 1.78 - this is where we are now! Stock is sitting right on major support
- $67: Secondary support with 2.04 total GEX
- $65: The strike from today's massive put purchase (3.54 put GEX) - this is the line in the sand
- $60: Deep support at 2.85 total GEX - if $65 breaks, this could be next stop
🟠 Resistance Levels (Call Gamma - Orange Bars):
- $69 (Nearest Resistance): Moderate resistance at 0.89 total GEX - just 1.4% above current price
- $70 (Strongest Resistance): HUGE wall here with 11.13 total GEX - this is where today's calls were sold! Market makers will fight to keep price below this level
- $75: Secondary resistance at 3.59 total GEX - would represent 10% rally
- $80: Major resistance zone at 2.65 total GEX
Net GEX Bias: Currently Bullish with total call GEX of 31.77 vs put GEX of 13.27, but today's massive put purchase could shift this dynamic dramatically.
What This Means for Trading: The $70 strike is now a fortress - with 9.32 in call gamma from today's trade alone, market makers will be selling into any rallies toward this level. Meanwhile, $68 support is being tested in real-time. A break below here opens the door to the $65 zone where today's put buyers are positioned.
📏 Implied Move Analysis
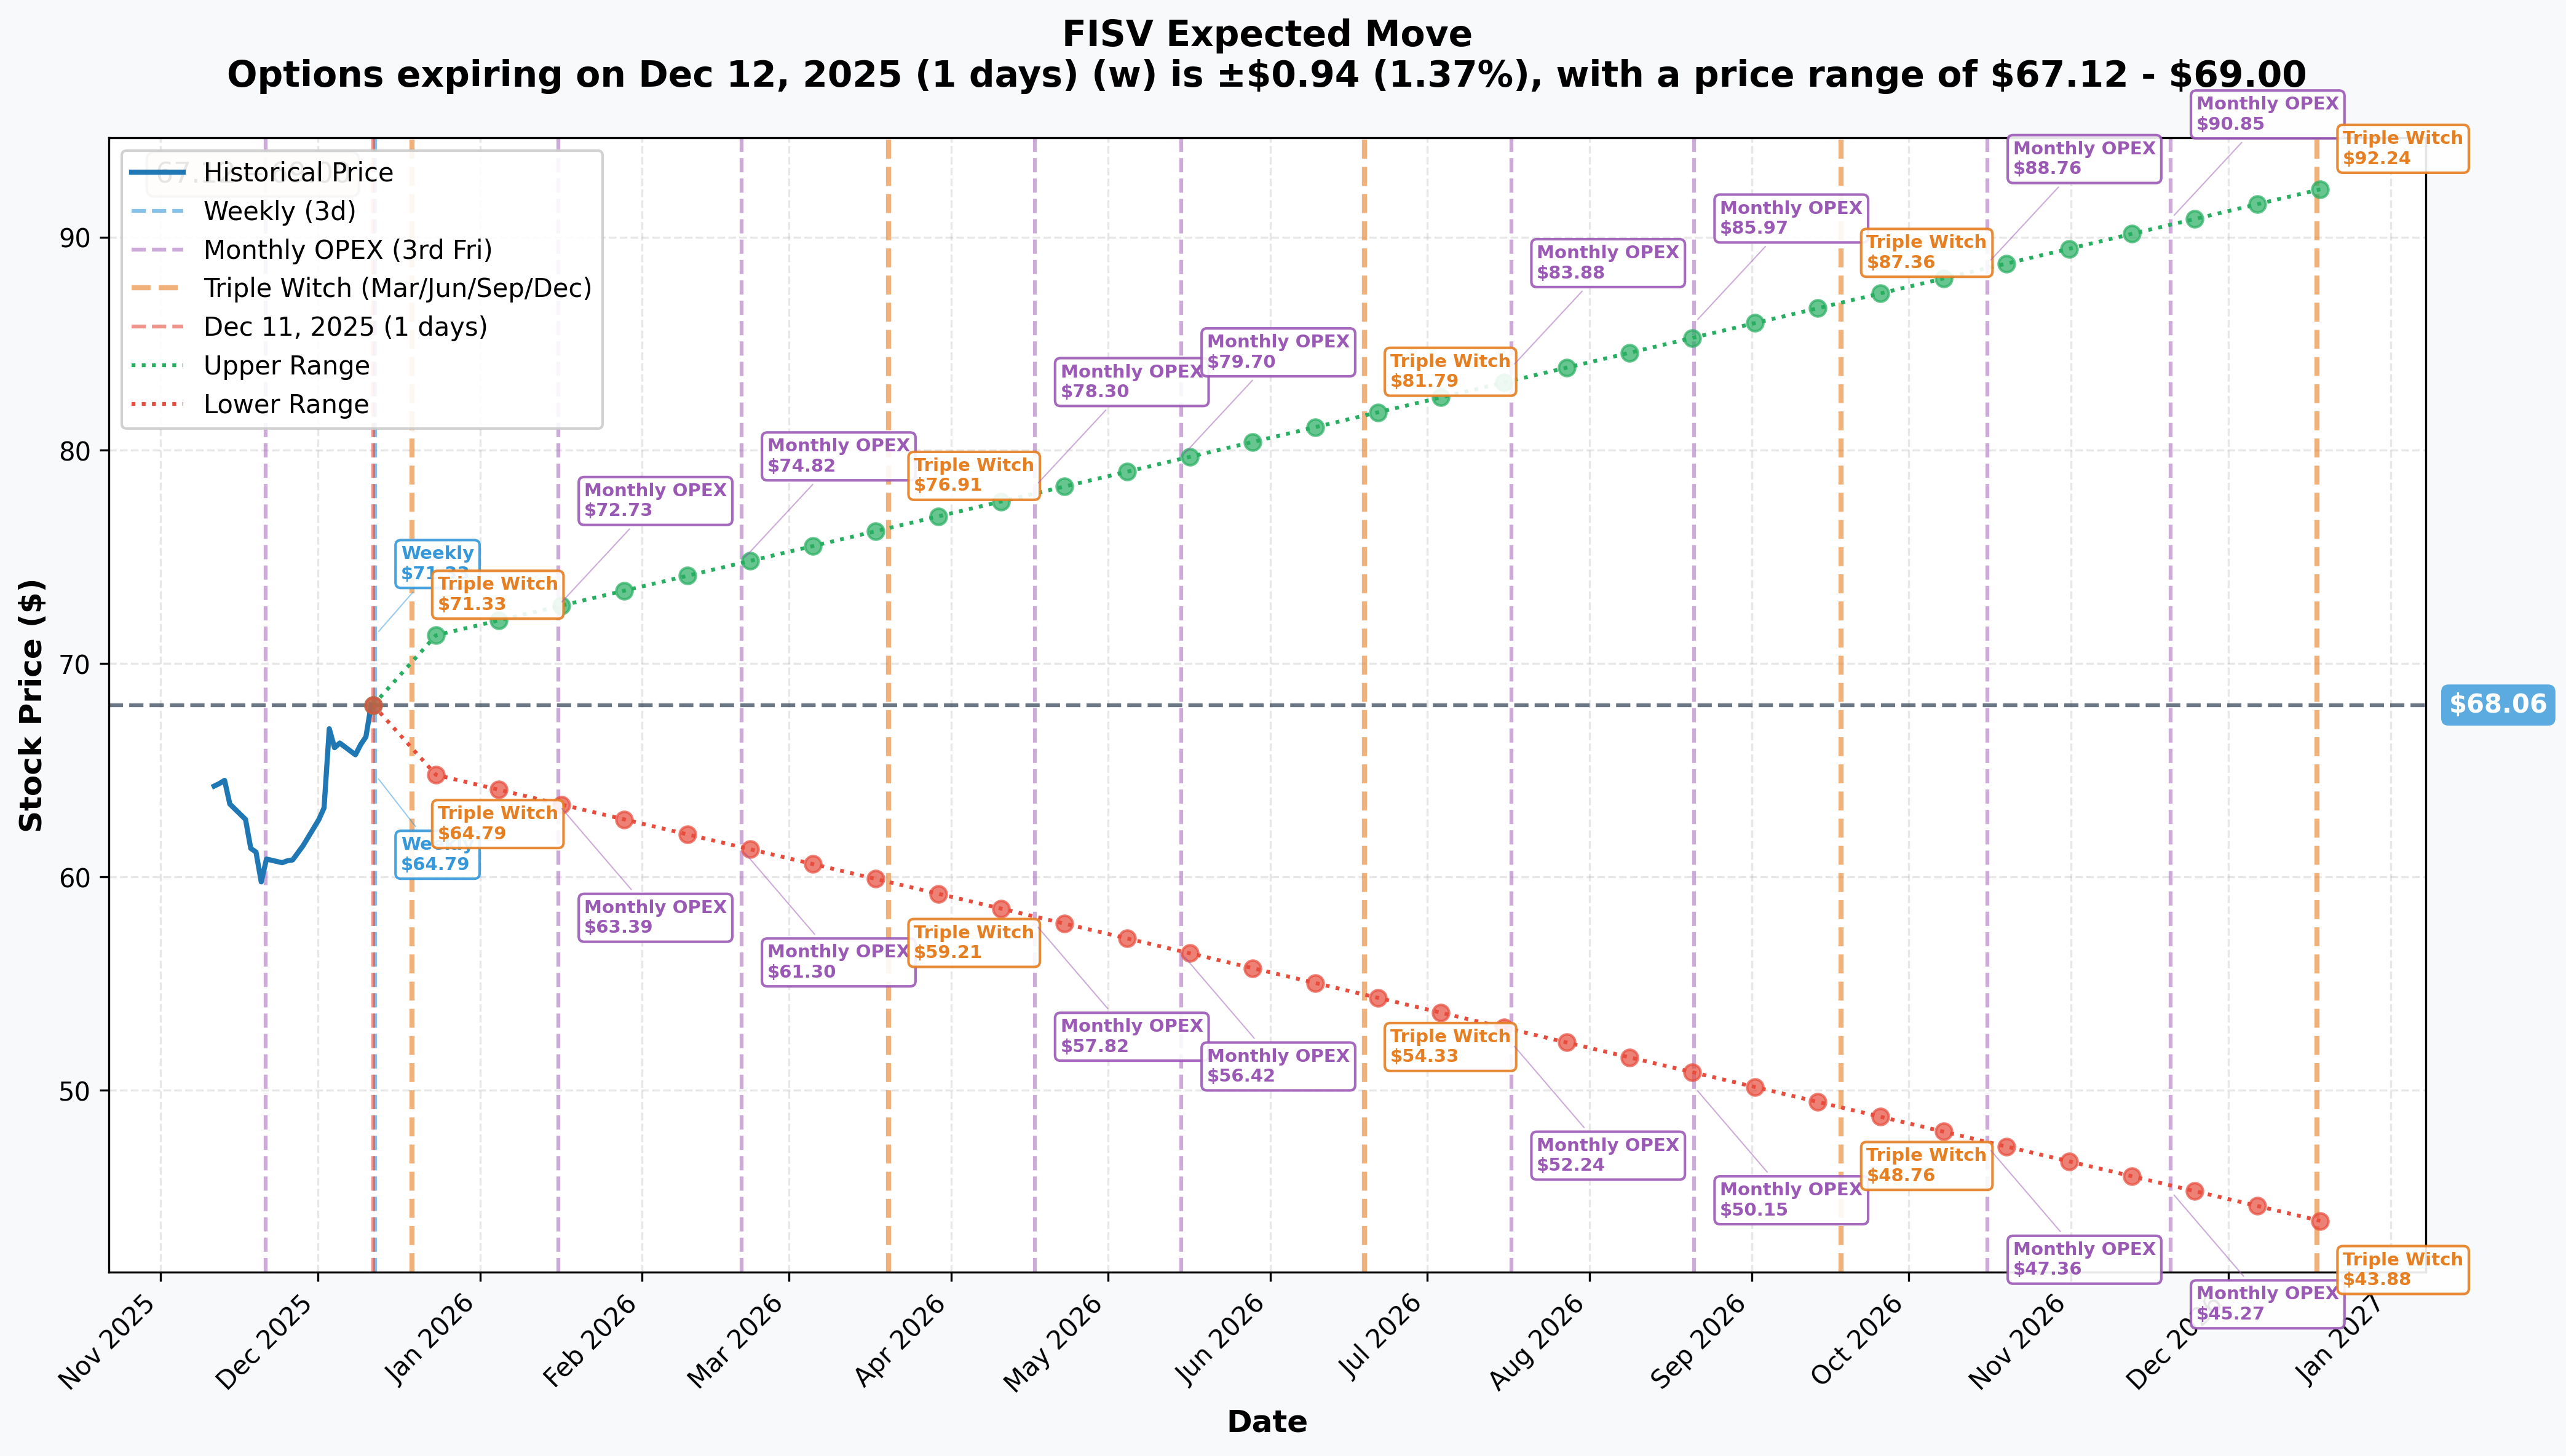
Options Market Expectations:
The options market is pricing in significant volatility ahead. Here's what implied volatility tells us:
Weekly Expiration (December 12, 2025 - Tomorrow!):
- Implied Move: ±1.37% ($0.94)
- Expected Range: $67.12 - $69.00
- Reliability: High (very near-term expiration)
Monthly OPEX (December 19, 2025):
- Implied Move: ±4.46% ($3.04)
- Expected Range: $65.02 - $71.10
- Reliability: High
- Key Insight: Notice the $65 lower bound - exactly where today's massive put purchase is struck!
January 2026 OPEX (January 16, 2026 - Today's Trade Expiration):
- Implied Move: ±6.87% ($4.67 estimated)
- Expected Range: ~$63.39 - $72.73
- Critical Level: The $65 put strike sits near the bottom of this range, suggesting it's pricing in a meaningful probability of downside
Yearly LEAPS (December 18, 2026):
- Implied Move: ±35.53% ($24.18)
- Expected Range: $43.88 - $92.24
- Interpretation: Massive uncertainty about long-term trajectory given turnaround execution risks
What This Tells Us: The options market sees a 4.5% move by December 19 and potentially 7%+ by January 16. With the stock at $68 and the $65 put strike representing a -4.4% move, this trade is betting on a move to the lower end of the expected range - but not an extreme outlier. That suggests calculated bearishness rather than panic.
🎪 Catalysts
🔮 Upcoming Catalysts (What Could Move the Stock)
Q4 2025 Earnings - February 10, 2026 (After Market Close)
- Confirmed Date: MarketBeat earnings calendar
- Consensus EPS Estimate: $1.92
- Company Guidance: $8.50-$8.60 adjusted EPS for full year 2025
- What to Watch:
- Actual organic revenue growth vs. 3.5-4% revised guidance
- Clover platform GPV growth trends (previously collapsed from 14-17% to 8%)
- 2026 formal guidance (preliminary: low single-digit revenue growth, modest EPS decline)
- "One Fiserv" transformation plan progress updates
- Customer retention metrics and merchant churn data
Class Action Lead Plaintiff Deadline - January 5, 2026
- Multiple securities fraud lawsuits filed following October 29 earnings disaster
- Court selection of lead plaintiff could trigger new disclosures
- Allegations: Company misled investors about Clover's growth sustainability
- Class period: July 23, 2025 - October 29, 2025
Congressional Investigation (Ongoing)
- Senate Democrats investigating former CEO Frank Bisignano's role in setting "objectively difficult-to-achieve" guidance
- Potential public hearings or document releases
- Focus on whether Bisignano misled investors while planning SSA Commissioner exit
📰 Past Catalysts (Already Happened - Context Matters)
Q3 2025 Earnings Catastrophe - October 29, 2025
- Stock crashed 47% in single day, wiping out $32 billion in market cap
- Organic revenue growth slashed to 3.5-4% from 10-12% guidance
- 2025 adjusted EPS cut to $8.50-$8.60 (representing YoY decline)
- Admitted prior guidance contained assumptions that were "objectively difficult to achieve"
- Triggered wave of lawsuits and Congressional scrutiny
Leadership Transition - May 6, 2025
- Frank Bisignano resigned as CEO to become Social Security Administration Commissioner
- Michael P. Lyons promoted to CEO (lacks track record in chief executive role)
- CFO departure announced following Q3 results
Analyst Downgrade Wave - November-December 2025
- J.P. Morgan downgraded to Hold on December 4: "worst year for payment stocks in 15 years"
- Multiple firms slashed price targets by 55%: Morgan Stanley to $81, Goldman Sachs to $81, UBS to $75
- 67% of 35 analysts now rate Hold or Sell vs. previous Buy consensus
- Average price target: $95.05 (43% upside from current levels, but down massively from prior targets)
Stock Exchange Change - November 11, 2025
- Returned to NASDAQ from NYSE
- Ticker reverted from FI to FISV
🎲 Price Targets & Probabilities
Using the gamma levels, implied move data, and catalyst landscape, here are the realistic scenarios:
🐻 Bear Case: $58-62 (15-20% downside)
Probability: 35%
Path to Get There:
- Q4 earnings (Feb 10) disappoint with revenue/guidance miss
- Clover platform shows continued deceleration
- Legal settlements or adverse findings drain cash
- Congressional investigation reveals damaging internal communications
- 2026 guidance comes in worse than "preliminary" low single-digit growth
Key Levels:
- Break below $65 gamma support triggers cascade
- $60 put gamma wall becomes next target
- Implied move pricing allows for $63.39 by January expiration
Catalyst Support:
- Analyst consensus already skeptical with 67% Hold/Sell ratings
- Track record destroyed by "objectively difficult to achieve" guidance admission
- Clover platform losing market share to Square (25%) and Toast (21.5%) with only 5.77% share
- New CEO Mike Lyons lacks chief executive track record
Options Positioning: Today's $28M bearish bet aligns with this scenario
⚖️ Base Case: $65-72 (Sideways Grind)
Probability: 45%
Path to Get There:
- Stock remains range-bound between gamma support ($65-68) and resistance ($70-72)
- Q4 earnings meet lowered expectations but don't inspire confidence
- 2026 guidance confirms "low single-digit growth" as expected
- Legal issues settle within expected ranges
- Market waits for concrete "One Fiserv" transformation progress
Key Levels:
- $68 current support holds near-term
- $70 call gamma wall caps rallies (today's 46,000 sold calls add to this)
- December 19 implied range: $65.02-$71.10 - stock stays within this band
Catalyst Support:
- Valuation at 7.2x forward P/E is historically cheap, limits pure downside
- Some hedge funds initiated positions in Q3 before crash, suggesting smart money sees value
- Payment processing market growing 11.7% CAGR - secular tailwinds remain
- 3,500 bank relationships provide distribution moat and switching costs
Options Positioning: Gamma concentration at $65-$70 creates natural range boundaries
🚀 Bull Case: $80-95 (17-39% upside)
Probability: 20%
Path to Get There:
- Q4 earnings stabilize with positive surprise on revenue
- Clover shows sequential improvement in GPV growth
- "One Fiserv" transformation shows early wins
- 2026 guidance includes credible path to mid-single-digit growth by 2027
- Legal settlements come in below feared levels
- Short covering rally as bears capitulate
Key Levels:
- Break above $70 resistance triggers gamma squeeze
- $75 becomes next target (secondary resistance)
- $80 represents major psychological/technical barrier
- Analyst average PT of $95.05 becomes achievable on 12-month view
Catalyst Support:
- Extremely negative sentiment creates contrarian setup
- Alpha Spread intrinsic value estimate: $199.07 suggests 68% undervaluation
- Multiple analysts maintained Outperform ratings despite price target cuts (RBC at $85, Susquehanna at $99, Oppenheimer at $91)
- Successful turnarounds from similar depths have occurred (e.g., Chipotle, Domino's)
- Mission-critical systems have high switching costs
Options Positioning: Would require massive shift - today's trade bets against this scenario
💡 Trading Ideas
🛡️ Conservative: Cash-Secured Put Selling at $65
The Setup: Sell January 16, 2026 $65 puts and collect premium
Why This Works:
- You're getting paid to potentially buy FISV at $65 - right where major put gamma support sits
- If assigned, your net cost basis would be ~$63.16 (strike minus premium collected)
- Worst case: You own FISV at a 72% discount to 52-week high with 7.2x forward P/E
- Best case: Stock stays above $65, you keep the premium, repeat next month
The Numbers:
- Premium collected: ~$1.84/share ($184 per contract)
- Breakeven: $63.16
- Max profit: Premium collected ($184 per contract)
- Max risk: $6,500 per contract (if stock goes to zero)
- Probability of profit: ~60% based on implied move analysis
Who This Is For: Investors who don't mind owning FISV at these depressed valuations and want to generate income while waiting. You're essentially siding with the bearish flow but at better prices than current levels.
Risk Management:
- Don't commit more than 5-10% of portfolio to any single position
- Be prepared to actually own the stock - only do this if you're bullish long-term
- Watch Q4 earnings date (Feb 10) - may want to close before that
Analyze this trade on AInvest →
⚖️ Balanced: Bear Put Spread
The Setup:
- Buy January 16, 2026 $68 puts
- Sell January 16, 2026 $65 puts
- Net debit: ~$1.50/share ($150 per spread)
Why This Works:
- Defined risk trade that profits if FISV drops to $65 (today's major put level)
- Your max loss is limited to the $150 premium paid
- Max profit: $300 per spread (if stock at or below $65 at expiration)
- 2:1 reward-to-risk ratio
The Numbers:
- Max profit: $300 per spread ($3 strike width - $1.50 debit)
- Max loss: $150 per spread (premium paid)
- Breakeven: $66.50 (roughly current levels!)
- Probability of profit: ~50-55%
Who This Is For: Traders who lean bearish but want defined risk. You're making a directional bet that FISV tests the $65 support level by January expiration without risking more than your upfront debit.
Risk Management:
- Close at 50% of max profit to lock in gains and reduce time decay risk
- Consider closing before earnings (Feb 10) if position is profitable
- Watch for break below $65 - may want to take profits if that happens
Aggressive Variation: Buy the $70 puts / Sell the $65 puts for larger profit potential (but higher cost)
🚀 Aggressive: Short Combo (Mimic Today's Whale Trade - SCALED DOWN)
The Setup:
- Buy January 16, 2026 $65 puts
- Sell January 16, 2026 $70 calls
- Net debit: ~$0.87/share ($87 per combo)
Why This Works:
- This is the exact strategy from today's $28M institutional trade, just scaled for retail
- Synthetic short position that profits from any downside below $65
- Capped upside at $70 from the short calls helps finance the put purchase
- Unlimited profit potential below $65 (down to zero)
The Numbers:
- Max risk: Unlimited above $70 (you're short calls!)
- Max profit: Technically unlimited downside ($65 strike - premium paid = $64.13 per share down to zero)
- Breakeven: $64.13 (stock needs to drop -6% from current)
- Best scenario: FISV drops to $58-62 range = $600-700 profit per combo
Who This Is For: Experienced traders who understand synthetic short positions and can handle the risk of short calls. This is NOT for beginners. You need approval for naked call selling (or use a spread to cap risk).
⚠️ CRITICAL RISKS:
- Short calls create unlimited loss potential if stock rallies hard
- Requires margin approval for uncovered calls
- If assigned on calls early, you'll be short stock
- Best for those who can actively manage and have risk tolerance for volatility
Safer Alternative: Instead of naked short calls, sell $70/$75 call credit spreads to cap your upside risk while still benefiting from bearish bias.
Position Sizing: Do NOT put more than 2-3% of portfolio into this strategy given the risk profile.
⚠️ Risk Factors
📉 What Could Go Wrong (For Bears)
Turnaround Execution:
- CEO Mike Lyons could prove skeptics wrong and successfully execute "One Fiserv" transformation
- Clover platform issues might be fixable with better product/service
- Q4 earnings could stabilize and restore some credibility
- 2026 guidance might prove conservative, setting up for beats
Valuation Floor:
- At 7.2x forward P/E, FISV is trading at financial crisis levels
- Smart money already accumulating at these prices (hedge funds bought Q3)
- Dividend yield of ~2% provides some downside cushion
- Strategic buyers or activists could emerge given depressed valuation
Legal Resolution:
- Class action lawsuits often settle for less than feared
- Congressional investigation may result in no material action
- Reputational damage already priced in at these levels
Market Dynamics:
- Short covering could trigger violent rally if any good news emerges
- Gamma squeeze potential above $70 if call wall breaks
- Year-end tax-loss selling done, could see relief rally in January
📈 What Could Go Wrong (For Bulls)
Guidance Credibility Destroyed:
- Track record obliterated by admission of "objectively difficult to achieve" assumptions
- Investors may discount all future projections
- "One Fiserv" transformation plan light on specifics and timelines
Competitive Pressures:
- Clover has just 5.77% market share vs Square (25%) and Toast (21.5%)
- Customer satisfaction issues and merchant churn could accelerate
- Technology debt requires massive investment with uncertain ROI
- Global Payments/Worldpay $22.7B mega-merger creates formidable competitor
Execution Risks:
- New CEO lacks chief executive experience
- 2026 is "investment year" - margins will compress
- Cultural change required from short-term to long-term focus
- Past 39-year double-digit EPS growth streak now broken
Legal and Regulatory:
- Securities fraud lawsuits could result in material settlements
- Congressional investigation could damage reputation further
- Discovery process may reveal embarrassing internal communications
- SEC whistleblower program activated - unknowns remain
Macro Headwinds:
- Consumer spending slowdown reduces transaction volumes
- Small business pressure impacts merchant acquiring segment
- J.P. Morgan calls 2025 "worst year for payment stocks in 15 years"
🎯 The Bottom Line
Real talk: Today's $28 million bearish bet on FISV isn't a panic trade - it's a calculated strike at key technical levels by someone with serious conviction or information.
Here's What We Know: The Z-scores (976x and 106x normal volume) tell us this is not normal activity - it happens maybe a few times a year in any stock. The timing is surgical: placed between major option expirations (Dec 19 and Jan 16) and before Q4 earnings (Feb 10). The strike selection is strategic: $65 puts at major gamma support, $70 calls at massive gamma resistance.
The Bull Case: FISV trades at multi-decade valuation lows (7.2x forward P/E) despite maintaining competitive advantages in core banking distribution (3,500 bank relationships) and mission-critical systems with high switching costs. Some smart hedge funds loaded up in Q3 before the crash. If new CEO Mike Lyons can execute even a modest turnaround, the stock could rerate toward the $85-95 analyst average price target. That's 25-40% upside.
The Bear Case: The October 29 earnings disaster wasn't just a bad quarter - it was an admission that management had been feeding investors guidance with "objectively difficult to achieve" assumptions. That destroys credibility. Clover is getting crushed by Square and Toast with product-market fit questions. The 39-year double-digit EPS growth streak is broken. Multiple lawsuits and Congressional investigations loom.
Where I Stand: The options flow today is bearish, but it's a tactical trade - not a "stock goes to zero" bet. The $65 strike represents just -4.4% from current levels and sits right at major put gamma support. This could be:
- Hedging by large institutional holder protecting downside into year-end
- Informed bearish bet expecting Q4 guidance to disappoint
- Pair trade short against a long position elsewhere in fintech
If You Own FISV: Consider whether you still believe in the long-term story. At $68 with a $95 price target, there's 40% upside if they execute. But the next 60 days are critical (legal deadline Jan 5, earnings Feb 10). Using protective puts or collars makes sense given elevated uncertainty.
If You're Watching: The risk/reward is complicated. Bears have momentum and today's flow, bulls have valuation and contrarian potential. The Jan 16 expiration cycle will be telling. Watch:
- Can $68 support hold this week?
- Does $70 resistance cap any rallies?
- What happens at the Jan 5 legal deadline?
Action Plan:
- Bearish traders: Use defined-risk spreads, not naked shorts - legal and execution risks are too unpredictable
- Bullish contrarians: Wait for a catalyst - maybe post-earnings if they stabilize
- Neutral/Income: Cash-secured puts at $65 offer decent risk/reward for patient capital
Mark your calendar: January 5, 2026 (legal deadline) and February 10, 2026 (Q4 earnings). Those dates will tell us if today's $28M bear bet was genius or early.
One thing's certain: Someone with deep pockets just told us they think FISV is heading lower. Whether they're right or not, we'll know soon enough. 👀
⚖️ Disclaimer
This analysis is for educational and informational purposes only and should not be considered financial advice. Options trading involves substantial risk of loss and is not suitable for all investors. The unusual options activity described may represent hedging, closing positions, or other strategies not discernible from public data. Past performance does not guarantee future results.
Key Risks:
- Options can expire worthless, resulting in 100% loss of premium paid
- Selling uncovered options creates unlimited loss potential
- Unusual options activity may not predict stock direction
- All trade ideas presented are hypothetical and not recommendations
- Company fundamentals can change rapidly, especially in crisis situations
Always:
- Conduct your own due diligence and research
- Consult with a qualified financial advisor before making investment decisions
- Only risk capital you can afford to lose
- Understand the mechanics and risks of any options strategy before trading
- Monitor positions actively and have exit plans
The author and AInvest may hold positions in securities discussed. This content is not sponsored by or affiliated with Fiserv, Inc.
Options trading is not suitable for all investors. Please read the Characteristics and Risks of Standardized Options before trading options.
Analysis Generated: December 11, 2025 Data Sources: ThetaData, Polygon.io, Company Filings, News Sources as Cited Last Updated: 2:16 PM EST