🏢 FR $5.4M Bull Call Spread - Industrial REIT Positioned for Recovery Rally! 📈
📅 December 5, 2025 | 🔥 Unusual Activity Detected
🎯 The Quick Take
Someone just constructed a $5.4 MILLION bull call spread on FR (First Industrial Realty Trust) this morning at 11:00:18! This sophisticated two-leg trade bought 10,000 contracts each at the $60 and $70 strike calls expiring March 20, 2026 - a classic bullish spread betting on a 5-22% rally in the industrial REIT sector leader. With FR at $57.35, this institutional player is positioning for a rebound in industrial real estate fundamentals over the next 105 days. Translation: Smart money is betting on the industrial REIT recovery story playing out through Q1 2026!
📊 Company Overview
First Industrial Realty Trust (FR) is a leading industrial REIT operating at the heart of America's logistics infrastructure:
- Market Cap: $7.52 Billion (pure-play industrial real estate)
- Industry: Real Estate Investment Trusts - Industrial Facilities
- Current Price: $57.35 (near 52-week high of $58.17)
- Primary Business: Owns, manages, acquires, develops and redevelops 414 industrial properties (68.5M SF) serving e-commerce, logistics, manufacturing, and distribution tenants across 15 major U.S. metros
💰 The Option Flow Breakdown
The Tape (December 5, 2025 @ 11:00:18):
| Time | Symbol | Side | Buy/Sell | Type | Expiration | Premium | Strike | Volume | OI | Size | Spot | Option Price |
|---|---|---|---|---|---|---|---|---|---|---|---|---|
| 11:00:18 | FR | ASK | BUY | CALL $60 | 2026-03-20 | $3.7M | $60 | 10K | 52 | 10,000 | $57.35 | $3.70 |
| 11:00:18 | FR | ASK | BUY | CALL $70 | 2026-03-20 | $1.7M | $70 | 10K | 0 | 10,000 | $57.35 | $1.70 |
🤓 What This Actually Means
This is a bull call spread - a sophisticated bullish bet with defined risk! Here's the breakdown:
- 💸 Net premium paid: $2.00/share × 10,000 contracts = $2,000,000 net debit ($3.70 paid - $1.70 received)
- 📊 Lower strike: $60 calls bought (4.6% above current price of $57.35)
- 🎯 Upper strike: $70 calls sold (22.1% above current price)
- ⏰ Time frame: 105 days to March 20, 2026 expiration
- 📈 Max profit: $8.00/share ($10 spread width - $2 paid) = $8,000,000 (400% ROI!)
- 📉 Max loss: $2,000,000 (limited to premium paid)
- 🎲 Breakeven: $62.00 (8.1% rally needed)
What's really happening here: This trader is making a LEVERAGED bullish bet on FR rallying 8-22% over the next 3.5 months, but they're doing it the smart way by selling the $70 calls to finance part of the cost. Instead of paying $3.70 for naked $60 calls (total cost $3.7M), they reduced the net cost to $2M by selling calls at a higher strike. This structure says: "I'm bullish on FR recovering to $60-70 by March, but I'll cap my upside at $70 to reduce my cost."
Unusual Score: 🔥 HIGH (192.3x average size on the $60 calls) - The $60 strike saw MASSIVE volume vs its open interest of only 52 contracts. This is fresh institutional positioning, not a routine spread roll. The $70 calls had ZERO open interest before this trade - they literally just created this position from scratch!
This timing is NOT random: With FR near its 52-week high at $57.35 (high: $58.17, low: $40.31), this player is betting the industrial REIT recovery has room to run despite already being up 42% from the lows. They're looking past current levels to Q1 2026 catalysts.
📈 Technical Setup / Chart Check-Up
YTD Performance Chart
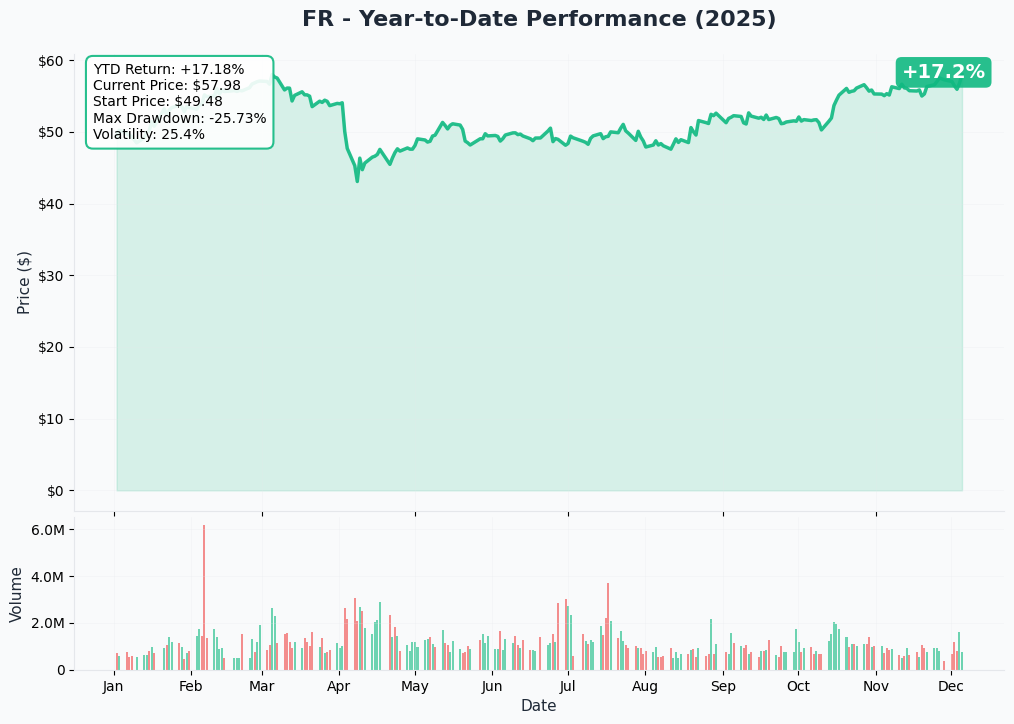
FR has staged an impressive comeback from the 2024 lows - the stock bottomed at $40.31 during the industrial real estate downturn and has rallied +42.3% to current levels of $57.35. This recovery reflects improving fundamentals in the industrial REIT space as occupancy rates stabilize and development pipelines generate returns.
Key observations:
- 🚀 V-shaped recovery: Sharp bounce from $40 lows in late 2024 to near $58 highs
- 📈 Breakout confirmed: Cleared $50 resistance decisively and hasn't looked back
- 📊 Strong momentum: Trading in upper end of 52-week range ($40.31-$58.17)
- 🎯 Consolidation zone: Stock has been range-bound $54-58 recently, building base for next leg
- 💪 Volume support: Institutional accumulation visible in the rally from $40s
The chart tells the story of an industrial REIT recovering from oversupply fears and interest rate headwinds. Now trading near all-time highs with catalysts ahead, the technical setup supports the bull call spread thesis.
Gamma-Based Support & Resistance Analysis
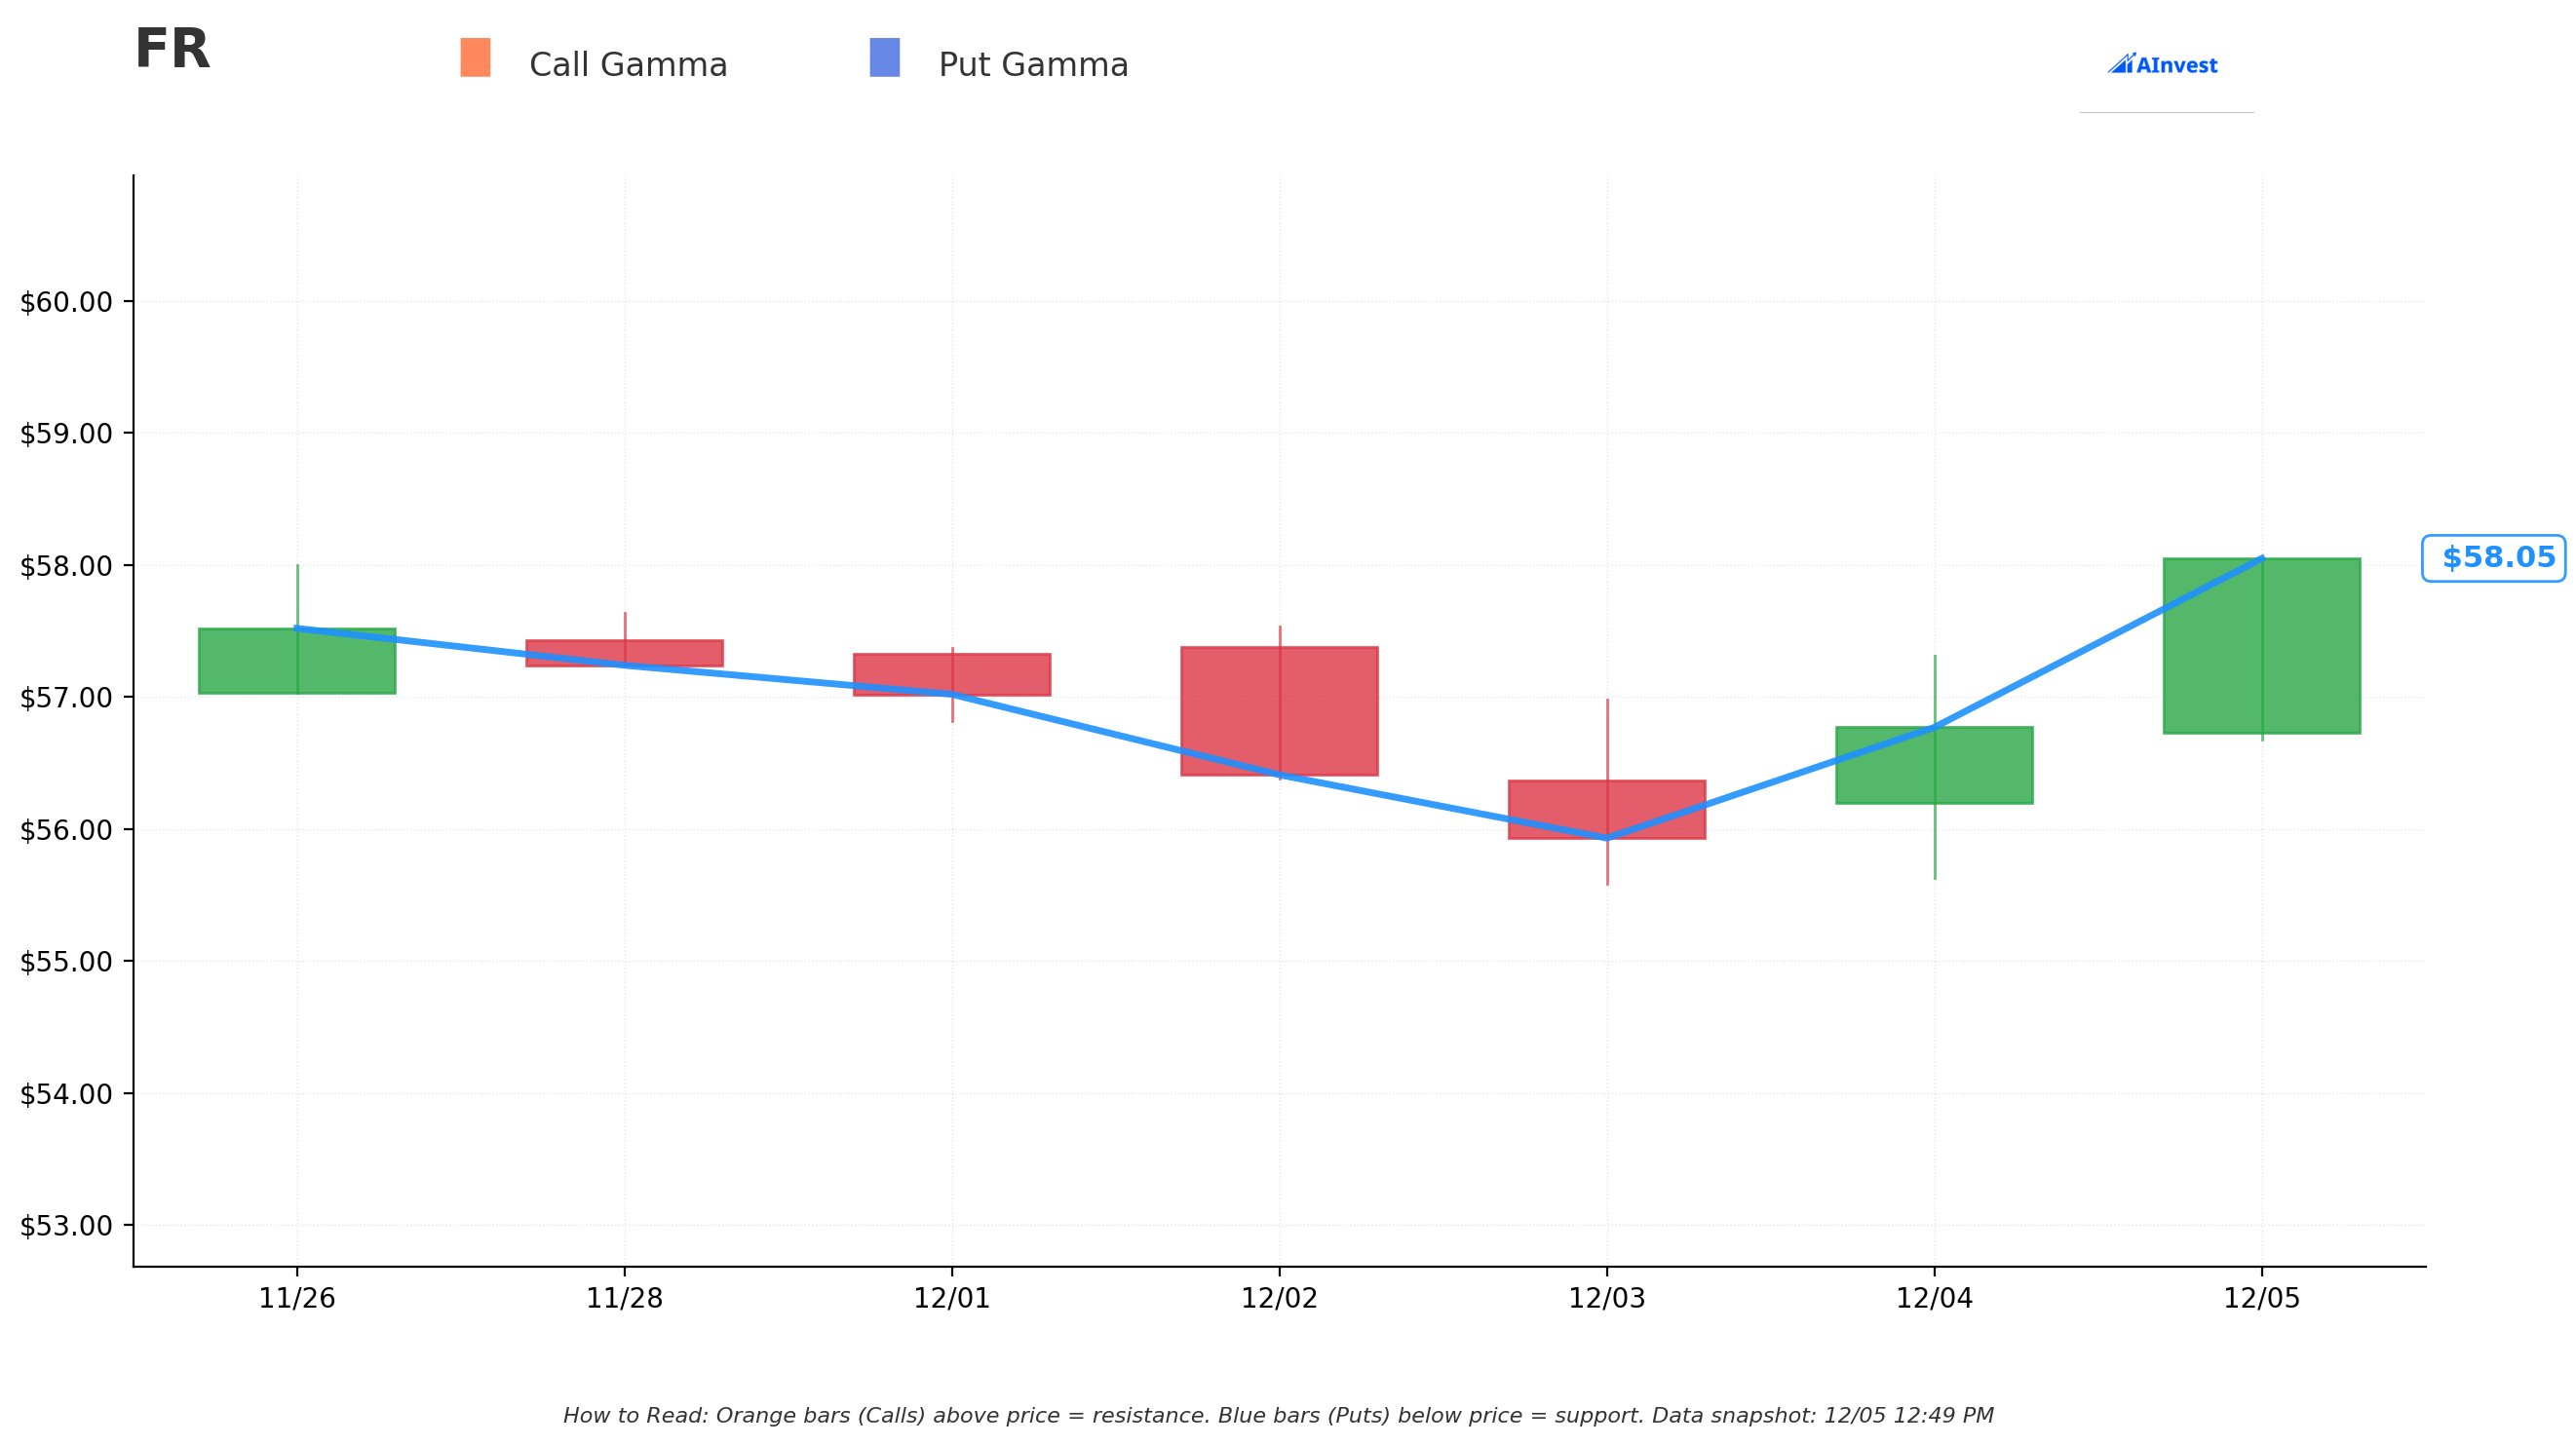
Current Price: $58.11
The gamma exposure map reveals critical price magnets that will govern near-term price action through March:
🔵 Support Levels (Put Gamma Below Price):
- $55 - Strong support with 0.81% total gamma exposure (5.3% below current price)
- $50 - Major structural floor with 0.43% gamma (14.0% below) - this was the breakout level that led to current rally
🟠 Resistance Levels (Call Gamma Above Price):
- $60 - Immediate ceiling with 1.90% gamma (3.3% above current) - EXACTLY where the bull call spread's long leg is struck!
- $65 - Extended resistance at 0.04% gamma (11.9% above)
What this means for traders: The gamma map shows a CLEAN setup with $60 as the dominant resistance level just 3.3% overhead. This creates a natural magnet for the stock - dealers holding large call positions at $60 will hedge by buying stock as FR approaches that level, creating upward momentum. The $55 support below provides a solid floor.
Notice the brilliance of this trade structure: The buyer struck the long calls at $60 - which is precisely where the largest call gamma sits (1.90%). This level represents maximum dealer exposure and will create natural buying pressure as price approaches. They're betting FR pushes through $60 and runs toward $70 by March expiration.
Net GEX Bias: Bullish (2.97% call gamma vs 0.29% put gamma) - Overall positioning is overwhelmingly bullish with 10x more call gamma than put gamma. This means dealers are SHORT calls and will need to buy stock on rallies to hedge, amplifying upward moves.
Support/Resistance Summary:
- Strongest Support: $55 (5.3% downside cushion)
- Strongest Resistance: $60 (3.3% overhead - the key battleground)
- Next Target: $65 (11.9% upside if $60 breaks)
Implied Move Analysis
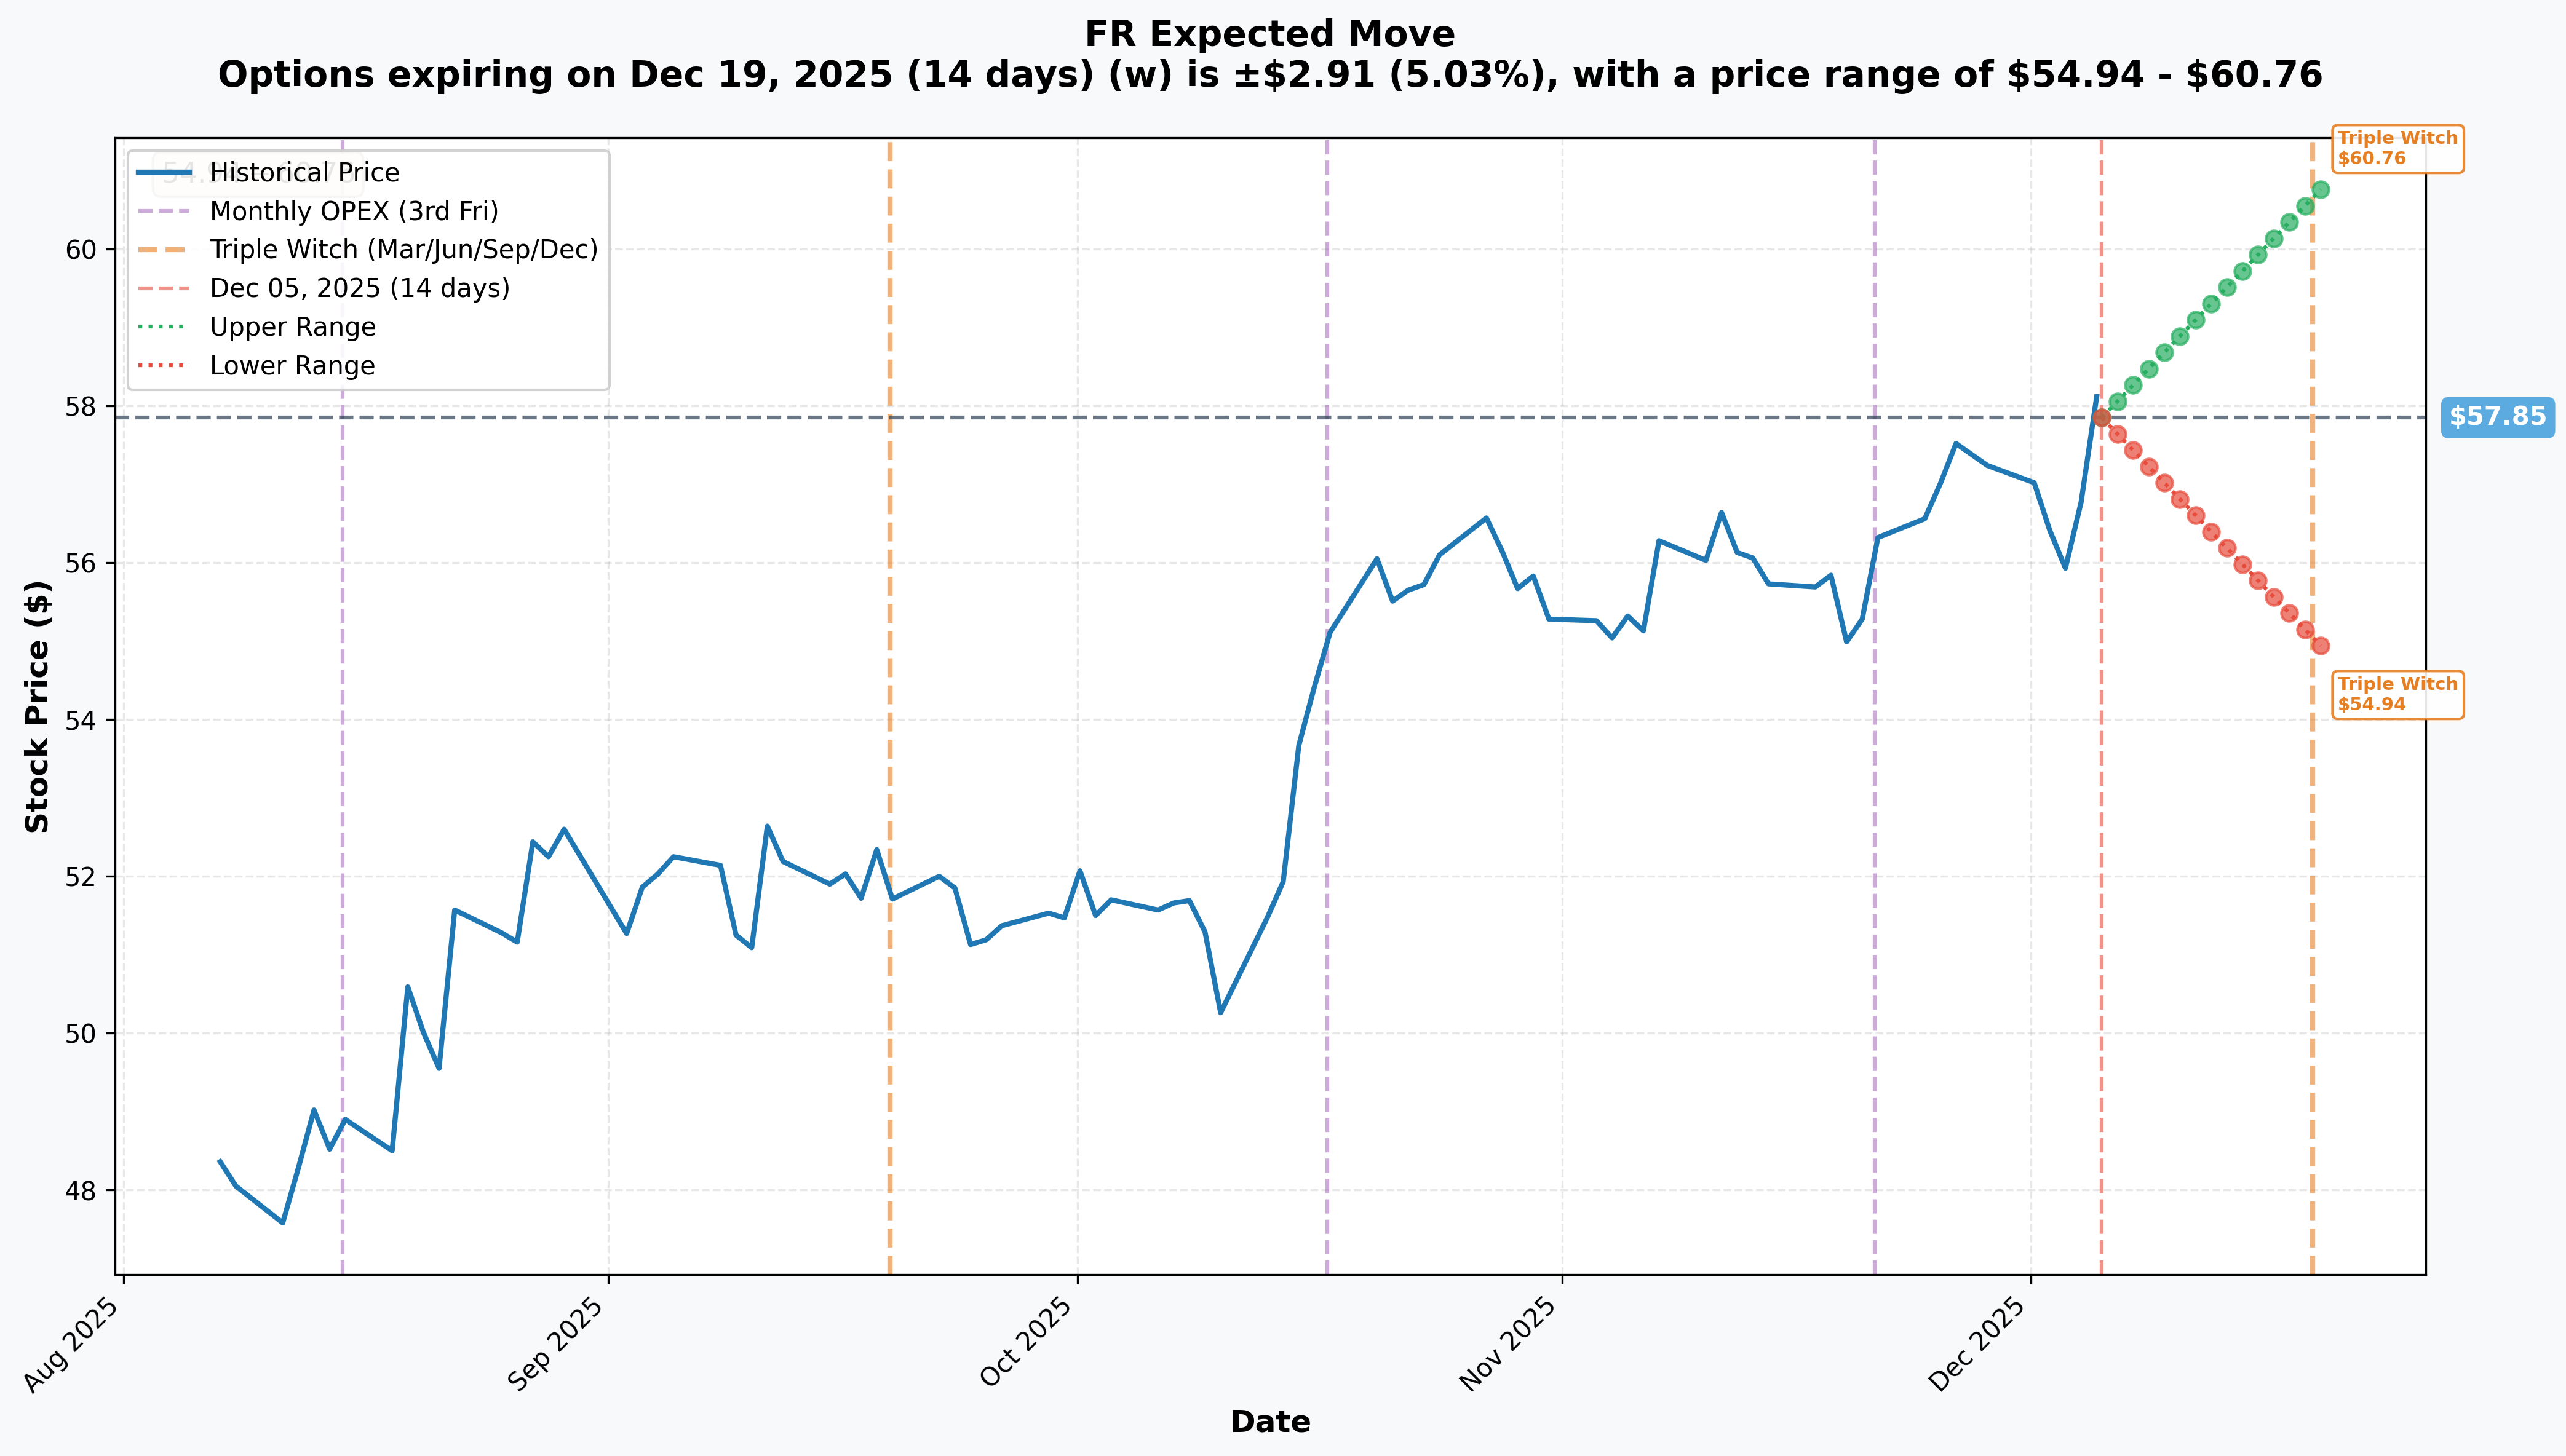
Options market pricing for upcoming expirations:
- 📅 Monthly OPEX (Dec 19 - 14 days): ±$2.91 (±5.03%) → Range: $54.94 - $60.76
- 📅 Quarterly Triple Witch (Dec 19 - 14 days): ±$2.91 (±5.03%) → Range: $54.94 - $60.76
Translation for regular folks: Options traders are pricing in a 5% move ($2.91) through December OpEx - meaning the market expects FR to trade in a $54.94-$60.76 range over the next two weeks. The upper end of this range ($60.76) aligns PERFECTLY with the bull call spread's $60 strike!
Key insight: The December implied move suggests FR could test $60 in the near term (upper range: $60.76), which would put the bull call spread INTO THE MONEY within just two weeks. The March expiration gives the position 105 days to work, but the spread could show profits much sooner if FR rallies through $60 in December.
The relatively modest 5% implied volatility (compared to tech stocks with 10-15% implied moves) reflects FR's nature as a defensive REIT with lower volatility. This makes the spread more predictable - you're not betting on wild swings, just a measured 8-22% rally over 3.5 months.
🎪 Catalysts
🔥 Recent Catalysts (Already Happened - Building Momentum)
Q3 2025 Earnings Results - October 15, 2025 (7 WEEKS AGO) 📊
FR delivered solid Q3 2025 results that beat EPS expectations and raised full-year guidance:
- 📊 Revenue: $181.43M (slight miss vs $182.93M consensus, but up 28% YoY)
- 💰 FFO: $0.76 per share, up 11.8% YoY from $0.68 in Q3 2024
- 🎯 EPS: $0.49, beating forecast of $0.39 by 25.64%
- 📈 Cash Same Store NOI Growth: 6.1% excluding termination fees
- 🏢 In-service occupancy: 94.0% at quarter-end (414 properties, 68.5M SF)
- 💵 Cash rental rate increases: 26.5% on commenced leasing (40.6% straight-line basis!)
- 🎯 Tenant retention: 71.5%
Guidance Raised: Management increased 2025 FFO midpoint by $0.04 to $2.96/share driven by development leasing successes and lower interest expenses. This represents 10% YoY FFO growth.
Development Wins in Q3: Signed 772,000 SF of new development leases, including 501,000 SF at Camelback 303 JV in Phoenix and others. This validates the $1.9B development pipeline strategy.
Full Year 2024 Performance (Reported Feb 5, 2025):
The 2024 results set the stage for 2025's momentum:
- 💪 FFO: $2.65 per share, up 8.6% from 2023
- 🔥 Cash rental rate growth: 50.8% for full year 2024 (second consecutive year above 50%!)
- 📊 Development leasing: 4.7M SF signed (second highest since 2012), beating 2.8M SF guidance
- 🏢 Year-end occupancy: 96.2% vs 95.5% at end of 2023
20.3% Dividend Increase - October 30, 2024 💰
Management's confidence is evident in the massive dividend hike to $0.445/share quarterly (from $0.37), reflecting cash flow strength. This 20.3% increase puts the annualized dividend at $1.78, yielding 3.1% at current prices.
Fitch Credit Upgrade to BBB+ - May 2025 📈
FR received Fitch upgrade to BBB+ (from BBB), validating balance sheet strength and providing access to cheaper capital for growth.
$850M Credit Facility Refinancing - March 2025 💵
The company closed new $850M revolving credit facility (added $100M capacity) with improved terms:
- Maturity: March 2029 (4+ years of runway)
- Rate: SOFR + 77.5 bps (eliminated 10 bps incremental adjustment)
- Provides financial flexibility for acquisitions and development funding
🚀 Upcoming Catalysts (Next 105 Days - Within Spread Expiration!)
Q4 2025 Earnings Release - February 5, 2026 (62 DAYS!) 📊
This is THE major catalyst before the March 20 options expiration:
- Expected Date: February 5, 2026 after market close
- Consensus FFO: $2.94-2.98 for full year 2025 (10% YoY growth target)
- Key Metrics to Watch:
- Q4 occupancy within 94-96% guided range
- 2026 FFO guidance initiation (market expecting high single-digit growth)
- Development pipeline updates and lease-up progress
- Same store NOI guidance for 2026 (2025 guidance was 6-7% cash basis)
- Commentary on industrial market fundamentals improving
Why this matters for the spread: If FR delivers on $2.96 FFO guidance and provides optimistic 2026 outlook, the stock could easily rally 10-15% toward the $60-70 spread strikes. Earnings will occur 43 days before options expiration, giving plenty of time for a post-earnings rally to play out.
Development Project Lease-Ups - Q4 2025 through Q1 2026 🏗️
FR's development pipeline represents a major value driver:
- Total potential: $1.9B of projects at over 7% yield on current land holdings
- Active projects: 9 developments totaling 2.2M SF with $146.6M remaining to be funded
Key near-term milestones:
- Camelback 303 Phoenix - Achieved 100% occupancy in Q3 with 1.8M SF fully leased (incremental NOI as tenants occupy through Q1 2026)
- First Park 121 Building F (Dallas) - 176,000 SF, $23M investment, ~8% yield, expected completion Q4 2025/Q1 2026
- First Park New Castle Building B (Philadelphia) - 226,000 SF, $31M investment, expected Q1 2026
Revenue impact: Each 100,000 SF leased at $8-12/SF market rates = ~$800K-$1.2M annual NOI. The 772,000 SF signed in Q3 = estimated $6-9M annual NOI once occupied.
Rent Roll-Ups Continue (Q1 2026) 💵
FR's pricing power remains exceptional:
- 50.8% cash rental rate growth in 2024
- 26.5% cash increases in Q3 2025
- Projected 3.45% portfolio-wide rent escalations for 2026
With 27% of industrial leases expiring by 2026 industry-wide and potential rent hikes up to 75% on below-market leases, FR is positioned to capture significant spread on lease renewals through Q1 2026.
Supply-Demand Dynamics Improving (2026 Inflection) 📊
After peak oversupply in 2024-2025, fundamentals are turning:
- Current vacancy: 9.6% nationally (elevated from 4% in 2022)
- Peak expected: 7.8% in 2026 per Cushman & Wakefield
- Supply moderating: New construction slowed from peak, fewer deliveries expected H1 2026
- Absorption improving: 30-40M SF/quarter should reduce vacancy by late 2025/early 2026
FR's advantage: Portfolio concentrated in supply-constrained coastal markets - their 94% occupancy vs 9.6% national vacancy demonstrates superior positioning.
Investment Sales Volume Recovery 💰
Industrial real estate transaction activity is surging:
- U.S. industrial sales: +14% in 2024 vs 2023
- Q1 2025: +25% YoY
- Transactions $50-100M: +37% YoY
- Mega-deals >$100M: more than tripled in early 2025
Rising transaction volumes support higher REIT valuations and provide exit opportunities for development projects.
🌍 Structural Tailwinds (Long-Term Support for Bull Thesis)
E-Commerce Growth Driving Industrial Demand 📦
The secular trend remains intact:
- E-commerce: 16.2% of total retail sales in Q3 2024 and rising
- Global B2C e-commerce: expected $5.2T by 2026
- 75% of logistics demand tied to regional distribution and local consumption (tariff-resistant)
- Last-mile delivery, cold storage, automation driving facility upgrades
Port Activity Supporting Demand:
Robust import activity requires more warehouse space for storage and distribution.
🎲 Price Targets & Probabilities
Using gamma levels, implied move data, catalyst timing, and bull call spread structure, here are scenarios through March 20, 2026:
📈 Bull Case (40% probability)
Target: $65-$70 (MAX SPREAD PROFIT)
How we get there:
- 💪 Q4 earnings (Feb 5) BEAT with FFO at high end of $2.94-2.98 range or above
- 🚀 2026 guidance strong: FFO growth 8-10%, occupancy recovering to 95-96%, same store NOI 6%+
- 🏗️ Development pipeline delivering: Multiple lease-ups announced for projects completing Q4/Q1
- 📈 Industrial fundamentals improving: Vacancy peaking at 7.8% with visible path to 6-7% by late 2026
- 💰 Rent roll-ups continue: Q4 and Q1 showing 20-30% cash rental rate growth on renewals
- 🌊 REIT sector rally: Interest rate stability or cuts lift entire sector (REITs up 15-20% in rising rate environments historically)
- 📊 Analyst upgrades: Multiple firms raise price targets to $65-70 range on improving fundamentals
- 🎯 Technical breakout: Stock clears $60 gamma resistance, runs to $65 then $70
Spread P&L in Bull Case:
- Stock at $65: Spread worth $5 (intrinsic), profit = $3/share × 10K = $30M gain (1,500% ROI!)
- Stock at $70+: Spread worth $10 (max), profit = $8/share × 10K = $80M gain (4,000% ROI!)
Key metrics needed:
- Q4 occupancy 95%+ (vs 94% in Q3)
- FFO $2.96+ for 2025, with 2026 guide $3.15-3.25
- Development yields maintaining 7%+ with lease-up momentum
- Analyst commentary turning bullish on industrial recovery timing
Probability assessment: 40% because it requires good execution but NOT perfection. FR has demonstrated strong operational performance (50.8% rent growth, 96.2% year-end occupancy, FFO growth). The industrial market is showing early signs of recovery. This is the "base case meets optimism" scenario.
🎯 Base Case (35% probability)
Target: $58-$63 (PARTIAL PROFIT)
Most likely scenario:
- ✅ Solid Q4 earnings meeting consensus (FFO $2.94-2.96)
- 📱 Development lease-ups progressing steadily but not spectacular
- ⚖️ 2026 guidance conservative: FFO growth 6-8%, citing macro uncertainty
- 📊 Occupancy stable in 94-96% range through Q1 2026
- 🤖 Industrial fundamentals improving but gradual - vacancy declining slowly
- 🔄 Stock trades in $58-63 range, approaching $60 strike but not breaking out decisively
- 💤 Modest rally post-earnings but consolidation before next catalyst
- 📉 REIT sector mixed performance - not major headwind or tailwind
Spread P&L in Base Case:
- Stock at $60: Spread worth $0 (at lower strike), profit/loss = -$20M loss (100% of premium)
- Stock at $62: Spread worth $2 (intrinsic), profit = $0/share × 10K = BREAKEVEN
- Stock at $63: Spread worth $3 (intrinsic), profit = $1/share × 10K = $10M gain (50% ROI)
This is the "grind higher" scenario: Stock appreciates modestly but doesn't reach the explosive upside needed for maximum spread profit. The position might show small gains or losses depending on where in the $58-63 range FR settles.
Why 35% probability: Stock has already rallied 42% from lows. Further gains require continued execution and improving fundamentals, which are likely but not guaranteed. This represents steady performance without major catalysts driving acceleration.
📉 Bear Case (25% probability)
Target: $52-$57 (FULL LOSS)
What could go wrong:
- 😰 Q4 earnings disappoint: FFO miss, occupancy below 94%, or weak 2026 guidance
- 🚨 Development lease-ups slower than expected - projects taking longer to stabilize
- ⏰ Industrial vacancy stays elevated through H1 2026 - recovery pushes to 2027
- 🇨🇳 Macro headwinds: Recession fears, tariff impacts, consumer spending slowdown
- 💸 Interest rates spike - Fed pauses cuts or raises again, pressuring REIT valuations
- 📊 Competitive oversupply persists in key markets (Chicago 12.7% vacancy, Columbus 13.1%)
- 💰 Rental rate growth moderates to single digits as supply catches up
- 🔨 REIT sector selloff: Broader real estate weakness drags all industrial REITs lower
- 📉 Break below $55 gamma support triggers technical selling to $50
Spread P&L in Bear Case:
- Stock at $55: Spread worth $0 (both strikes out of money), profit = -$20M loss (100%)
- Stock at $52: Spread worth $0 (both strikes out of money), profit = -$20M loss (100%)
- Stock below $60 at expiration = Entire $2M premium lost
Critical support levels:
- 🛡️ $55: Major gamma floor - if this breaks, momentum turns negative
- 🛡️ $52-54: Prior consolidation zone - key technical support
- 🛡️ $50: Major psychological level and gamma support from earlier rally
Probability assessment: 25% because it requires multiple negative catalysts. FR's fundamentals remain solid (6.1% same store NOI growth, 26.5% rent increases, development pipeline at 7%+ yields). But real estate is cyclical and macro headwinds could derail the recovery story. The spread buyer is risking $2M that could go to zero if thesis doesn't play out.
💡 Trading Ideas
🛡️ Conservative: Wait for Q4 Earnings Clarity
Play: Stay on sidelines until after February 5, 2026 earnings release
Why this works:
- ⏰ Earnings in 62 days is THE major catalyst - why guess before we have data?
- 📊 Stock near 52-week high at $57.35 (high: $58.17) - limited margin of safety
- 🎯 Better entry likely post-earnings if stock pulls back OR confirmation of bull case if guidance strong
- 💸 Options premium will be cheaper post-earnings (IV crush)
- 🤔 The $5.4M spread buyer is making a 105-day bet - you don't have to match that timeline
- 📈 Industrial REIT recovery thesis is multi-quarter story - missing a few weeks won't matter
Action plan:
- 👀 Watch February 5 earnings for FFO ($2.94-2.98 target), occupancy (need 95%+), and 2026 guidance quality
- 🎯 Look for pullback to $52-55 post-earnings for stock entry with better risk/reward
- ✅ Need to see development yields maintaining 7%+ and lease-up progress before committing
- 📊 Monitor industrial REIT sector (PLD, REXR, EGP) - if peers rally, FR should follow
- ⏰ Revisit mid-February when earnings results and guidance provide visibility
Risk level: Minimal (cash position) | Skill level: Beginner-friendly
Expected outcome: Avoid potential -10-15% drawdown if earnings disappoint. Get confirmation of bull thesis before risking capital. Maintain flexibility.
⚖️ Balanced: Copy the Spread Post-Earnings (Smaller Size)
Play: After February 5 earnings, if results positive, enter similar bull call spread
Structure: Buy $60 calls, Sell $65 or $70 calls (same March 20 expiration or later)
Why this works:
- 🎢 Post-earnings clarity reduces guesswork - you'll know if thesis is on track
- 📊 Defined risk spread (width determines max loss)
- 🎯 If earnings confirm recovery story and stock at $59-62, spread still has value
- 🤝 Essentially "copying" institutional positioning but with better information
- ⏰ 43 days from earnings to expiration gives time for post-earnings rally
- 🛡️ Could structure tighter spread ($60/$65) for less risk, or wider ($60/$70) for more upside
Estimated P&L (adjust after earnings):
- 💰 Pay ~$1.50-2.50 net debit per spread (depends on stock price post-earnings)
- 📈 Max profit: $2.50-3.50/spread if FR rallies to upper strike
- 📉 Max loss: $1.50-2.50/spread (defined and limited)
- 🎯 Breakeven: ~$61.50-62.50
- 📊 Risk/Reward: ~1:1 to 1.5:1 depending on structure
Entry criteria:
- ✅ Q4 earnings beat or meet with positive 2026 guidance
- 🎯 Stock trading $58-62 range (gives room to work toward strikes)
- ❌ Skip if stock already above $65 (spread too narrow)
- ❌ Skip if earnings disappoint - thesis invalidated
Position sizing: Risk only 3-5% of portfolio (this is directional speculation, not core holding)
Trade management:
- 📈 Take profits at 50-75% of max gain (don't get greedy)
- 📉 Exit if stock breaks below $55 (thesis broken)
- ⏰ Plan to close or roll 2-3 weeks before expiration if position ITM
Risk level: Moderate (defined risk, bullish directional) | Skill level: Intermediate
🚀 Aggressive: Long Synthetic Position (ADVANCED!)
Play: Create leveraged bull position using options (stock substitute)
Structure: Buy $55 calls, Sell $55 puts (March 20 or June expiration)
Why this could work:
- 🚀 Synthetic long stock - profits dollar-for-dollar with stock above $55
- 💰 Requires less capital than buying stock (pay net debit ~$2-4)
- 📊 Leverage: Control $55 worth of stock exposure for fraction of cost
- 🎯 $55 strike provides 4% downside cushion from current $57.35
- ⚡ Maximum upside participation if FR rallies to $65-70
- 📈 Benefits from gamma/delta acceleration as stock rises
Why this could blow up (SERIOUS RISKS):
- 💸 UNLIMITED DOWNSIDE: If stock crashes below $55, you're obligated to buy at $55 (like owning stock)
- ⏰ Assignment risk: Short puts can be assigned early, forcing you to buy stock
- 😱 Margin required: Broker will require margin for short put (typically 20-30% of strike)
- 📊 Two-way risk: Below $55 you lose dollar-for-dollar like stock ownership
- 🎢 Volatility risk: If stock stagnant, time decay on long call hurts
- ⚠️ Need stock to rally meaningfully above $57 to justify complexity vs just buying stock
Estimated P&L:
- 💰 Cost: ~$2-4 net debit (difference between call premium paid and put premium received)
- 📈 Profit scenario: Stock at $65 = $10 gain (8 points above $57, minus $2 cost = 200-400% ROI)
- 🚀 Home run: Stock at $70 = $15 gain (375-750% ROI depending on cost)
- 📉 Loss scenario: Stock at $52 = -$3 loss (obligated to buy at $55, stock worth $52)
- 💀 Disaster: Stock at $45 = -$10+ loss (massive loss like owning stock)
Breakeven: ~$57-59 (current price plus net debit paid)
CRITICAL WARNING - DO NOT attempt unless you:
- ✅ Have experience with synthetic positions and understand assignment mechanics
- ✅ Have margin account and can meet broker requirements for short puts
- ✅ Can afford to buy stock at $55 if assigned (10 contracts = $550,000!)
- ✅ Understand this is effectively leveraged stock ownership with downside risk
- ✅ Are comfortable holding position if stock drops to $50-52 range
- ⏰ Plan to actively manage - close/roll puts if stock threatens $55
Risk level: EXTREME (unlimited downside like stock) | Skill level: Advanced only
Probability of profit: ~50% (similar to stock, but with leverage amplifying gains/losses)
⚠️ Risk Factors
Don't get caught by these potential landmines:
-
⏰ Q4 earnings binary event (Feb 5): Results will make or break the near-term thesis. FFO miss, weak occupancy, or conservative 2026 guidance could send stock back to $52-54 range. Consensus expects $2.94-2.98 FFO for full year - any disappointment magnified. Development lease-up progress critical commentary area.
-
💸 Industrial oversupply persists longer than expected: National vacancy at 9.6% (October 2025) is more than double 2022 levels of 4%. If recovery to 6-7% takes until 2027 instead of 2026, rental rate growth could moderate sharply. 61% of Q1 2025 deliveries came online vacant - speculative construction still a headwind.
-
🌍 Macro recession derails recovery: Industrial real estate is cyclical - economic downturn would hit tenant demand hard. E-commerce slowdown, consumer spending weakness, or tariff impacts on imports could reduce absorption. Chicago (12.7% vacancy) and Columbus (13.1% vacancy) show some markets still oversupplied.
-
📉 Interest rate volatility pressures REIT valuations: Despite Fed cuts, 10-year Treasury remains elevated at 3.5-4.0%. Further rate increases or prolonged high rates compress cap rates and reduce property values. REITs trade at discount to NAV when rates high. FR's refinanced facilities provide some insulation but can't escape sector dynamics.
-
🏗️ Development pipeline execution risk: $1.9B pipeline at 7%+ yields requires successful lease-up at projected rents. Construction cost increases, lease-up delays, or tenant defaults could reduce returns. Still have $146.6M to fund on active projects - capital deployment risk if market deteriorates.
-
⚖️ Occupancy pressure if development backfills slow: Q3 occupancy declined to 94% from 96.2% year-end 2024. Management guides to 94-96% Q4 range. If new developments don't lease up as expected and existing tenants don't renew, occupancy could slip toward 92-93%, pressuring NOI growth.
-
💰 Rental rate growth moderating from 50% levels: While 50.8% cash rental rate growth in 2024 is exceptional, this represents rolling over deeply below-market leases signed in 2019-2020. As older leases burn off, mark-to-market opportunity shrinks. Projected 3.45% rent escalations for 2026 are much more modest.
-
🎯 Competitive threats from larger REITs: FR competes with Prologis (PLD) which has vastly greater scale and global reach. Larger REITs can outbid for acquisitions and have lower cost of capital. FR's $7.52B market cap is dwarfed by PLD's $100B+ - scale disadvantage in downturn.
-
📊 Options spread mechanics - capped upside: The $70 short calls cap gains at $70. If FR explodes to $75-80 on phenomenal earnings and guidance, the spread still maxes at $10 intrinsic value. You'd miss the upside beyond $70. This is the trade-off for reducing cost, but it means giving up home run potential.
-
⏰ Time decay working against spread: The $60 long calls will lose time value daily. With 105 days to expiration, theta decay accelerates in final 30-45 days. If stock doesn't rally by mid-February (pre-earnings), the spread could lose significant value even if thesis ultimately correct.
-
🚨 Institutional seller signal? While the buyer is bullish with the spread, we don't know who sold the $70 calls. If another large institution sold those calls (capping their upside), it suggests they don't see FR exceeding $70 by March. The 10,000 contract size means sophisticated players on both sides of this trade with different views.
🎯 The Bottom Line
Real talk: Someone just deployed $5.4 MILLION constructing a bull call spread on FR betting the industrial REIT recovery has legs through Q1 2026. This isn't a gamble - it's a calculated, defined-risk bet that FR rallies 8-22% from current levels over the next 105 days as development projects lease up, earnings beat expectations, and industrial fundamentals improve.
What this trade tells us:
- 🎯 Sophisticated player expects FR to reach $60-70 range by March 20 (5-22% rally from $57.35)
- 💰 They're confident enough to risk $2M premium but smart enough to cap gains at $70 (defined risk/reward)
- ⚖️ The timing suggests they see February 5 earnings as catalyst to push stock through $60 strike
- 📊 They structured with $60 and $70 strikes targeting realistic price levels (not lottery ticket $100 calls)
- ⏰ 105-day timeframe captures Q4 earnings, development lease-ups, and potential REIT sector recovery
This is a SMART, STRUCTURED bullish bet on the industrial REIT recovery story.
The bull case is compelling:
- ✅ Operational momentum: 50.8% rental rate growth, 96.2% occupancy, 11.8% FFO growth, 20.3% dividend hike
- ✅ Catalysts loading: Q4 earnings Feb 5, development lease-ups in Q1, vacancy peaking 2026
- ✅ Balance sheet strength: BBB+ rating, $850M facility, extended maturities to 2029-2031
- ✅ Secular tailwinds: E-commerce at 16.2% of retail and rising, port volumes +22.9%, logistics demand intact
- ✅ Valuation recovery: Up 42% from $40 lows but still room to $60-70 if fundamentals deliver
The risks are real:
- ⚠️ Earnings binary: Feb 5 results could disappoint on FFO, occupancy, or 2026 guidance
- ⚠️ Oversupply persists: 9.6% national vacancy vs 4% in 2022 - recovery could take until 2027
- ⚠️ Macro headwinds: Recession, tariffs, consumer weakness would derail demand
- ⚠️ Capped upside: Short $70 calls limit gains even if stock explodes higher
- ⚠️ Time decay: $2M premium evaporates if stock doesn't rally by expiration
If you own FR stock:
- ✅ This institutional spread validates your bullish thesis - smart money agrees
- 📊 Consider selling $60 or $65 calls against your shares for income (covered calls)
- ⏰ Hold through February 5 earnings to see if Q4 results confirm recovery trajectory
- 🎯 Set mental stop at $55 gamma support to protect gains if thesis breaks
If you're watching from sidelines:
- ⏰ February 5, 2026 earnings is the critical inflection point - WAIT for this data before entering
- 🎯 Post-earnings dip to $52-55 would be excellent stock entry (10-15% pullback provides margin of safety)
- 📈 Looking for confirmation: FFO $2.96+, occupancy 95%+, 2026 guidance 8-10% FFO growth, development progress
- 🚀 If earnings beat and guidance strong, consider similar bull call spread structure for defined-risk participation
- ⚠️ Current price $57.35 near 52-week high ($58.17) - wait for better entry or confirmation
If you're bearish:
- 🎯 Short thesis would require multiple failures: earnings miss, development delays, recession, persistent oversupply
- 📊 Support at $55 (gamma), major support at $50 - these need to break for bear case
- ⚠️ Fighting 42% rally and strong operational metrics (6.1% same store NOI, 26.5% rent growth) is tough
- ⏰ Better to wait for earnings miss or guidance cut before initiating bearish positions
Mark your calendar - Key dates:
- 📅 December 19, 2025 - Monthly/Quarterly OPEX (implied move: $54.94-$60.76 range)
- 📅 February 5, 2026 (Thursday) after market close - Q4 FY2025 earnings report (62 DAYS!)
- 📅 February 6, 2026 (Friday) 10:00 AM CST - Earnings conference call
- 📅 March 20, 2026 - Bull call spread expiration (105 days from today)
- 📅 Q1 2026 (Jan-Mar) - Development project completions and lease-ups expected
- 📅 Mid-2026 - Industrial vacancy expected to peak at 7.8%, then decline
Final verdict: FR's industrial REIT recovery story is supported by solid fundamentals - exceptional rental rate growth (50.8%), strong occupancy (96.2% at year-end), improving development pipeline ($1.9B at 7%+ yields), and secular e-commerce tailwinds. The $5.4M bull call spread is a smart, structured way to play the 8-22% rally potential through Q1 2026 while defining maximum risk at $2M.
BUT - and this is important - the spread only works if FR executes on February 5 earnings and rallies through $60 by March. At current $57.35 near 52-week highs, there's limited margin of safety. Waiting for earnings clarity or a pullback to $52-55 offers better risk/reward for retail traders.
The industrial recovery will be a multi-quarter story. Don't chase at the highs. Be patient, wait for confirmation, and enter with defined risk. 💪
Disclaimer: Options trading involves substantial risk of loss and is not suitable for all investors. Bull call spreads can result in total loss of premium paid ($2M in this case). This analysis is for educational purposes only and not financial advice. Past performance doesn't guarantee future results. The 192.3x unusual score reflects volume relative to open interest for the specific strikes traded - it does not imply the trade will be profitable or that you should copy it. Industrial REITs are sensitive to interest rates, economic cycles, and supply/demand dynamics. Always do your own research and consider consulting a licensed financial advisor before trading.
About First Industrial Realty Trust: First Industrial Realty Trust operates as a real estate investment trust that owns, manages, acquires, sells, develops, and redevelops industrial real estate, serving tenants across e-commerce, logistics, transportation, manufacturing, and distribution sectors with 414 properties totaling 68.5 million square feet, with a market cap of $7.52 billion.