☀️ FSLR $2.4M Put Position Closes - Smart Money Exits Downside Protection After 46% YTD Run
📅 January 2, 2026 | 🔥 Unusual Activity Detected
🎯 The Quick Take
Someone just closed a massive $2.4 million put position on First Solar, buying back 1,000 contracts of the 2028 $180 puts. This is a buy-to-close order - meaning a big player is exiting their downside protection after FSLR's monster 46% rally in 2025. When whales close protective puts on a solar stock trading 52% above the strike price, it signals confidence that the rally has legs.
💰 The Option Flow Breakdown
📊 What Just Happened
| Detail | Value |
|---|---|
| Symbol | First Solar (FSLR) |
| Contract | FSLR20280121P180 |
| Action | BUY TO CLOSE |
| Contracts | 1,000 puts |
| Strike | $180 |
| Expiration | January 21, 2028 (2-year LEAP) |
| Premium | $2.4 million |
| Stock Price | $274 |
| Moneyness | 34% out-of-the-money |
| Z-Score | 0.46 (Typical) |
🤓 What This Actually Means
This isn't a new bearish bet - it's the opposite. Someone originally bought these puts as insurance when FSLR was lower, possibly around $180-$200. Now with the stock at $274, they're closing the position and pocketing gains (or cutting losses on the insurance premium).
Translation for regular folks: When a trader closes protective puts after a big rally, they're essentially saying "I no longer need downside protection here." That's bullish body language from someone managing a $2.4M position. This is either profit-taking on insurance that paid off, or confidence that FSLR won't revisit those $180 levels anytime soon.
The typical z-score (0.46) confirms this isn't whale-sized activity, but $2.4M is still institutional money - not your neighbor's Robinhood account. The 2-year expiration tells us this was strategic protection, not a short-term trade.
🏢 Company Overview
First Solar, Inc. (Market Cap: $28.03B) is America's dominant thin-film solar manufacturer and the world's largest producer of cadmium telluride (CdTe) photovoltaic panels. With 8,100 employees across facilities in the U.S., Vietnam, Malaysia, and India, FSLR specializes in utility-scale solar projects that power everything from AI data centers to massive grid installations.
Why This Company Matters:
- Only vertically integrated U.S. thin-film manufacturer
- 47.45% global market share in thin-film technology
- Massive 53.7 GW contracted backlog worth $16.4 billion through 2030
- Benefiting from IRA Section 45X tax credits worth up to $2.4 billion annually
The stock crushed it in 2025, gaining 46% and hitting a fresh 52-week high of $285.99 after Alphabet's acquisition of Intersect Power, a major First Solar customer with 7.3 GW of module commitments.
📈 Chart Check-Up
YTD Performance
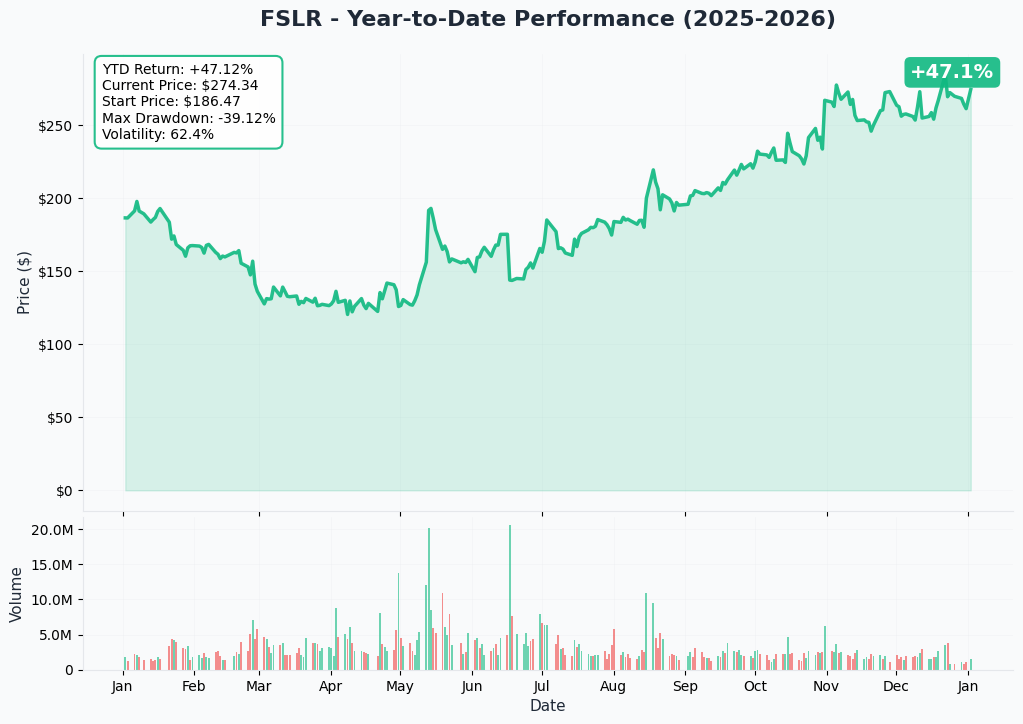
FSLR has been on an absolute tear, climbing from around $188 at the start of 2025 to current levels near $274 - a stunning 46% gain that outperformed both the S&P 500 and the MAC Global Solar Energy Index. The chart shows a consistent uptrend throughout 2025, with the stock breaking out to new highs in late December following the Alphabet-Intersect Power announcement.
Key Technical Observations:
- Strong uptrend channel maintained throughout 2025
- December breakout to 52-week high at $285.99
- Current consolidation near $274 after the holiday peak
- No major support tests since early 2025
The fact that someone's closing $180 puts with the stock at $274 makes perfect sense - that's 34% downside protection that's now costing money instead of providing value.
🎯 Gamma-Based Support & Resistance Analysis
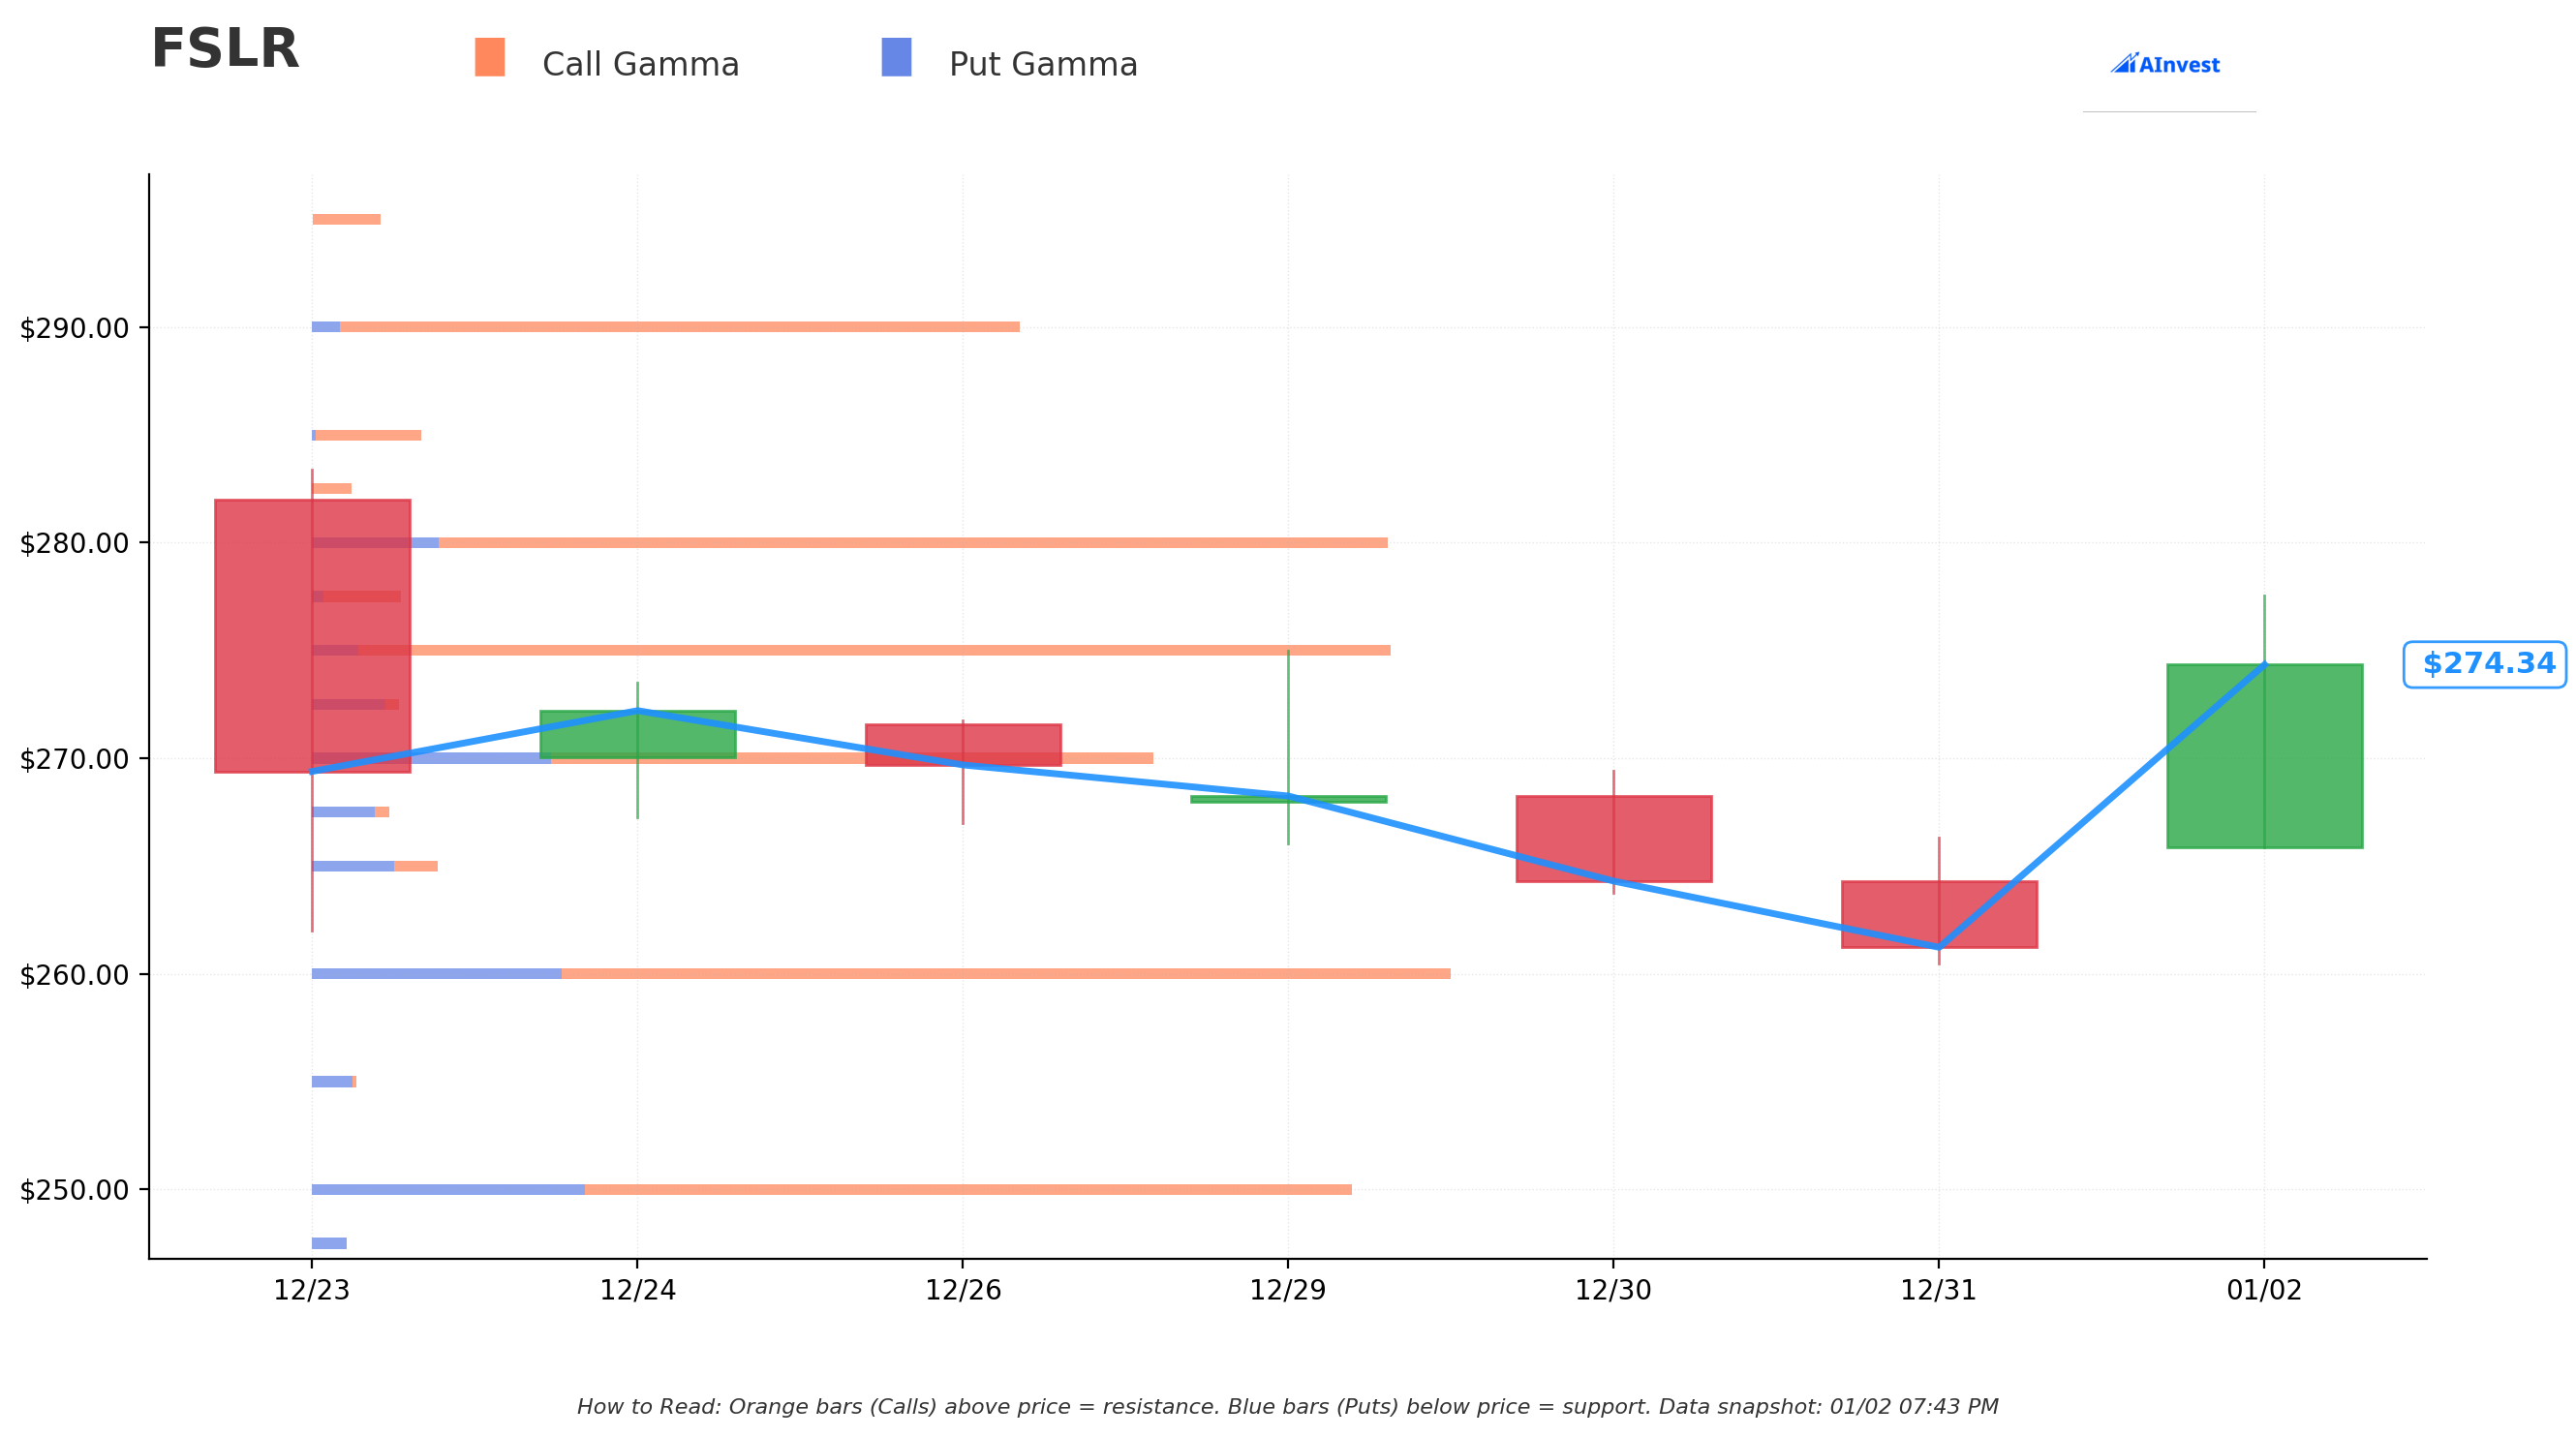
Current Price: $274
The gamma exposure map reveals FSLR's battleground zones where options dealers will fight to defend their positions:
Resistance Levels (Call Gamma - Orange Bars Above Price):
- $275 - Immediate ceiling with moderate call gamma
- $280 - Secondary resistance, would represent fresh YTD highs
- $290 - Major resistance level with significant call gamma buildup
- $300 - Psychological barrier and heavy call gamma wall
- $310 - Next major resistance if rally extends
- $320 - Outer resistance boundary
Support Levels (Put Gamma - Blue Bars Below Price):
- $270 - Strongest nearby support, massive put gamma cluster
- $260 - Secondary support level, significant put interest
- $250 - Major psychological and gamma support
- $240 - Deep support level with moderate put gamma
What This Means:
The massive put gamma wall at $270 explains why someone might close $180 puts - there's now a fortress of support 94 points higher! The gamma structure shows strong dealer positioning to defend the $270-$275 range, creating a tight trading band. Bulls need to clear $275-$280 to unlock momentum toward $290-$300, while bears would need to crack the $270 support to trigger cascading delta hedging flows.
The net GEX bias is bullish, suggesting dealers are net short calls and will need to buy stock as FSLR pushes higher - a positive feedback loop for momentum traders.
📊 Implied Move Analysis
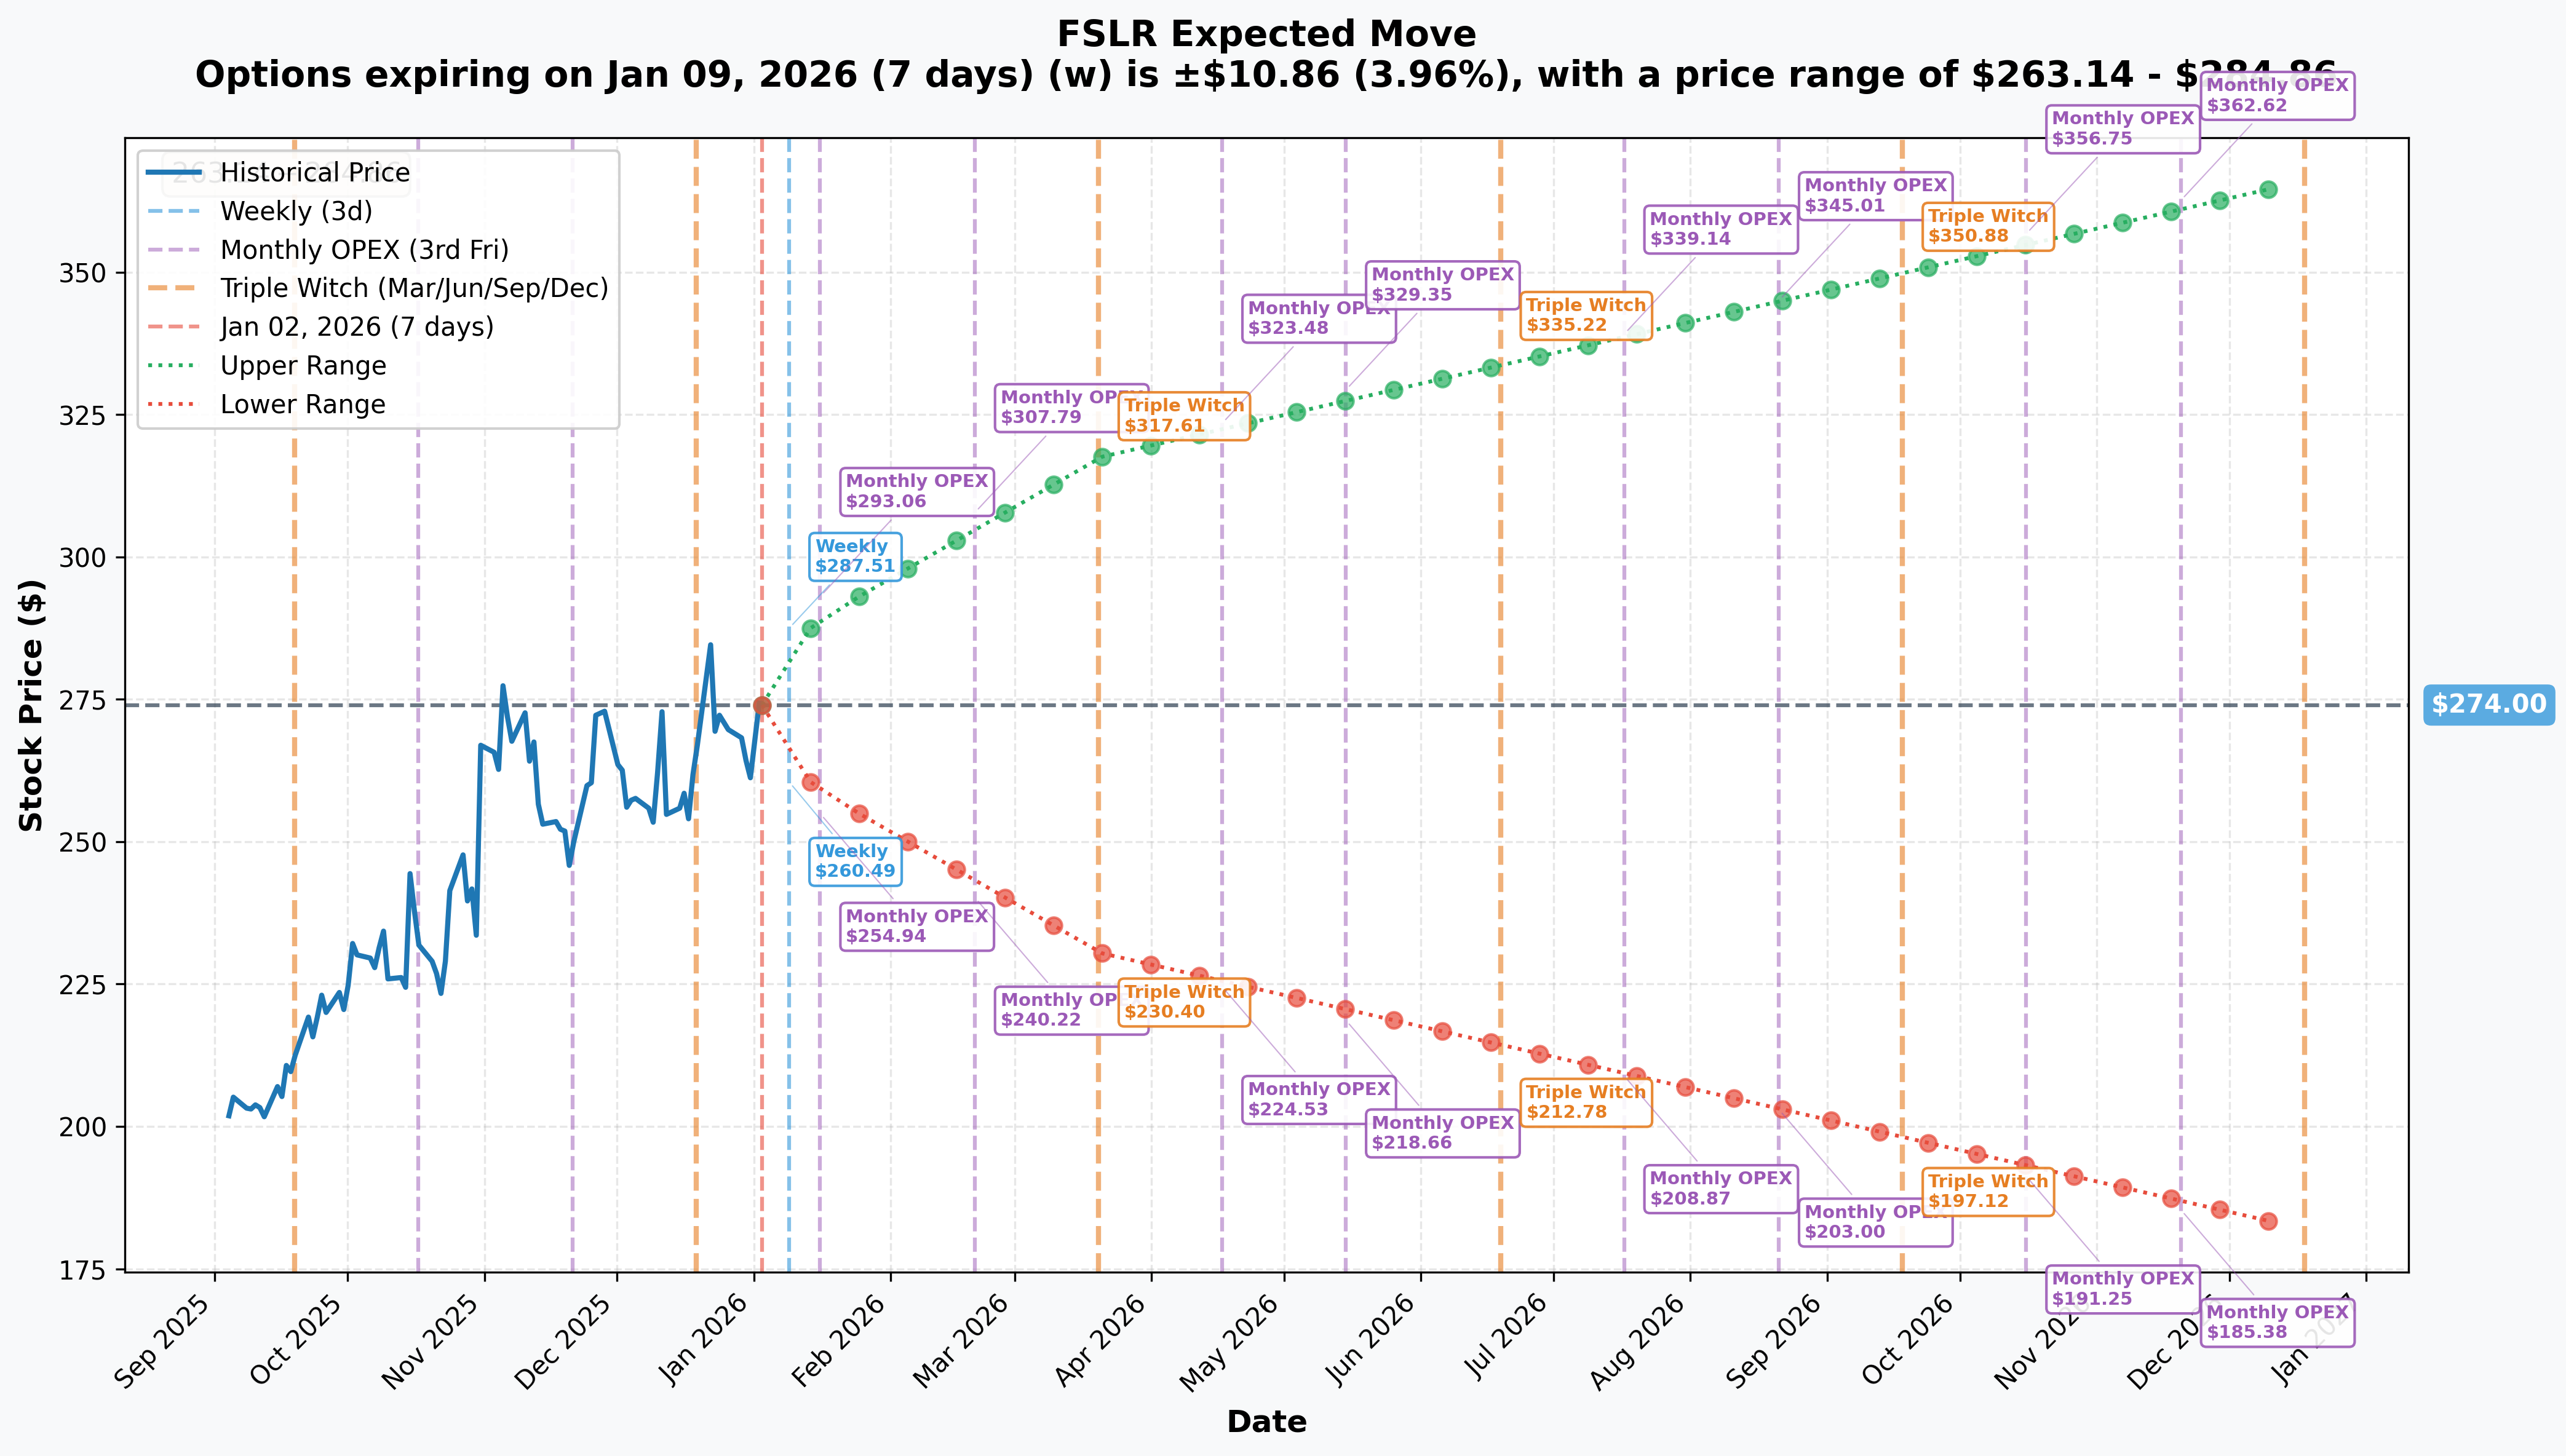
Options markets are pricing in substantial volatility expectations across multiple timeframes. Let me translate these ranges into real support and resistance levels:
Weekly (January 9, 2026 expiration):
- Implied Move: ±3.96%
- Expected Range: $263 - $285
- This suggests the market expects FSLR to stay within this $22 range over the next week
Monthly OPEX (January 16, 2026):
- Implied Move: ±5.65%
- Expected Range: $259 - $289
- January options expiration could bring a $30 swing in either direction
Quarterly Triple Witch (March 20, 2026):
- Implied Move: ±15.91%
- Expected Range: $230 - $318
- Q1 options expiration pricing in massive $88 range - nearly 32% total movement
LEAPS (December 18, 2026):
- Implied Move: ±33.64%
- Expected Range: $182 - $366
- Full-year outlook suggests potential for $274 to double OR get cut in half
What Traders Need to Know:
The escalating implied moves show uncertainty increasing with time horizon - classic behavior for a high-beta growth stock with binary catalysts ahead. That $182 lower bound on the LEAPS is particularly interesting - it's almost exactly where our trader's $180 puts would kick in. The options market is essentially saying there's a plausible scenario where FSLR revisits $180 levels by year-end 2026, but the near-term bias (weekly/monthly) is constructive with ranges respecting current support at $260-$270.
For swing traders, the weekly $263-$285 range provides clear boundaries. Break above $285 targets the monthly upper bound at $289, while a drop below $263 opens up the $259 support zone.
🎪 Catalysts & Upcoming Events
🔜 Upcoming Catalysts
Q4 2025 Earnings Report - March 3, 2026 📊
This is the big one. First Solar reports Q4 2025 earnings after market close on March 3, 2026. Wall Street expects full-year EPS somewhere in the $17-$20 range per the company's guidance.
What to Watch:
- Final 2025 revenue vs $5.08B guidance (down from initial $5.3B)
- 2026 guidance - this is make-or-break for the bull case
- Backlog updates after the 6.6 GW BP/Lightsource termination
- 45X tax credit monetization progress
- Timeline updates on the fifth U.S. factory
According to TipRanks earnings calendar, consensus 2026 EPS is $22.99 - that's 59% growth. If FSLR delivers on that outlook, the stock could gap higher. If they cut guidance again (like the -4.2% revenue reduction in October), watch out below.
Fifth U.S. Factory Commissioning - Q4 2026 🏭
First Solar announced a new 3.7 GW manufacturing plant expected to start operations in Q4 2026 with full production ramp through H1 2027. This $300 million investment will produce Series 6 modules and bring total U.S. capacity to 14 GW by end of 2026.
Revenue Impact: At $0.30/watt average selling price (ASP), this represents ~$1.1 billion in annual revenue potential at full utilization. That's a serious growth driver that's often overlooked.
IRA 45X Tax Credit Benefits - Ongoing 💰
First Solar is printing money from IRA Section 45X advanced manufacturing tax credits worth an estimated $1.575-$1.625 billion in 2025, potentially scaling to $2.4 billion annually as production ramps. The company has already monetized over $1.5 billion in credits through sales to Fiserv and others.
These credits are available through December 31, 2029, though recent amendments under the "One Big Beautiful Bill Act" created new placed-in-service deadlines for facilities beginning construction after July 4, 2026.
Bottom line: This is free money flowing directly to the bottom line - a massive competitive moat vs international competitors.
✅ Recent Catalysts (Already Happened)
Alphabet-Intersect Power Acquisition - December 22, 2025 🚀
Alphabet announced acquisition of Intersect Power on December 22, sparking FSLR's run to its 52-week high of $285.99. Intersect Power has 7.3 GW of First Solar modules under contract from 2025-2029, validating the AI data center demand thesis for utility-scale solar.
Why it matters: Tech giants need reliable, massive-scale renewable energy for AI infrastructure. This deal proves the demand is real and growing.
Louisiana Manufacturing Facility Launch - August 2025 🏗️
First Solar opened its $1.1 billion Louisiana facility in August 2025, adding 3.5 GW of annual Series 7 module capacity. The 2.4 million square foot plant employs 700+ workers and was completed in just 19 months.
Q3 2025 Earnings - October 30, 2025 📈
Q3 results showed record module sales of 5.3 GW but came with a guidance cut:
- Revenue: $1.59B (+79.7% YoY) - met expectations
- EPS: $4.24 (+45.7% YoY) - missed by 1.9%
- Guidance cut: Full-year revenue reduced from $5.3B to $5.08B (-4.2%)
- Operating margin compressed to 29.2% from 36.3% YoY
Mixed bag: Massive volume growth but margin pressure and guidance reduction spooked some investors.
BP/Lightsource BP Contract Termination - September 2025 ⚠️
First Solar filed lawsuit after BP terminated 6.6 GW of bookings at $0.294/watt ASP. This reflects European oil majors retreating from renewables, though FSLR noted that one large customer who previously terminated in 2024 has since rebooked orders in 2025.
Silver lining: Management says they're in active negotiations with another previously-terminated customer, and both satisfied termination payment obligations.
🎲 Price Targets & Probabilities
Using the gamma levels, implied move data, catalyst calendar, and analyst consensus, here's my framework for the next 3-6 months:
🚀 Bull Case: $310-$330 (30% probability)
Path to Get There:
- March 3 earnings deliver strong Q4 results and raise 2026 guidance to $22+ EPS
- Backlog additions offset BP termination concerns
- Fifth factory timeline confirmed for Q4 2026 commissioning
- 45X tax credit monetization continues at $2B+ annual run rate
- Broader solar sector recovery on stabilizing China competition
Key Gamma Targets: Clear $275 resistance → $280 → $290 → $300 milestone → $310-$320 range
Analyst Support: UBS has a $330 price target (raised from $275 in November), and consensus among 30 analysts averages $272-$280. The bull case requires multiple positive catalysts aligning.
Implied Move Context: The quarterly triple witch range tops out at $318, suggesting the market sees this scenario as plausible but not base case.
⚖️ Base Case: $260-$290 (50% probability)
Most Likely Scenario:
- Q4 earnings meet lowered guidance but 2026 outlook comes in-line (not a beat)
- Stock consolidates in the $270-$280 range post-earnings
- Gamma support at $270 and resistance at $275-$280 create a trading range
- Factory expansion proceeds on schedule but doesn't generate immediate excitement
- Sector headwinds (Chinese competition, global oversupply) persist but don't deteriorate
Trading Range: The weekly and monthly implied moves ($263-$285 and $259-$289) suggest this is where the smart money is positioned. Gamma levels confirm $270 as the key support floor and $280-$290 as the near-term ceiling.
What Happens to Our Put Closer: They made the right call - the $180 puts were never getting tested in this scenario, so closing at $274 was logical risk management.
😰 Bear Case: $220-$240 (20% probability)
What Could Go Wrong:
- March earnings disappoint with another guidance cut for 2026
- Customer terminations accelerate beyond BP (backlog drops below 50 GW)
- Chinese-backed U.S. manufacturers ramp faster than expected
- IRA Section 45X faces legislative threats or implementation delays
- Broader solar sector collapse on global oversupply (Chinese Big Four lost $1.54B in H1 2025)
- Margins compress further from 29% toward 20-25% range
Technical Breakdown: Lose $270 gamma support → test $260 → break down to $250 psychological support → gap fill to $240
Implied Move Warning: The quarterly range extends down to $230 and LEAPS price in potential for $182. While unlikely in Q1, the options market is pricing non-trivial probability of a major correction.
Historical Context: FSLR traded at $116 in its 52-week low during 2025. A perfect storm of bad news could revisit the $220-$240 range where the stock traded in mid-2025.
💡 Trading Ideas
Real talk: This put closure is a bullish signal, but FSLR is up 46% in a year and facing the critical March 3 earnings test. Here's how to play it based on your risk tolerance.
🛡️ Conservative: "Show Me The Earnings" Strategy
Wait for March 3 earnings clarity, then deploy capital.
Structure:
- Stay in cash until after March 3 earnings
- If earnings beat and guide up: Buy shares at $260-$270 on any post-earnings dip
- Stop loss: $255 (below gamma support cluster)
- Target: $290-$300 (next gamma resistance zone)
Why This Works: You avoid the binary earnings risk entirely. If FSLR gaps up on great news, you miss the first $10-15, but you also don't get destroyed if they cut guidance again like October. The gamma data shows $270 is the line in the sand - if that holds post-earnings, the risk/reward favors buyers.
Position Size: 2-3% of portfolio max
Probability of Success: 60% (assumes disciplined entry below $270 after positive earnings confirmation)
⚖️ Balanced: "Sell Premium Into Strength" Strategy
Capitalize on elevated implied volatility before earnings.
Structure:
- Sell Feb 21 $280-$290 bull put spread (collect premium, define risk)
- Sell $280 put / Buy $270 put
- Collect ~$3.50-4.00 credit per spread
- Max risk: $6.00-6.50 per spread
- Breakeven: ~$276
- Max profit if FSLR stays above $280
Why This Works: The weekly implied move shows $263-$285 range, meaning $280 is right at the upper end of expected movement. You're selling puts at resistance with gamma support at $270 providing a natural floor. Even if FSLR drifts to $270-$275, you capture partial profits.
Position Size: Risk 1-2% of portfolio (max loss on spread)
Probability of Success: 55-60% (FSLR needs to stay above $280, or you can roll/adjust at $275)
Exit Plan: Take profits at 50% of max gain ($1.75-2.00), or roll down and out if FSLR breaks $270 support before Feb 21.
🚀 Aggressive: "Fade the Gamma Resistance" Call Spread
Bet on breakout above $280 into March earnings hype.
Structure:
- Buy Feb 21 $275/$285 bull call spread
- Buy $275 call / Sell $285 call
- Cost: ~$4.00-5.00 debit per spread
- Max profit: $5.00-6.00 per spread (100%+ ROI)
- Breakeven: ~$279-280
- Max profit if FSLR rallies to $285+
Why This Works: FSLR is consolidating right below resistance at $275-$280. If earnings commentary leaks positive or sector momentum builds, gamma dealers will need to chase the stock higher (net short calls). The Alphabet-Intersect deal showed FSLR can gap $10-15 on positive news. You're risking $4-5 to make $5-6 if the breakout happens.
Position Size: 0.5-1% of portfolio (high risk/high reward)
Probability of Success: 40-45% (requires breakout above $280 AND hold through Feb 21)
Exit Plan:
- Scale out at $282 (50% off), let rest run to $285-$290
- Cut losses at $272 if breakdown occurs (don't let spreads go to zero)
Alternative Aggressive Play: Buy March 275 calls outright (~$12-15 cost) to capture earnings volatility expansion, but this requires perfect timing and carries higher risk.
⚠️ Risk Factors
Let me be straight with you about what could wreck these trades:
📉 Execution & Guidance Risks
The October Warning Sign: FSLR already cut 2025 revenue guidance by 4.2% in October, dropping operating margins from 36.3% to 29.2% YoY. If they cut 2026 guidance on March 3, the stock could gap down 10-15% overnight, blowing through gamma support at $270.
Factory Ramp Delays: The fifth U.S. factory (3.7 GW) is critical for 2027+ growth. Any delays in Q4 2026 commissioning removes a major bull thesis pillar.
🌏 Competitive Apocalypse
Chinese Price War: Chinese solar modules trade at $0.10-0.16/watt while First Solar sells at $0.30+/watt. Even with tariff protection, that's a massive cost disadvantage.
Domestic Competition: Chinese-backed firms are building ~50% of U.S. domestic solar capacity by next year. FSLR's "Made in America" moat is eroding.
Technology Gap: While China advances n-type TOPCon technology, the U.S. (including FSLR's CdTe) risks falling behind on efficiency metrics.
🏛️ Policy Landmines
IRA Changes: The "One Big Beautiful Bill Act" in July 2025 already amended IRA credits with new placed-in-service deadlines. Future legislative changes could reduce 45X benefits currently worth $2.4B annually.
Tariff Volatility: Trump-era tariffs range 10-50% by country, creating unpredictable cost structures. Vietnam faces 46% tariffs, forcing FSLR to reduce international production.
🔻 Customer Concentration Risk
The BP Disaster: BP/Lightsource terminated 6.6 GW of contracts ($1.95B value) in September 2025. If another major customer follows suit, the 53.7 GW backlog could drop below 50 GW, triggering a crisis of confidence.
European Energy Retreat: Major oil companies are exiting renewable development, removing a key customer segment.
🌊 Macro Headwinds
2026 Solar Slowdown: Bloomberg BNEF forecasts global solar additions will fall for the first time in 2026 to 649 GW (down from 2025 levels). Industry-wide demand destruction is a real threat.
Interest Rate Sensitivity: Higher rates kill solar project economics by increasing financing costs for utility-scale installations.
🎯 The Bottom Line
Here's the deal: This $2.4M put closure is smart money saying "we don't need insurance at $180 anymore." That's a vote of confidence after a 46% year, but it doesn't mean FSLR can't pull back to $260-$270 before the next leg up.
If you own FSLR:
- Hold through March 3 earnings if you're long-term bullish on U.S. solar manufacturing
- Consider taking partial profits above $280 and re-entering at $265-$270 on any earnings dip
- Use the $270 gamma support level as your stop-loss - break below means something's broken
If you're watching FSLR:
- Wait for post-earnings clarity on March 3 before deploying serious capital
- The $263-$285 weekly range provides clear trading boundaries
- Mark your calendar for Q4 2026 factory commissioning updates
If you're bearish:
- The March 3 earnings call is your opportunity - if guidance disappoints, $270 support will be tested
- Watch for backlog updates below 50 GW as a bearish trigger
- Respect the gamma support at $270 - shorting into that wall is dangerous
The Real Story: First Solar sits at the intersection of U.S. energy independence, AI data center demand, and a Chinese solar apocalypse. The $2.4 billion in annual IRA tax credits creates a fortress around the business model, but execution must be flawless to justify a 20x P/E ratio in a commodity industry.
March 3 earnings will decide whether FSLR breaks out to $300+ or revisits the $250-$260 support zone. Until then, trade the gamma ranges, respect the volatility, and size your positions accordingly.
⚠️ Options Risk Disclaimer: Options trading involves substantial risk and is not suitable for all investors. This analysis is for educational and informational purposes only and does not constitute financial advice. The strategies discussed involve defined risk but can result in total loss of premium paid. Past performance does not guarantee future results. Consult a licensed financial advisor before making investment decisions. The author may hold positions in securities discussed.
Data as of January 2, 2026. Options pricing and gamma levels are dynamic and change throughout each trading session.