💎 GLD Massive $38M Bull Call Spread - Gold Set for Fed-Driven Breakout! 🚀
📅 December 4, 2025 | 🔥 Unusual Activity Detected
🎯 The Quick Take
Someone just deployed a $38 MILLION bull call spread on GLD this morning at 10:15:22! This sophisticated trader bought 113,670 contracts of the $400 calls while simultaneously selling 113,670 of the $415 calls (both January 16, 2026 expiration) - betting gold breaks out to new highs by mid-January. With gold trading near all-time highs at $387.69 and the January 28-29 FOMC meeting just weeks away, this is a massive bet that Fed rate cuts, central bank buying, and geopolitical tensions drive GLD through $400. Translation: Institutional money is betting $38M that gold's historic rally continues!
📊 ETF Overview
SPDR Gold Trust (GLD) is the world's largest physical gold-backed ETF, offering direct exposure to gold bullion prices:
- Market Cap/AUM: $74.0 Billion (largest gold ETF globally)
- Type: Commodity ETF - Physical Gold Bullion Trust
- Current Price: $387.69 (near all-time high of $403.30)
- Expense Ratio: 0.40%
- Primary Holdings: Physical gold bars stored in London vaults
💰 The Option Flow Breakdown
The Tape (December 4, 2025 @ 10:15:22):
| Time | Symbol | Side | Buy/Sell | Type | Expiration | Premium | Strike | Volume | OI | Size | Spot | Option Price |
|---|---|---|---|---|---|---|---|---|---|---|---|---|
| 10:15:22 | GLD | ASK | BUY | CALL $400 | 2026-01-16 | $70M | $400 | 113,670 | - | 113,670 | $387.69 | $6.16 |
| 10:15:22 | GLD | BID | SELL | CALL $415 | 2026-01-16 | $32M | $415 | 113,670 | - | 113,670 | $387.69 | $2.81 |
Net Premium Paid: $38,000,000 ($70M - $32M = $38M debit)
🤓 What This Actually Means
This is a textbook bull call spread - a defined-risk bullish position popular with sophisticated institutions! Here's the breakdown:
- 📊 Structure: Buy lower strike ($400), sell higher strike ($415) = bullish spread
- 💰 Cost basis: Net debit of $3.35 per spread ($6.16 - $2.81) × 113,670 contracts = $38.1M total cost
- 🎯 Max profit: $15 wide spread - $3.35 cost = $11.65 per spread = $132M potential profit if GLD ≥ $415 at expiration
- 📉 Max loss: Limited to premium paid = $38M if GLD stays below $400
- ⚖️ Breakeven: $400 + $3.35 = $403.35 (3.2% above current price)
- ⏰ Time to expiration: 43 days (expires January 16, 2026)
- 🎪 Captures: January FOMC meeting (Jan 28-29), monthly employment reports, inflation data
What's really happening here: This trader believes gold is positioned to break through the psychological $400 level (3.2% above current $387.69) and potentially reach $415 (7% rally) by mid-January. The spread structure caps their upside at $415 but dramatically reduces the cost compared to buying outright calls. Instead of paying $6.16 per call ($70M for 113,670 contracts), they paid only $3.35 net by selling the $415 calls. This is classic institutional positioning: directionally bullish but using spread mechanics to improve risk/reward.
Why this level of conviction? The timing is CRITICAL - this position captures:
- The January 28-29, 2025 FOMC meeting where Fed policy stance will be clarified
- December CPI data (released early January) which could show cooling inflation supporting rate cuts
- Continued central bank gold accumulation, particularly China's resumed purchases
- Ongoing geopolitical tensions supporting safe-haven demand
Unusual Score: 🔥 EXTREMELY UNUSUAL - Both legs show Z-scores of 34.47 and 106.49, meaning this happens only a few times per year for GLD. The volume on both strikes was 113,670 contracts vs typical daily option volume of 3-4k contracts per strike. This is 30-40x normal size!
📈 Technical Setup / Chart Check-Up
YTD Performance Chart
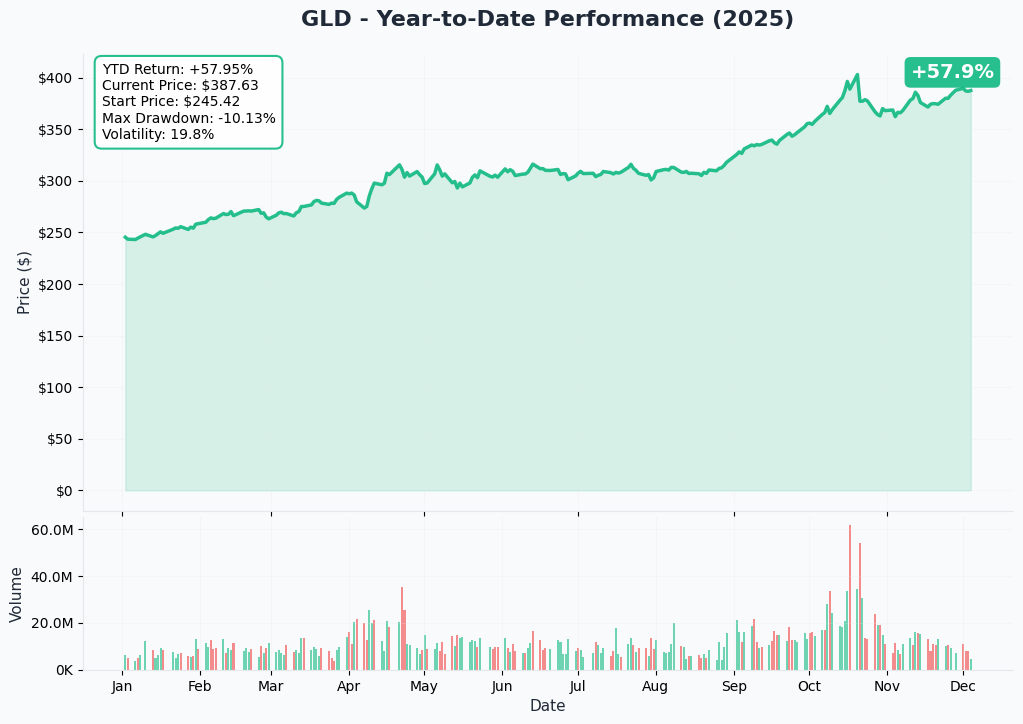
GLD is delivering an absolutely HISTORIC year - up +57.94% YTD with current price of $388.86 (started the year at $246). This isn't just a good year for gold - this is the kind of rally that happens once in a decade! The chart tells a powerful story of monetary policy shifts and safe-haven demand.
Key observations:
- 🚀 Sustained breakout: After testing $240 resistance multiple times in January-March, GLD finally broke through in April and never looked back
- 📈 Accelerating momentum: The rally steepened in October-November, rising from $320 to $403 (26% in 8 weeks) on OpenAI partnership news with AMD and Fed rate cut expectations
- 📊 All-time highs: Set new record at $403.30 on October 30, 2024 before modest pullback to current $388
- 🌍 Global catalyst rally: Driven by Fed rate cuts (100bps in 2024), record central bank buying (1,045 tonnes), and geopolitical risk premium
- 📉 Shallow pullback: Only 3.7% correction from peak to current level shows strong underlying bid
- ⚠️ Extended short-term: After doubling in less than a year, near-term consolidation possible, but trend remains firmly bullish
The chart makes the bull case visually obvious - this is a breakout that's been sustained for 8+ months with strong institutional accumulation on every dip. The $400 strike target is only 3.2% away - well within reach if momentum continues.
Gamma-Based Support & Resistance Analysis
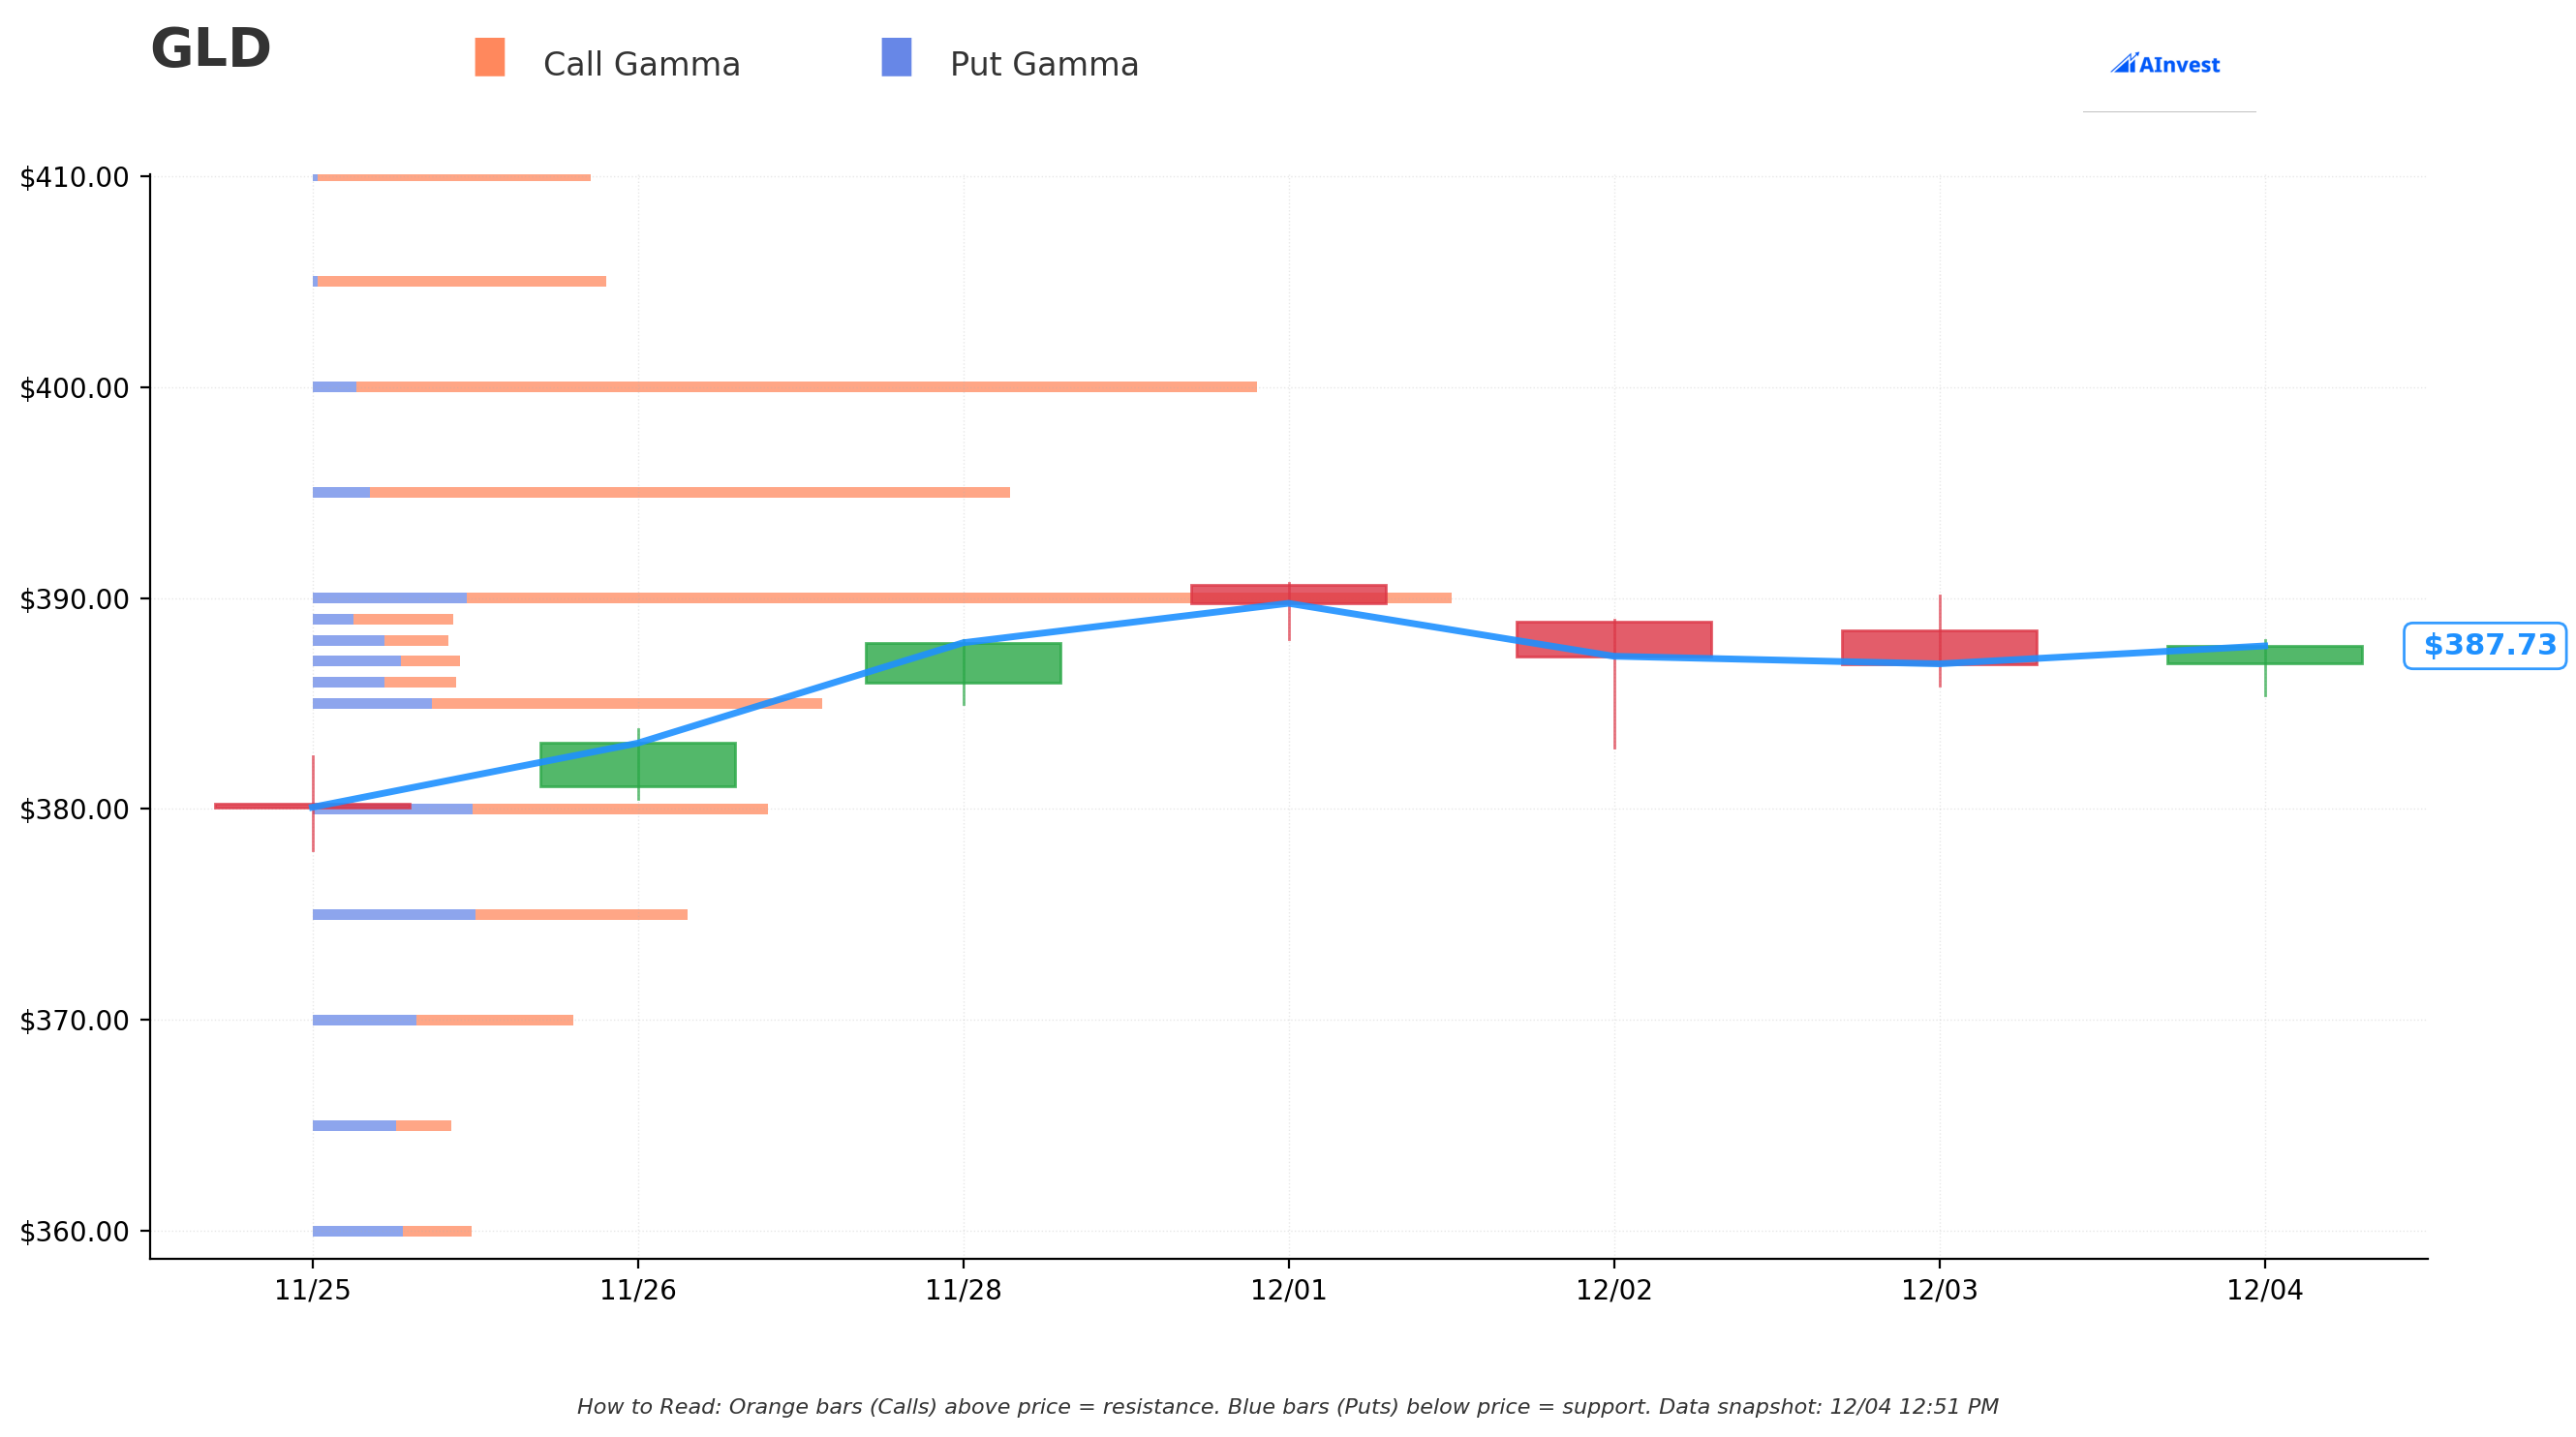
Current Price: $387.69
The gamma exposure map reveals critical price magnets where options market positioning creates natural support and resistance:
🔵 Support Levels (Put Gamma Below Price):
- $385 - Immediate support with 89.4M total gamma (47.4M net call gamma dominance - STRONG FLOOR!)
- $380 - Secondary support at 80.1M gamma (23.7M net) - dealers will defend this aggressively
- $375 - Deeper support zone with 65.9M gamma (8.8M net) - major accumulation area
🟠 Resistance Levels (Call Gamma Above Price):
- $390 - Immediate ceiling with 199.9M gamma (145.6M net - STRONGEST RESISTANCE!)
- $395 - Secondary resistance at 122.4M gamma (102.2M net)
- $400 - MAJOR TARGET STRIKE with 165.7M gamma (150.1M net) - this is where the bull call spread buyer is positioned!
- $405 - Extended resistance at 51.7M gamma (49.7M net)
- $410 - Upper band at 48.8M gamma
- $415 - SPREAD CAP STRIKE with 58.7M gamma (56.8M net) - the profit target!
- $420 - Extended target at 53.7M gamma if momentum continues
What this means for traders: GLD is sandwiched between strong $385 support and massive $390 resistance. The gamma data shows market makers holding ENORMOUS positions at $390 (199.9M - the single largest level by far) which creates natural selling pressure as price approaches. This is the first hurdle to clear.
Critical insight for the bull call spread: Notice the progression from $390 (199.9M gamma) → $395 (122.4M) → $400 (165.7M) → $415 (58.7M). The resistance gets LIGHTER as you move higher, except for the $400 level which has heavy gamma from this very trade! The path from $395 to $415 is actually more clear than the path from $388 to $395. This suggests if GLD can punch through $390-395, it could run quickly to $400-415.
The bull call spread buyer's thesis: They're betting GLD breaks the $390 wall in the next 2-3 weeks (likely on Fed/inflation news), consolidates briefly at $400 (their long strike), then potentially runs to $415 (their short strike) by January 16th expiration. The risk/reward makes sense: $3.35 risk for up to $11.65 reward = 3.5:1 profit potential.
Net GEX Bias: Bullish (1,195M call gamma vs 363M put gamma = 3.3:1 ratio) - Overall positioning remains heavily bullish with call gamma dominating at every level above current price. This creates "gravity" pulling prices higher as dealers hedge their short call exposure.
Implied Move Analysis
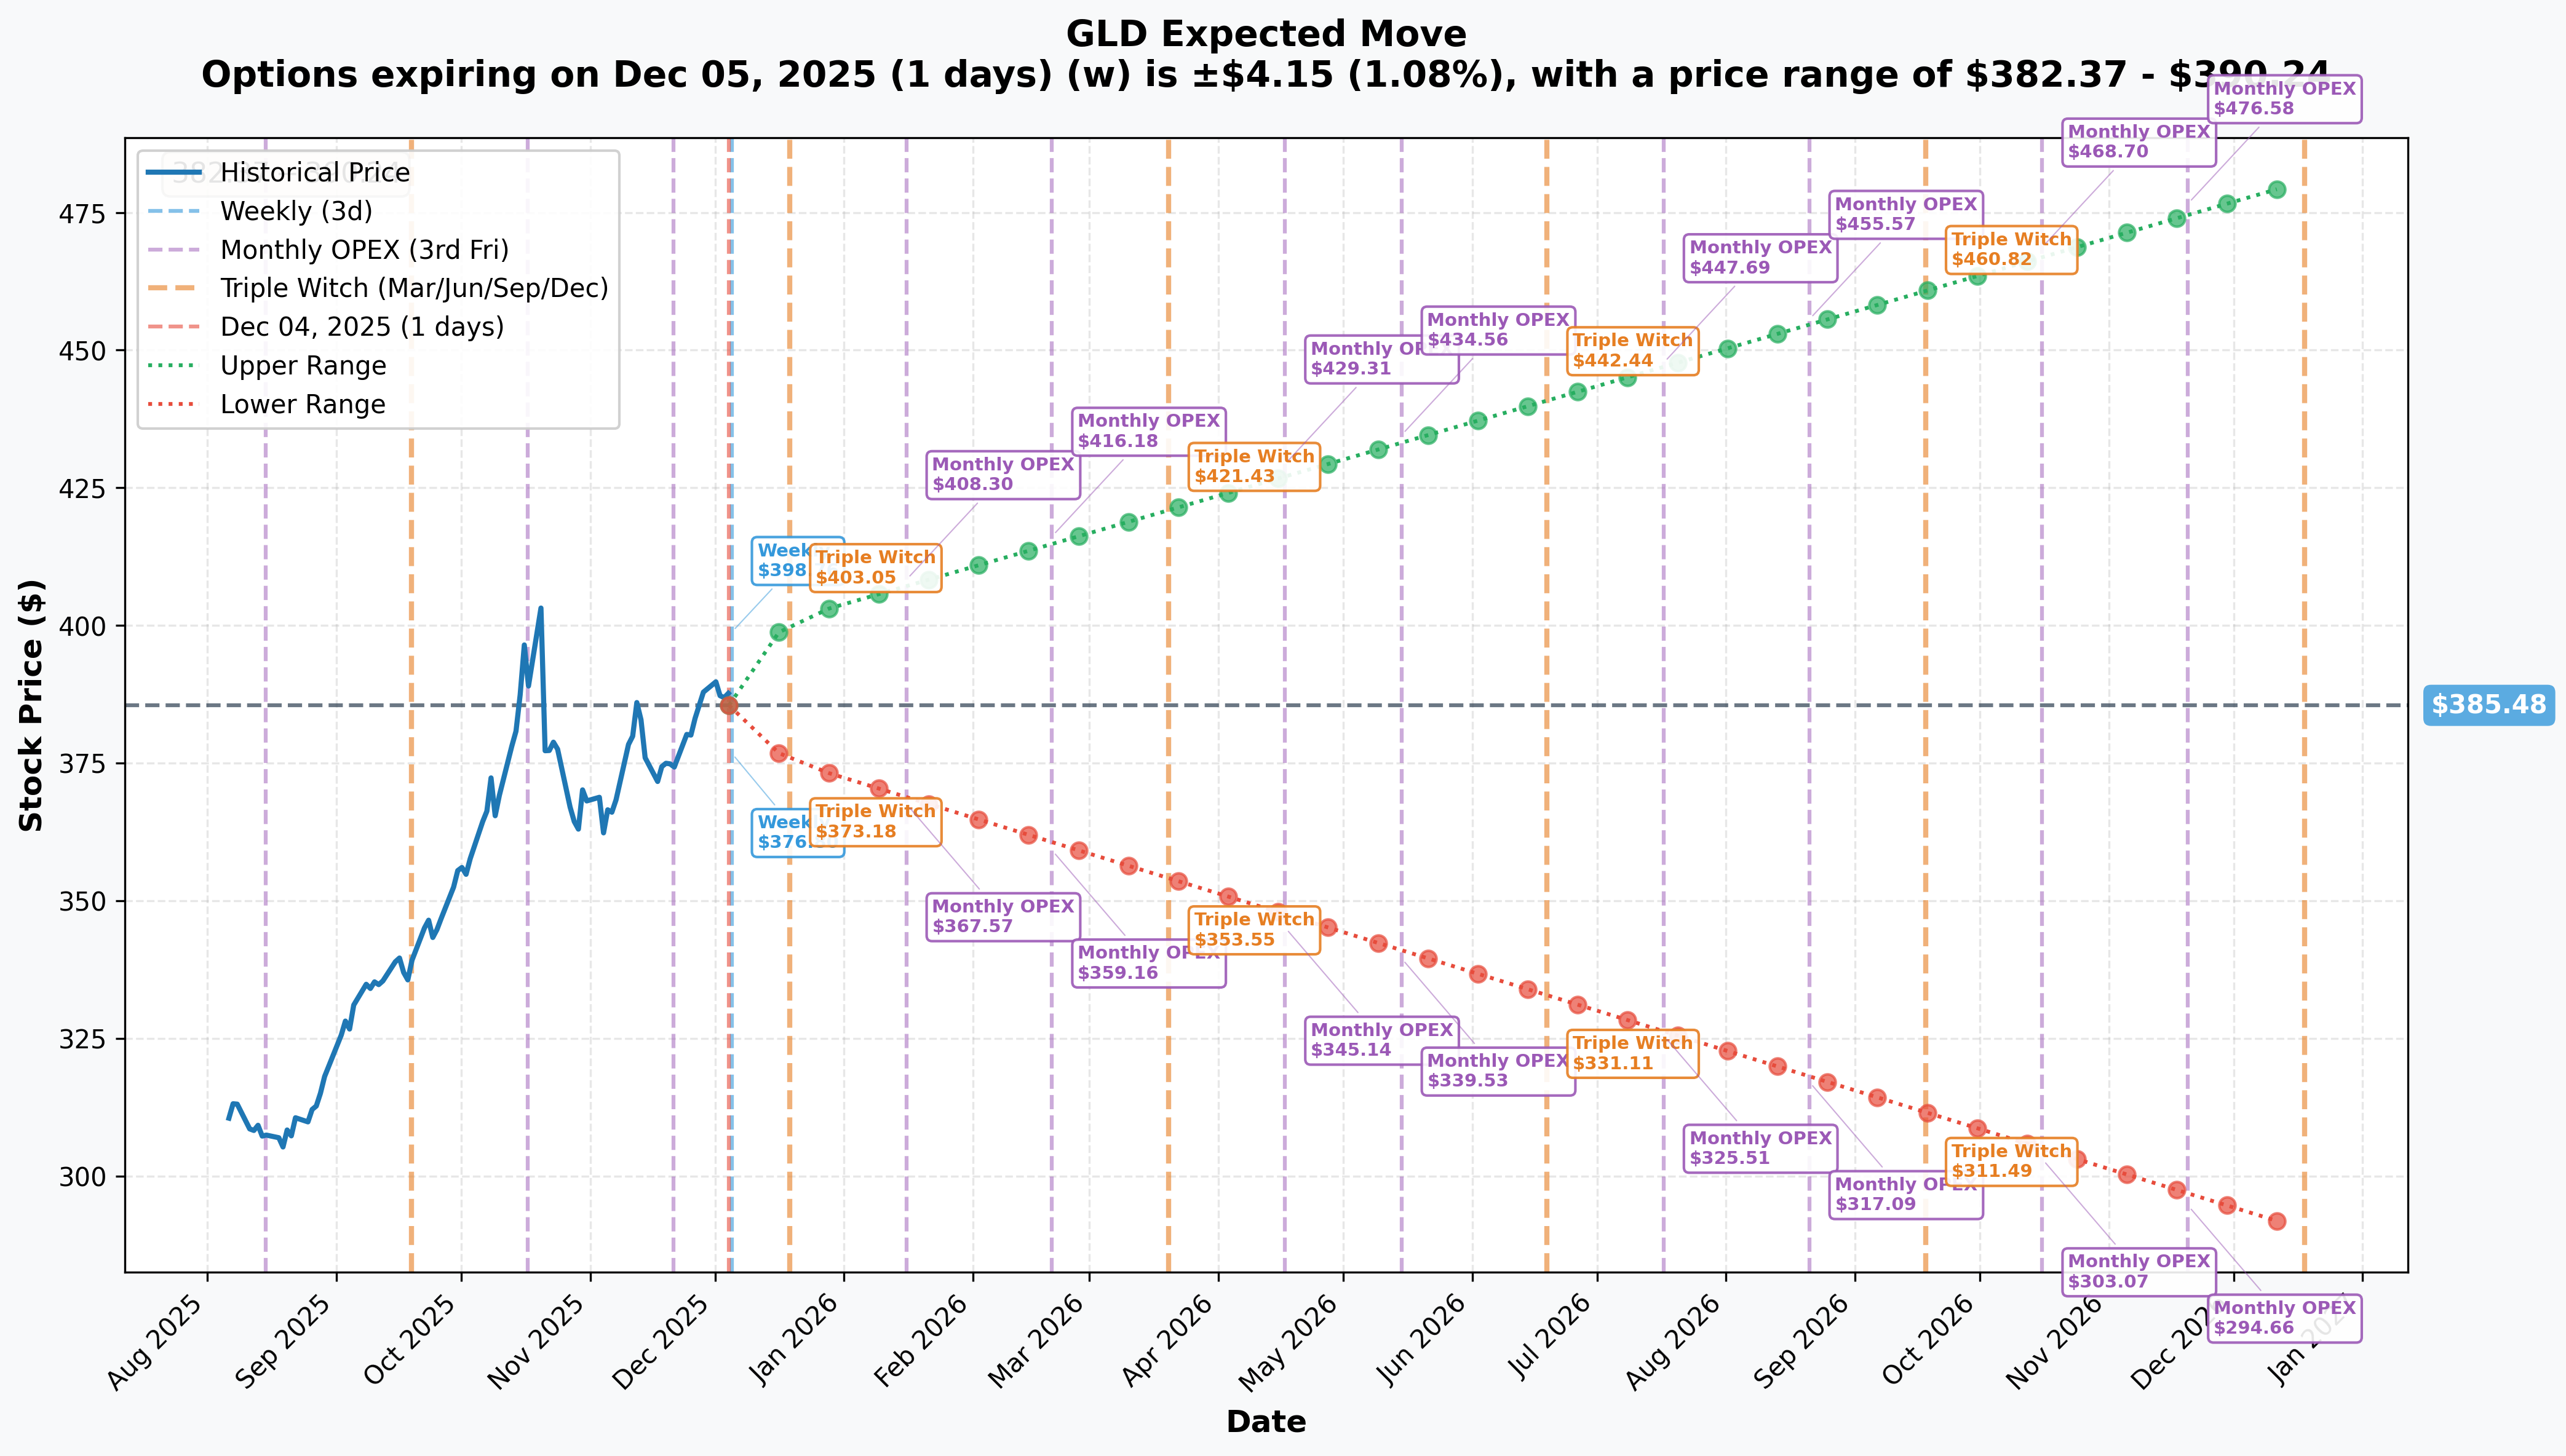
Options market pricing for upcoming expirations:
- 📅 Weekly (Dec 5 - 1 day): ±$4.15 (±1.08%) → Range: $382.37 - $390.24
- 📅 Monthly OPEX (Dec 19 - 15 days): ±$12.01 (±3.11%) → Range: $375.28 - $401.08
- 📅 January OPEX (Jan 16 - 43 days - THIS TRADE!): ±$20.43 (±5.3%) → Range: $367.57 - $408.30
- 📅 Quarterly Triple Witch (Dec 19 - 15 days): ±$12.01 (±3.11%) → Range: $375.28 - $401.08
- 📅 Yearly LEAPS (Dec 18, 2026 - 379 days): ±$95.26 (±24.71%) → Range: $290.22 - $480.74
Translation for regular folks: Options traders are pricing in a 1% move ($4) by tomorrow for weekly expiration, but a much larger 3.1% move ($12) through December OPEX on December 19th. By January 16th expiration (when this bull call spread expires), the market expects a 5.3% move ($20) in either direction.
Here's what's CRITICAL: The implied move upper range for January 16th is $408.30 - which is ABOVE the $400 long strike and very close to the $415 short strike! The options market is essentially saying there's a real chance GLD trades in the $400-408 range by expiration, which would make this bull call spread highly profitable.
Probability math:
- Probability GLD ≥ $403.35 (breakeven): ~35-40% based on implied volatility
- Probability GLD ≥ $400 (long strike): ~42-45%
- Probability GLD ≥ $415 (max profit): ~20-25%
The bull call spread buyer is making a bet that has roughly 35-40% probability of profit, but when it hits, it delivers 3.5:1 returns. That's actually solid institutional risk/reward - you don't need 50%+ odds when your winners pay 3-4x your losers.
Key catalyst timing: All the major economic events fall WITHIN the 43-day window to expiration:
- December 19th monthly OPEX (potential volatility/gamma squeeze)
- January 10th NFP report (December data)
- January 28-29 FOMC meeting - AFTER this position expires but close enough to influence GLD price action
🎪 Catalysts
🔥 Immediate Catalysts (Already Happened - Last 3 Months)
December 17-18, 2024 FOMC Rate Cut 📊
The Federal Reserve cut rates by 25 basis points to 4.25%-4.50% at the December 2024 meeting, marking the third consecutive cut and bringing total 2024 easing to 100 basis points. However, the Fed's dot plot signaled more hawkish forward guidance with only two cuts projected for 2025 (vs prior expectations of three-four).
Gold's reaction: Gold initially declined on the hawkish surprise as the reduced 2025 cut expectations increased opportunity costs for holding non-yielding assets. However, the metal remained resilient above $385-387 as other structural drivers (central bank buying, geopolitics) provided support.
What this means for the trade: The Fed's cautious stance removes some near-term tailwind but keeps 2025 cuts in play. Two cuts = 50bps easing = still bullish for gold medium-term.
Central Bank Buying Acceleration - Record 2024 🏦
Central banks purchased 1,045 tonnes of gold in 2024 - the third consecutive year exceeding 1,000 tonnes and nearly double the 2014-2016 pace. This represents structural demand that didn't exist in prior cycles.
Key buyers in Q4 2024:
- Poland: Largest buyer with 90 tonnes added in 2024, bringing reserves to 448 tonnes (17% of total reserves)
- Turkey: Added 75 tonnes during the year
- India: RBI purchased 73 tonnes - more than 4x the 2023 level
- China: After six-month pause (May-Oct 2024), PBOC resumed purchases in November with 5 tonnes, followed by 10 tonnes in December
Why this matters: Morgan Stanley projects 900 tonnes of central bank buying in 2025 - below 2024 pace but still historically elevated. This creates a "structural bid" that provides downside protection for gold prices.
Geopolitical Safe-Haven Surge 🌍
Q4 2024 saw multiple geopolitical flashpoints driving gold's safe-haven appeal:
- November 17, 2024: US authorized Ukraine to use ATACMS missiles for strikes into Russia
- Late November/Early December: Resurgence of Syrian civil war and South Korea martial law crisis
- October 30, 2024: Gold hit record high of $2,785.40 amid Middle East tensions
World Gold Council analysis concluded gold has been "an ideal hedge against unpredictable geopolitical shocks" - every spike in tension correlated with ETF inflows.
Trump Tariff Policy Uncertainty 💼
President Trump announced 10% baseline tariff on all imports with 34% on China and 20% on EU. Gold initially spiked 3% from $3,290 to $3,398 in August 2025 when US Customs ruled gold bars from Switzerland would face 39% tariffs, before Trump clarified "Gold will not be Tariffed!"
Impact: Even after clarification, the episode demonstrated gold's sensitivity to trade policy. "Tariffs raise prices and act as a tax on the domestic consumer", creating stagflation conditions that support gold as inflation hedge.
November-December Inflation Data 📊
November 2024 CPI: 2.7% YoY (up from 2.6%) with 0.3% monthly increase. Core CPI held at 3.3% annually.
December 2024 CPI: 2.9% YoY (up from 2.7%) with 0.4% monthly increase - energy prices rose 2.6% M/M accounting for 40%+ of the monthly increase.
Gold's reaction: Sticky inflation supports case for gold as inflation hedge, but also reduces Fed's urgency to cut rates aggressively. Mixed signal but overall supportive.
🚀 Upcoming Catalysts (Next 6 Weeks - THIS TRADE WINDOW!)
January 28-29, 2025 FOMC Meeting 📅
Date: January 28-29, 2025 (Statement 2:00 PM ET on Jan 29)
What happened: The Fed held rates steady at 4.25%-4.50% at this first 2025 meeting, noting "economic activity has continued to expand at a solid pace" and "inflation remains somewhat elevated."
Market implications for gold:
- ⚖️ No immediate cut but door open for March/later - neutral short-term
- 💰 Holding restrictive rates longer increases opportunity cost for gold but...
- 🛡️ ...Fed's cautious tone signals ongoing uncertainty supporting safe-haven demand
- 📊 Markets will focus on Powell press conference language about 2025 path
- 🎯 Any dovish hints about resuming cuts in Q2 = bullish for gold
Critical for this trade: The January 16th expiration falls 12 days BEFORE this FOMC meeting, but markets will start positioning 1-2 weeks ahead. If gold rallies into the meeting on dovish expectations, the bull call spread benefits. However, if Fed signals "higher for longer," gold could stall at $395-400 resistance.
January 10, 2025 NFP Report (December 2024 Data) 💼
Expected jobs added: 154,000 vs November's 227,000. Expected unemployment: 4.2% (unchanged).
Why this matters: NFP data generally negatively correlated with gold. Weaker-than-expected jobs = Fed more likely to cut rates = bullish for gold. Stronger jobs = Fed stays restrictive = gold headwind.
Scenario for bull call spread:
- 📉 Soft NFP (<130k jobs) = Gold rally toward $395-400 as rate cut odds increase
- 📈 Strong NFP (>180k jobs) = Gold pullback to $380-385 as "no landing" narrative strengthens
Early January CPI Release (December 2024 Data) 📊
Scheduled for second week of January (typically released 12-15th). Market expects inflation continuing to moderate but remaining above Fed's 2% target.
Gold reaction sensitivity:
- ✅ If inflation trends lower than expected, could bolster expectations for further rate cuts
- ❌ Any upside surprise in CPI could lead to renewed dollar strength and pressure on gold
China Central Bank Gold Buying - Monthly Updates 🇨🇳
After resuming purchases in November (5 tonnes) and December (10 tonnes) 2024, market watching for January 2025 data (released early February but builds into price action before).
China's official holdings now at 2,280 tonnes (5.5% of total foreign reserves) - suggesting room for substantial further accumulation.
Bull case: Continued Chinese buying (15-20 tonnes/month pace) provides structural bid under gold prices and signals to other central banks. This would support $400+ pricing.
Bear case: If China pauses again (like May-Oct 2024), removes key marginal buyer and could pressure gold back to $370-380 range.
December 19, 2025 Monthly OPEX (Gamma Positioning) 🎲
Monthly options expiration creates potential for gamma squeeze dynamics as dealers rehedge massive option positions:
- Heavy call gamma at $390-400 means dealers are SHORT calls and must buy gold as it rallies
- This creates positive feedback loop accelerating moves through resistance
- Conversely, if gold falls, gamma works in reverse (dealers sell into weakness)
For this bull call spread: The Dec 19 OPEX falls 28 days before the Jan 16 expiration. If GLD rallies through $390-395 on Dec 19 gamma squeeze, it sets up well for the $400-415 target by Jan 16.
🎲 Price Targets & Probabilities
Using gamma levels, implied move data, and catalyst timing, here are the scenarios through January 16th expiration:
📈 Bull Case (40% probability)
Target: $410-$420 (Maximum Profit Zone)
How we get there:
- 💪 January FOMC (Jan 28-29) messaging turns dovish - Powell hints at March rate cut resumption
- 📉 Soft NFP report (Jan 10) showing <140k jobs = Fed rate cut odds spike
- 📊 December CPI shows continued cooling to 2.5-2.6% YoY = inflation progress confirmed
- 🇨🇳 China PBOC accelerates gold purchases to 15-20 tonnes/month in January
- 🌍 Geopolitical escalation (Ukraine, Middle East, Taiwan) = safe-haven bid
- 💥 Goldman Sachs $3,700 2025 target gains traction with institutional flows
- 📈 Technical breakout: GLD clears $390 resistance → triggers gamma squeeze → accelerates to $400 → momentum carries to $410-415
Key gamma levels as milestones:
- Clear $390 (199.9M gamma wall) - THIS IS THE KEY!
- Quick move to $395 (122.4M gamma)
- Test $400 (165.7M gamma + psychological level)
- Run to $415 (58.7M gamma - lighter resistance)
Bull call spread P&L:
- GLD at $405: Spread worth $5.00, profit = $1.65 × 113,670 = $18.8M gain (49% ROI)
- GLD at $410: Spread worth $10.00, profit = $6.65 × 113,670 = $75.6M gain (199% ROI)
- GLD at $415+: Spread worth $15.00 (max), profit = $11.65 × 113,670 = $132.4M gain (348% ROI!)
Why 40% probability: Requires multiple catalysts aligning (dovish Fed + weak jobs + continued central bank buying) but not unrealistic. Gold already broke out to $403 in October, so $400-415 is only 5-10% higher. The structural tailwinds (central bank demand, geopolitical risk) remain intact. Main risk is Fed staying hawkish longer.
🎯 Base Case (40% probability)
Target: $390-$405 (Partial Profit Zone)
Most likely scenario:
- ⚖️ January FOMC maintains "patient" stance - no immediate cut but door open for H1 2025
- 📊 Economic data mixed - NFP moderate (150-160k), inflation sticky at 2.7-2.9%
- 🇨🇳 China buying continues but moderate pace (5-10 tonnes/month)
- 💰 Gold consolidates in $385-400 range for most of January, then breaks higher late in period
- 📈 GLD grinds through $390 resistance → reaches $395-403 by Jan 16th expiration
- 🤝 Morgan Stanley $3,800/oz target provides upside case but timing extends to Q2 2025
- 🎢 Implied move upper range ($408) proves roughly accurate
Critical path: The base case assumes GLD breaks through the massive $390 gamma wall (likely on FOMC positioning into Jan 28-29 meeting) but doesn't have enough momentum to reach $415 by Jan 16. The spread expires somewhere between $400-408, delivering partial but meaningful profits.
Bull call spread P&L:
- GLD at $395: Spread worth $0 (both legs OTM), loss = -$3.35 × 113,670 = -$38.1M loss (100% loss)
- GLD at $400: Spread worth $0 (at long strike), loss = -$3.35 × 113,670 = -$38.1M loss (100% loss)
- GLD at $403.35: Spread worth $3.35 (BREAKEVEN) = $0 profit/loss
- GLD at $405: Spread worth $5.00, profit = $1.65 × 113,670 = $18.8M gain (49% ROI)
Why 40% probability: This is the "almost there but not quite" scenario. Gold's structural bid from 1,045 tonnes central bank buying and geopolitical premium should support move to $395-405 range. However, reaching $415 in just 43 days requires acceleration. The trader likely sized this knowing partial profit scenarios ($400-410 range) are most probable.
Key insight: Notice the spread buyer structured at $400/$415 strikes rather than $390/$405 or $395/$410. This suggests they expect GLD to reach $400+ but are unsure about $415. By selling the $415 call, they reduce cost by 46% ($6.16 → $3.35) making the trade profitable even if only reaching $403-410 range.
📉 Bear Case (20% probability)
Target: $370-$390 (Total Loss)
What could go wrong:
- 😰 January FOMC turns more hawkish - Powell pushes back on rate cut timeline, projects rates above 4% through 2025
- 📈 Strong NFP report (180k+ jobs) + rising wage growth = "no landing" scenario = Fed stays restrictive
- 💵 US dollar surges on economic outperformance vs Europe/China = gold sells off
- 🇨🇳 China pauses gold purchases again (like May-Oct 2024) = removes marginal buyer
- 🌍 Geopolitical de-escalation (Ukraine ceasefire talks, Middle East calm) = safe-haven premium evaporates
- 📊 Physical gold demand destruction - jewelry sector (already down 11% in 2024) weakens further on high prices
- 💰 Gold ETF outflows accelerate (like November-December 2024 when 36 tonnes flowed out)
- 🔨 Technical breakdown: GLD breaks below $385 support → cascade to $380 → $375
Critical support levels (from gamma analysis):
- 🛡️ $385: Immediate floor (89.4M gamma) - MUST HOLD for bullish thesis
- 🛡️ $380: Major support (80.1M gamma) - break here = bearish momentum shift
- 🛡️ $375: Deep support (65.9M gamma) - disaster scenario
Bull call spread P&L in Bear Case:
- GLD at $390: Both legs expire worthless, loss = -$3.35 × 113,670 = -$38.1M loss (100% loss)
- GLD at $380: Both legs expire worthless, loss = -$3.35 × 113,670 = -$38.1M loss (100% loss)
- GLD at $370: Both legs expire worthless, loss = -$3.35 × 113,670 = -$38.1M loss (100% loss)
Why only 20% probability: Requires multiple bearish catalysts to align AND ignore the structural bid from central bank buying. Even if Fed stays hawkish, Goldman Sachs $3,300-3,700 targets and Morgan Stanley $3,800 target suggest institutional conviction for higher prices. Gold would need to break technical support at $385-380 AND ignore central bank demand to fall below $390. Possible but not probable.
Defined risk advantage: Even in complete disaster scenario, the bull call spread buyer can't lose more than $38.1M (the premium paid). This is why institutions prefer spreads over naked calls - the risk is DEFINED and capped. Compare this to buying 113,670 outright calls at $6.16 = $70M at risk if gold crashes!
💡 Trading Ideas
🛡️ Conservative: Buy the Pullback to $380-385
Play: Wait for healthy correction to gamma support zone, then enter stock or LEAPS
Why this works:
- 📊 Gold up 57.94% YTD - a 3-5% pullback to $380-385 would be NORMAL and HEALTHY
- 🛡️ Gamma analysis shows massive put support at $385 (89.4M) and $380 (80.1M)
- 💰 Better entry price means margin of safety if Fed disappoints on rate cuts
- ⏰ Plenty of time for 2025 catalysts to play out - no need to chase at $388
- 📈 Goldman Sachs $3,700/oz target = $430 GLD (11% upside from $385)
- 🇨🇳 Structural demand from central banks limits downside below $375
Action plan:
- 👀 Set alerts for GLD at $385 and $380
- 🎯 If GLD pulls back to $380-385, BUY stock or Jun/Dec 2026 LEAPS
- 📊 Position size: 5-10% of portfolio (core long-term holding)
- ✅ Confirmation signals: Volume spike at support, RSI oversold (<30), positive central bank news
- ❌ Avoid if break below $375 (invalidates support thesis)
Stock entry ($380):
- 💰 Buy 100-500 shares GLD at $380 = $38,000-$190,000 investment
- 🎯 Target: $420-430 by year-end 2025 (10-13% return)
- 🛡️ Stop loss: $365 (4% below major support)
LEAPS entry (more capital efficient):
- 💰 Buy Dec 2026 $380 calls at ~$25-28 = $2,500-$2,800 per contract
- 🎯 Target: Sell at $50-60 if GLD reaches $420-430 (100-125% return)
- 📈 Delta: ~0.65-0.70 (moves $0.65-$0.70 for every $1 move in GLD)
- ⏰ Two full years for thesis to play out
Risk level: Low-Moderate (buying support, long timeframe) | Skill level: Beginner
Expected outcome: Even if timing not perfect, Morgan Stanley expects gold to "add more gains by end of 2026" so any entry $380-390 should profit long-term.
⚖️ Balanced: Mini Bull Call Spread (Copy the Whale)
Play: Replicate the institutional trade structure at smaller size
Structure: Buy Jan 2026 $395 calls, Sell Jan 2026 $410 calls - same expiration but strikes adjusted for current price
Why this works:
- 🤝 Copying the institutional playbook but with strikes that make sense from current $388 price
- 📊 $395 call (2% OTM) likely costs ~$8-10, $410 call (6% OTM) likely ~$3-4 = net debit $5-6
- 💰 $15 wide spread - $5.50 cost = $9.50 max profit per spread (173% ROI)
- 🎯 Breakeven: $395 + $5.50 = $400.50 (3.2% above current - matches implied move)
- ⏰ 43 days to expiration = captures all January catalysts
- 🛡️ Defined risk: Max loss = $5.50 per spread ($550 per contract)
Entry criteria:
- ✅ Enter if GLD consolidates $385-390 in next 1-2 weeks
- ✅ Ensure bid-ask spread tight (<$0.20 on each leg)
- ✅ Target 5-10 contracts = $2,750-$5,500 total risk (size appropriately!)
- ⏰ Best entry: After December 19 OPEX volatility settles
Estimated P&L:
- 💰 Cost: $5.50 per spread × 10 contracts = $5,500 total risk
- 📈 GLD at $405: Spread worth $10.00, profit = $4,500 (82% ROI)
- 🚀 GLD at $410+: Spread worth $15.00 (max), profit = $9,500 (173% ROI)
- 📉 GLD below $395: Total loss = $5,500 (100% loss but DEFINED)
Management rules:
- 🎯 Take profit at 100%+ return (spread worth $11+) - don't be greedy!
- 🔄 If GLD hits $400 by Jan 5-10, consider rolling up strikes to capture more upside
- ❌ Cut loss at 50% if GLD breaks below $380 by late December (only lose $2,750 not full $5,500)
- ⏰ Don't hold to expiration - close 3-5 days before (avoid pin risk)
Position sizing: Risk only 1-3% of portfolio max - this is defined-risk speculation, not core holding
Risk level: Moderate (defined max loss, directional trade) | Skill level: Intermediate
Why this beats buying calls outright:
- Buying Jan $395 calls alone costs $8-10 = $800-$1,000 per contract × 10 = $8,000-$10,000 at risk
- Adding short $410 call reduces cost by 40% ($8 → $5.50) while only capping upside at $410 (still 6% above current)
- Better risk/reward: 173% max return on $5,500 risk vs 100% return on $8,000 risk for outright calls
🚀 Aggressive: 0DTE Gamma Scalping (EXPERT ONLY!)
Play: Trade weekly options around $390 gamma wall for quick 10-20% profits
Structure: Buy 0-2 DTE calls at $390 strike when GLD pulls back to $385-386, sell when it tests $390-391
Why this could work:
- 💥 Massive 199.9M gamma at $390 creates EXPLOSIVE price action as dealers hedge
- 📊 GLD oscillating in $385-395 range = perfect for scalping
- ⏰ Weekly options cheap (1-2% of stock price) for outsized moves
- 🎢 High volatility environment = fast profits when it moves
- 📈 Positive gamma squeeze if breaks above $390 → could rip to $395-400 in hours
Example trade (hypothetical):
- Monday morning: GLD at $386, buy 20 weekly $390 calls at $1.50 = $3,000 cost
- Tuesday afternoon: GLD spikes to $391 on NFP rumors, calls worth $3.00 = $6,000 value
- SELL immediately for $3,000 profit (100% gain in 36 hours!)
- Repeat process 2-3x per week if setups present
Why this could blow up (SERIOUS RISKS):
- ⏰ TIME DECAY KILLER: 0-2DTE options lose 30-50% per day if stock doesn't move
- 💸 Total loss possible: If GLD stays flat or dips, calls expire worthless = 100% loss
- 🎰 Gambling not investing: This is pure speculation on short-term volatility
- 📉 Whipsaw risk: GLD could fake breakout above $390 then reverse = you buy high, lose money
- 😱 Requires constant monitoring: Can't set and forget - need to watch every hour
- ⚠️ Death by 1000 cuts: Small losses (30-50%) add up quickly if wrong 3-4 times
- 🎢 Emotional discipline required: Hard to cut losses at 30-40% when hoping for comeback
CRITICAL WARNING - DO NOT attempt unless you:
- ✅ Have traded weekly options successfully for 6+ months
- ✅ Can monitor positions throughout trading day (not passive strategy)
- ✅ Have clear stop-loss discipline (cut at 30-40% loss, no exceptions)
- ✅ Understand gamma/delta/theta mechanics intimately
- ✅ Accept that 50%+ of trades may lose money (winners must be bigger)
- ✅ Only risk 0.5-1% of portfolio per trade (10-20 trades = 5-10% total portfolio risk)
- ⏰ Plan to close ALL positions by end of day (never hold 0DTE overnight)
Risk level: EXTREME (can lose 100% per trade) | Skill level: Expert only
Expected win rate: ~40-45% (winners pay 80-150%, losers lose 30-60%)
Better alternative for most traders: Just do the Balanced strategy instead. The extra returns aren't worth the stress and risk of blowing up your account.
⚠️ Risk Factors
Don't get caught by these potential landmines:
-
⏰ January FOMC binary event (Jan 28-29): This trade expires 12 days BEFORE the critical January 28-29 FOMC meeting, but markets will position 1-2 weeks ahead. If Fed turns hawkish or pushes back on rate cut timeline, gold could stall at $390-395 resistance. The Fed already cut only once in 2024 after the December meeting projection of two 2025 cuts - any further reduction in cut expectations would pressure gold. Risk: Timing doesn't capture actual meeting outcome, only positioning into it.
-
💵 Stronger US dollar could override all bullish catalysts: Gold maintains inverse correlation with USD despite some recent decoupling. Analysis notes gold has "shown perplexing behavior recently, decoupling from traditional metrics like the US dollar" but this relationship could reassert. If US economic data stays strong (labor market resilient, GDP growth 3%+) while Europe/China weaken, dollar strength could overwhelm Fed rate cut tailwind. Risk: Dollar surge to 108-110 DXY could push gold back to $370-380.
-
🇨🇳 China buying pause risk - it happened before! The PBOC paused gold purchases for six months (May-October 2024) before resuming in November. Current holdings at 2,280 tonnes (5.5% of reserves) could pause again if domestic economic pressures intensify or gold prices deemed too expensive for accumulation. China accounts for 20-30% of marginal central bank demand - removal would eliminate key structural bid. Risk: January data (released early Feb) shows zero purchases = bearish catalyst.
-
📊 Physical demand destruction at high prices continuing: Global jewelry demand fell 11% in 2024 to 1,877 tonnes due to elevated prices (average $2,386/oz, up 23% YoY). China jewelry demand particularly weak at 479 tonnes (-24% YoY) - described as "very challenging." If gold rallies to $2,800-3,000/oz ($400-430 GLD), jewelry sector could contract another 10-15%, partially offsetting investment demand. India consumption also down 5% in Q4 2024. Risk: Price-sensitive physical demand drops 15-20% more, changing supply/demand dynamics.
-
🎢 Technical overbought after 58% YTD rally - mean reversion risk: World Gold Council warned gold "may leave it facing a near-term uphill struggle as technical indicators suggest it is overbought" after the massive 2024 rally. A 10-15% correction to $330-350 range would be historically normal after doubling in 11 months. The question is WHEN, not IF, gold consolidates. Risk: Correction begins in early January before bull call spread profits, trapping position below $400 breakeven.
-
💰 Gold ETF flows turned negative in Nov-Dec 2024 warning sign: Despite price strength, global gold ETF holdings declined 36 tonnes in November-December 2024 after strong summer inflows. This suggests retail/institutional investors taking profits near highs. GLD specifically saw mixed flows. If outflows accelerate in January as investors rebalance portfolios, selling pressure could cap upside at $395-400 even with bullish catalysts. Risk: ETF outflows of 50-80 tonnes create supply overhang preventing breakout.
-
🌍 Geopolitical de-escalation removes safe-haven premium: Gold's 2024 rally partly driven by Ukraine war escalation, Middle East tensions, and South Korea martial law crisis. Any peace progress (Ukraine ceasefire talks, Israel-Hamas resolution) could remove 5-8% geopolitical risk premium from prices. Trump administration may push harder for Ukraine peace deal in early 2025. Risk: Rapid de-escalation drops gold $30-50 overnight (8-13%).
-
📊 Gamma resistance at $390 is MASSIVE: The 199.9M gamma exposure at $390 (single largest level) means market makers systematically SELL as price approaches to hedge their short call positions. This creates mechanical selling pressure making breakouts extremely difficult. Would need sustained institutional buying (think $1-2B+ per day) to punch through. The bull call spread buyer needs $390 to break - but gamma math works against them. Risk: GLD oscillates $385-395 for entire January, never breaking out to $400.
-
⏰ 43-day window may be too short for structural thesis: Goldman Sachs $3,700/oz and Morgan Stanley $3,800/oz targets are year-end 2025 projections, not January 2026. The structural tailwinds (central bank buying, Fed cuts, de-dollarization) play out over 6-12 months, not 6 weeks. This bull call spread needs $400-415 by Jan 16 - could be directionally right but too early. Risk: Gold reaches $410-420 but in March-April 2026, not January 2026. Trade expires worthless despite correct thesis.
-
💸 Implied volatility crush risk after FOMC/data: If major catalysts (NFP, CPI, FOMC) produce "in-line" results with no surprises, implied volatility could collapse 20-30% as uncertainty resolves. This would reduce call option values even if underlying GLD moves modestly higher. Example: GLD rises to $395 but IV drops from 18% to 13% = calls worth LESS than when GLD was $388 with higher IV. Risk: Volatility crush offsets price gains, spread underperforms expectations.
🎯 The Bottom Line
Real talk: Someone just spent $38 MILLION constructing a bull call spread betting that gold breaks through $400 and runs toward $415 by mid-January. This isn't a naive retail gambler - this is an institution with sophisticated models, access to flow data, and deep pockets executing a strategic directional trade.
What this trade signals:
The bull call spread structure tells us several critical things about their thesis:
-
🎯 Confident but not reckless: They're bullish enough to bet $38M but smart enough to cap upside at $415 to reduce cost 46% (from $70M to $38M). This is professional positioning.
-
⏰ Catalyst-driven timing: The 43-day window to January 16th expiration PERFECTLY captures January 10 NFP report, early January CPI data, and positioning into January 28-29 FOMC meeting. They're betting these catalysts tilt dovish.
-
📊 Technical conviction: Striking at $400/$415 shows they believe GLD clears the massive $390 gamma resistance (199.9M) and $395 secondary resistance (122.4M) to reach psychological $400 level. They're not hoping - they're modeling it.
-
🇨🇳 Structural bid confidence: The willingness to risk $38M suggests conviction that central bank buying (projected 900 tonnes in 2025) and China's resumed accumulation provide floor under prices. Even if wrong on timing, downside limited to $375-380 support.
-
💰 Asymmetric risk/reward: Risking $3.35 to make up to $11.65 (3.5:1 payoff) with 35-40% probability of profit = positive expected value. This is textbook institutional options strategy.
The bull case remains compelling:
- 📈 [Goldman Sachs $3,700/oz (GLD $430) by year-end 2025](https://www.goldmansachs.com/insights/articles/why-gold-prices-are-forecast-to-rise-to-new-record-highs) = 11% upside
- 🏦 [Morgan Stanley $3,800/oz (GLD $441) target](https://www.morganstanley.com/insights/articles/gold-price-forecast-rally-into-2026) = 14% upside
- 🇨🇳 Structural demand from 1,045 tonnes central bank buying in 2024 continuing in 2025
- ⚖️ Fed still projects two 2025 rate cuts = 50bps easing = lower opportunity cost for gold
- 🌍 Persistent geopolitical risk premium from Ukraine, Middle East, trade wars
- 📊 Technical breakout confirmed - GLD trading near all-time highs with strong support at $385-380
The bear case can't be ignored:
- 💵 Stronger USD on US economic outperformance could pressure gold back to $370-380
- 🇨🇳 China could pause gold buying again (happened May-Oct 2024)
- 📈 Fed turns more hawkish if inflation stays sticky at 2.7-3.0%
- 🎢 Technical overbought after 58% YTD rally - healthy 10% correction to $350 possible
- 📊 Physical demand destruction continuing (jewelry down 11% in 2024)
For different trader profiles:
If you own GLD stock:
- ✅ You're sitting on MASSIVE gains (+58% YTD) - congratulations!
- 📊 Consider selling covered calls at $395-400 to monetize this exact volatility trade
- 🎯 Alternatively, hold with mental stop at $375 (major gamma support)
- 💰 Take 25-40% profits at $395-400 if GLD spikes = lock in gains, reduce risk
If you're considering new positions:
- ⏰ Don't chase at $388 - wait for pullback to $380-385 gamma support for better entry
- 🎯 If you can stomach the risk, the Balanced strategy (mini bull call spread $395/$410) offers asymmetric payoff
- 🛡️ Conservative approach: Buy stock/LEAPS at $380-385 support, hold for 6-12 months targeting $430-440 on analyst forecasts
- ❌ Avoid 0DTE/weekly gamma scalping unless you're expert-level trader with time to monitor
If you're bearish:
- ⏰ Wait for GLD to test $395-400 resistance before initiating puts/spreads
- 🎯 Put spreads at $390/$380 or $385/$375 offer defined-risk way to play downside
- 📊 First support at $385 (89.4M gamma), major support at $380 (80.1M)
- ⚠️ Don't fight the structural bid - even bears should respect central bank demand floor
Mark your calendar - Critical dates:
- 📅 December 19, 2025 - Monthly OPEX (gamma positioning, potential squeeze)
- 📅 January 10, 2025 - NFP report (December data) - weak jobs = gold rally
- 📅 January 13-15, 2025 - December CPI data release (inflation trajectory critical)
- 📅 January 16, 2026 - This $38M bull call spread EXPIRES (monthly OPEX)
- 📅 January 28-29, 2025 - FOMC meeting - rate policy and forward guidance
- 📅 March 18-19, 2025 - Next FOMC with updated projections (includes dot plot)
Final verdict: The $38M institutional bull call spread is a sophisticated bet on gold's next leg higher, structured intelligently to capture upside while managing risk. The timing (43 days into FOMC/data) and strikes ($400/$415) suggest professional modeling that $390 resistance breaks in early January on dovish catalysts.
However, retail traders should resist the urge to blindly copy this trade. Instead, learn from the structure (bull call spread reduces cost while maintaining upside exposure) and wait for better entry points. GLD at $380-385 support offers 3-5% better risk/reward than current $388.
The gold bull market remains intact - central bank structural demand, Fed rate cuts, geopolitical risk, and institutional price targets $430-440 all support higher prices over 6-12 months. But in markets, timing is everything. Be patient. Let the next pullback come to you. The gold party will still be raging in February-March when entry prices are better.
Smart money is betting on $400+ gold by January 16th. But smarter money waits for $380 to maximize risk/reward. 💎
Disclaimer: Options trading involves substantial risk of loss and is not suitable for all investors. This analysis is for educational purposes only and not financial advice. Bull call spreads have defined maximum loss (premium paid) but can result in 100% loss if underlying doesn't reach breakeven. Past performance doesn't guarantee future results. The institutional $38M trade reflects their specific risk tolerance, portfolio hedging needs, and market views - not necessarily applicable to retail traders. Gold prices are volatile and subject to numerous unpredictable factors including Fed policy, geopolitical events, currency movements, and physical supply/demand dynamics. Always do your own research and consider consulting a licensed financial advisor before trading. The unusual activity scores reflect statistical outliers but do not predict future price movements or guarantee profitability.
About SPDR Gold Trust (GLD): SPDR Gold Trust (GLD) is the world's largest physical gold-backed ETF with $74 billion in assets under management, providing investors with exposure to gold bullion price movements through shares representing fractional ownership of physical gold bars stored in London vaults. The trust charges a 0.40% expense ratio and has been the primary vehicle for institutional and retail gold exposure since its 2004 inception.