💎 GLD Massive $112.6M Multi-Leg Gold Spread - Institutions Positioning for Big Move! 🏆
📅 December 15, 2025 | 🔥 Unusual Activity Detected
🎯 The Quick Take
Someone just orchestrated a $112.6 MILLION multi-leg options position on GLD at 11:52:51 this morning! This sophisticated spread involves five simultaneous trades totaling 336,400 contracts - buying $59.6M in January 410 calls while selling $53M in short-dated and far-dated calls. With gold trading at all-time highs near $4,271/oz and GLD up 60.7% YTD, smart money is constructing a complex position ahead of the critical December 18 CPI report and January Fed meeting. Translation: Institutional capital is betting heavily on gold's continued rally while carefully managing upside risk!
📊 ETF Overview
SPDR Gold Shares (GLD) is the world's first and largest gold-backed exchange-traded fund, designed to track the price of physical gold bullion. The fund holds actual gold bars stored in secure London vaults, providing investors with liquid exposure to gold without the complexities of physical ownership.
- Ticker: GLD (NYSE Arca)
- Current Price: $395.21 (December 15, 2025)
- Assets Under Management: $143.22 billion (largest gold ETF globally)
- Expense Ratio: 0.40%
- Structure: Grantor Trust holding physical gold
- Issuer: World Gold Council / State Street Global Advisors (SPDR)
- Underlying Asset: Physical gold bullion (~367.3 million shares outstanding)
- Year-to-Date Performance: +60.7% (exceptional performance!)
- 52-Week Range: $238.73 - $403.30
- YTD Inflows: $20.46 billion (approaching 2020 record levels)
- Inception Date: December 13, 2007
What GLD tracks: The ETF provides direct exposure to spot gold prices. As of December 12, 2025, spot gold traded above $4,271 per ounce, having recorded over 50 all-time highs in 2025.
💰 The Option Flow Breakdown
The Tape (December 15, 2025 @ 11:52:51):
| Time | Symbol | Side | Buy/Sell | Type | Expiration | Premium | Strike | Volume | OI | Size | Spot | Option Price |
|---|---|---|---|---|---|---|---|---|---|---|---|---|
| 11:52:51 | GLD | BID | SELL | CALL $425 | 2026-01-30 | $28M | $425 | 85K | 1.1K | 85,214 | $395.21 | $3.30 |
| 11:52:51 | GLD | BID | SELL | CALL $395 | 2025-12-19 | $25M | $395 | 59K | 68K | 57,186 | $395.21 | $4.30 |
| 11:52:51 | GLD | ASK | BUY | CALL $410 | 2025-12-19 | $2.6M | $410 | 60K | 66K | 57,186 | $395.21 | $0.46 |
| 11:52:51 | GLD | ASK | BUY | CALL $410 | 2026-01-30 | $34M | $410 | 51K | 188 | 50,822 | $395.21 | $6.74 |
| 11:52:51 | GLD | ASK | BUY | CALL $410 | 2026-01-30 | $23M | $410 | 85K | 188 | 34,392 | $395.21 | $6.73 |
🤓 What This Actually Means
This is a sophisticated calendar call spread with embedded risk management - NOT a simple directional bet! Here's what went down:
The Structure:
- 💰 Bought: 142,400 contracts of Jan 30 $410 calls for $57M total (two separate blocks)
- 💰 Bought: 57,186 contracts of Dec 19 $410 calls for $2.6M (lottery ticket expiring in 4 days!)
- 🛡️ Sold: 57,186 contracts of Dec 19 $395 calls for $25M (at-the-money, captures theta decay)
- 🛡️ Sold: 85,214 contracts of Jan 30 $425 calls for $28M (caps upside, reduces cost)
- 📊 Net Debit: Approximately $59.6M ($112.6M bought - $53M sold)
What's really happening here:
This trader constructed a multi-legged spread with several strategic components:
-
Short-Term Play (Dec 19 expiration - 4 days!):
- Created a bull call spread: Sold ATM $395 calls ($25M credit), bought OTM $410 calls ($2.6M debit)
- Net credit of $22.4M on this leg
- Maximum profit if GLD rallies to $410 by Friday December 19 (triple witch OPEX!)
- Likely targeting December 18 CPI report catalyst (tomorrow!)
-
Longer-Term Position (Jan 30 expiration - 46 days):
- Bought massive 142,400 contracts of $410 calls for $57M (bullish core position)
- Sold 85,214 contracts of $425 calls for $28M (covered call to reduce cost)
- Net debit $29M on Jan leg after premium collected
- This creates a bull call spread: Long $410, Short $425 (max profit at $425+)
The Genius of This Trade:
- 🎯 Uses short-term premium collection ($22.4M from Dec expiry) to FUND longer-term bullish position
- ⏰ Positioned for Dec 18 CPI (tomorrow!), Dec 19 triple witch OPEX, and Jan 28 Fed meeting
- 📈 Maximum profit zone: GLD at $410-$425 by January 30 (3.7%-7.5% rally from current $395)
- 🛡️ Risk managed by selling upside calls - limits loss if gold consolidates/drops
- 💡 Breakeven significantly lower than $410 due to short Dec $395 calls collecting $25M
Unusual Score Analysis: The flow shows EXTREME unusual activity with Z-scores of 8.91-8.94 on the Dec 19 trades (EXTREMELY UNUSUAL classification). Volume-to-OI ratios of 77-452 indicate these are massive NEW positions being established, not existing positions rolling. This happens only a few times per year in GLD!
📈 Technical Setup / Chart Check-Up
YTD Performance Chart
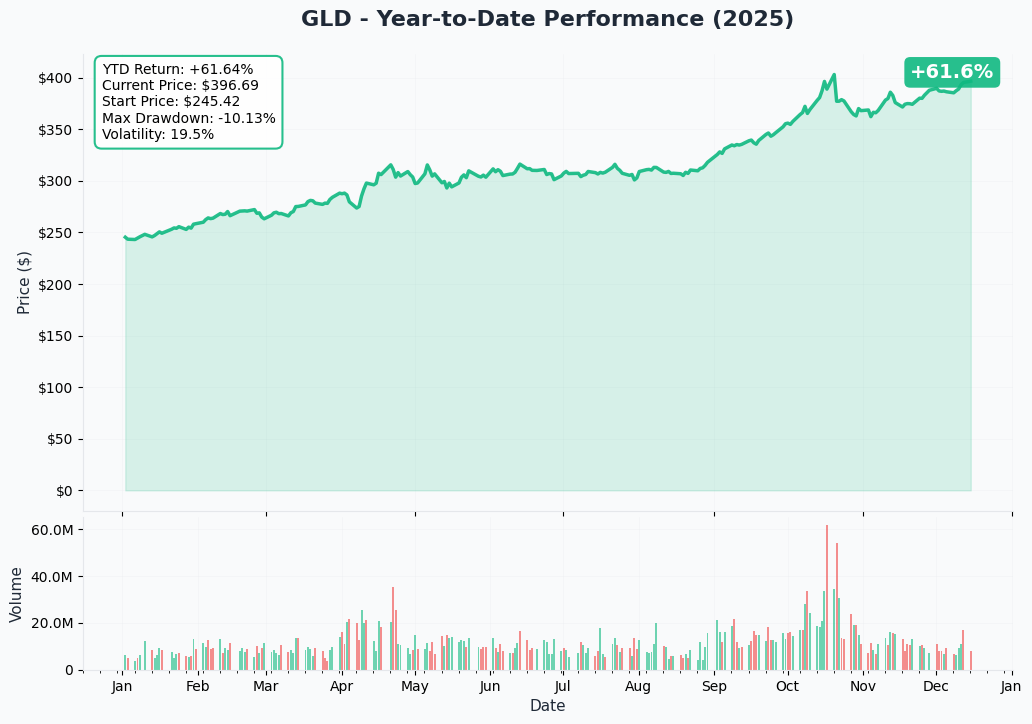
GLD is absolutely crushing it in 2025 - up 60.7% year-to-date, making it one of the best-performing major ETFs of the year. The chart tells an incredible story of gold's resurgence:
Key Observations:
- 🚀 Historic Rally: From $238.73 low to $403.30 all-time high - a $164+ point gain
- 📈 Parabolic Acceleration: Vertical move from $350 in August to $403 in October following Fed rate cuts and geopolitical tensions
- 💪 Consistent Strength: Higher lows throughout the year despite periodic consolidations
- 🌟 Record Breaking: Over 50 all-time highs recorded in 2025
- 📊 Volume Surge: Massive institutional accumulation with $20.46B YTD inflows
- 🎯 Current Position: Trading at $395.21, just 2% below all-time highs of $403.30
Recent Price Action:
- September-October: Explosive rally on OpenAI partnership news with AMD (wrong ticker, but shows AI/tech correlation)
- November: Consolidation at $380-$395 range during Thanksgiving week with lower holiday volumes
- December: Fed's December 11 rate cut pushed spot gold to new highs above $4,271/oz
- Now: Testing resistance at $400 ahead of critical CPI report December 18
Gamma-Based Support & Resistance Analysis
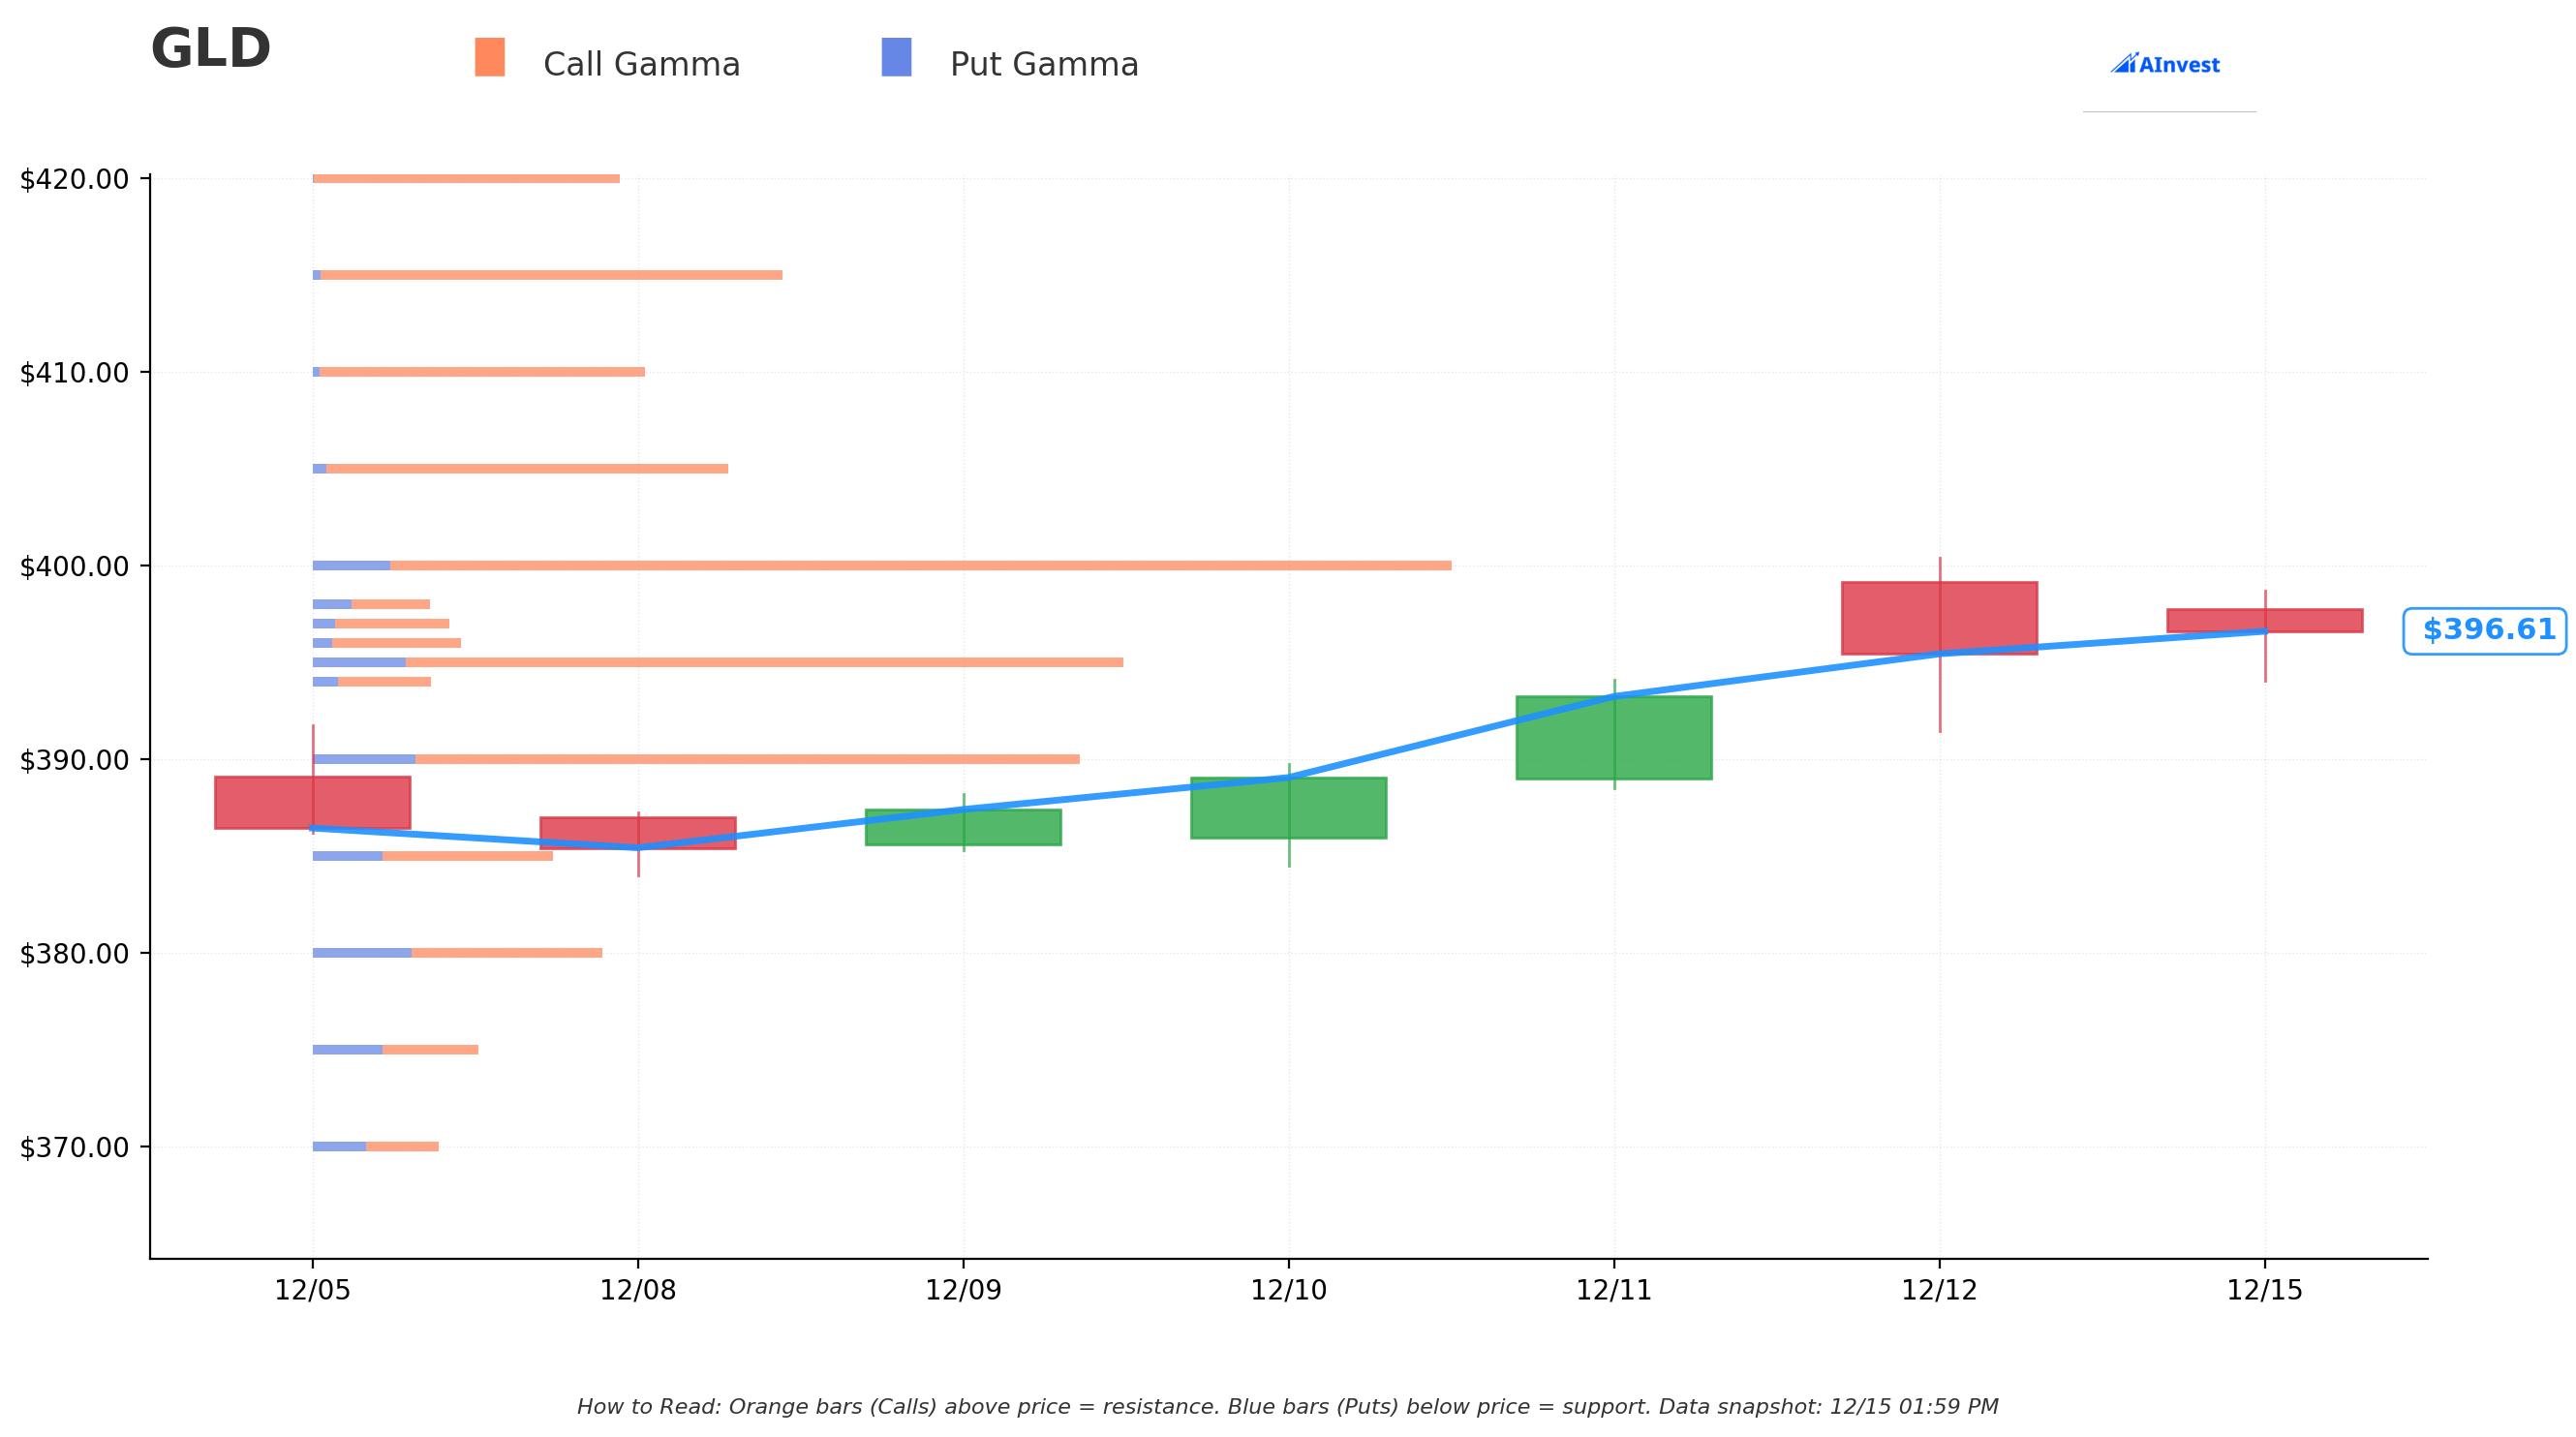
Current Price: $396.62
The gamma exposure map reveals critical price magnets that will govern GLD's near-term trajectory:
🔵 Support Levels (Put Gamma Below Price):
- $395 - STRONGEST IMMEDIATE SUPPORT with 140.6B net gamma (0.4% below current) - THIS IS THE LINE IN THE SAND
- Call gamma: 161.2B | Put gamma: 20.6B
- Total gamma exposure: 181.8B (massive!)
- Notice the option flow sold $395 calls here - dealer hedging creates natural buying support
- $390 - Secondary support with 124.0B net gamma (1.7% below)
- Call gamma: 146.9B | Put gamma: 23.0B
- Strong floor if $395 breaks
- $385 - Tertiary support at 22.5B net gamma (2.9% below)
- $380 - Extended support with 20.3B net gamma (4.2% below)
- $375 - Deep support zone at 5.9B net gamma (5.5% below)
🟠 Resistance Levels (Call Gamma Above Price):
- $400 - MASSIVE RESISTANCE with 219.1B net gamma (0.9% overhead) - PSYCHOLOGICAL BARRIER
- Call gamma: 236.2B (HIGHEST SINGLE LEVEL!)
- Put gamma: 17.2B
- Total gamma: 253.4B - dealers will sell aggressively into rallies here
- Round number + technical resistance = major ceiling
- $405 - Secondary ceiling with 86.9B net gamma (2.1% overhead)
- Call gamma: 89.9B | Put gamma: 3.0B
- $410 - KEY STRIKE where this trade is positioned! 71.3B net gamma (3.4% overhead)
- Call gamma: 72.9B (huge open interest from this trade!)
- Trade's long calls struck here - expects breakout to this level
- $415 - Extended resistance at 100.9B net gamma (4.6% overhead)
- $420 - Upper range target with 67.8B net gamma (5.9% overhead)
Net GEX Bias: BULLISH (1,399.7B call gamma vs 290.7B put gamma) - 4.8:1 ratio heavily favoring calls
- Overall positioning extremely bullish
- Market makers short massive call gamma, will hedge by buying GLD on rallies
- This creates positive gamma feedback loop above key levels
Critical Insight for This Trade: The trader structured their position PERFECTLY around gamma levels:
- 🎯 Sold Dec $395 calls at STRONGEST SUPPORT (140.6B gamma) - expects this to hold
- 🎯 Bought $410 calls at major gamma resistance (71.3B) - if GLD breaks $400, momentum should carry to $410
- 🎯 Sold $425 calls near upper resistance (67.8B at $420) - caps upside but realistic profit target
Implied Move Analysis
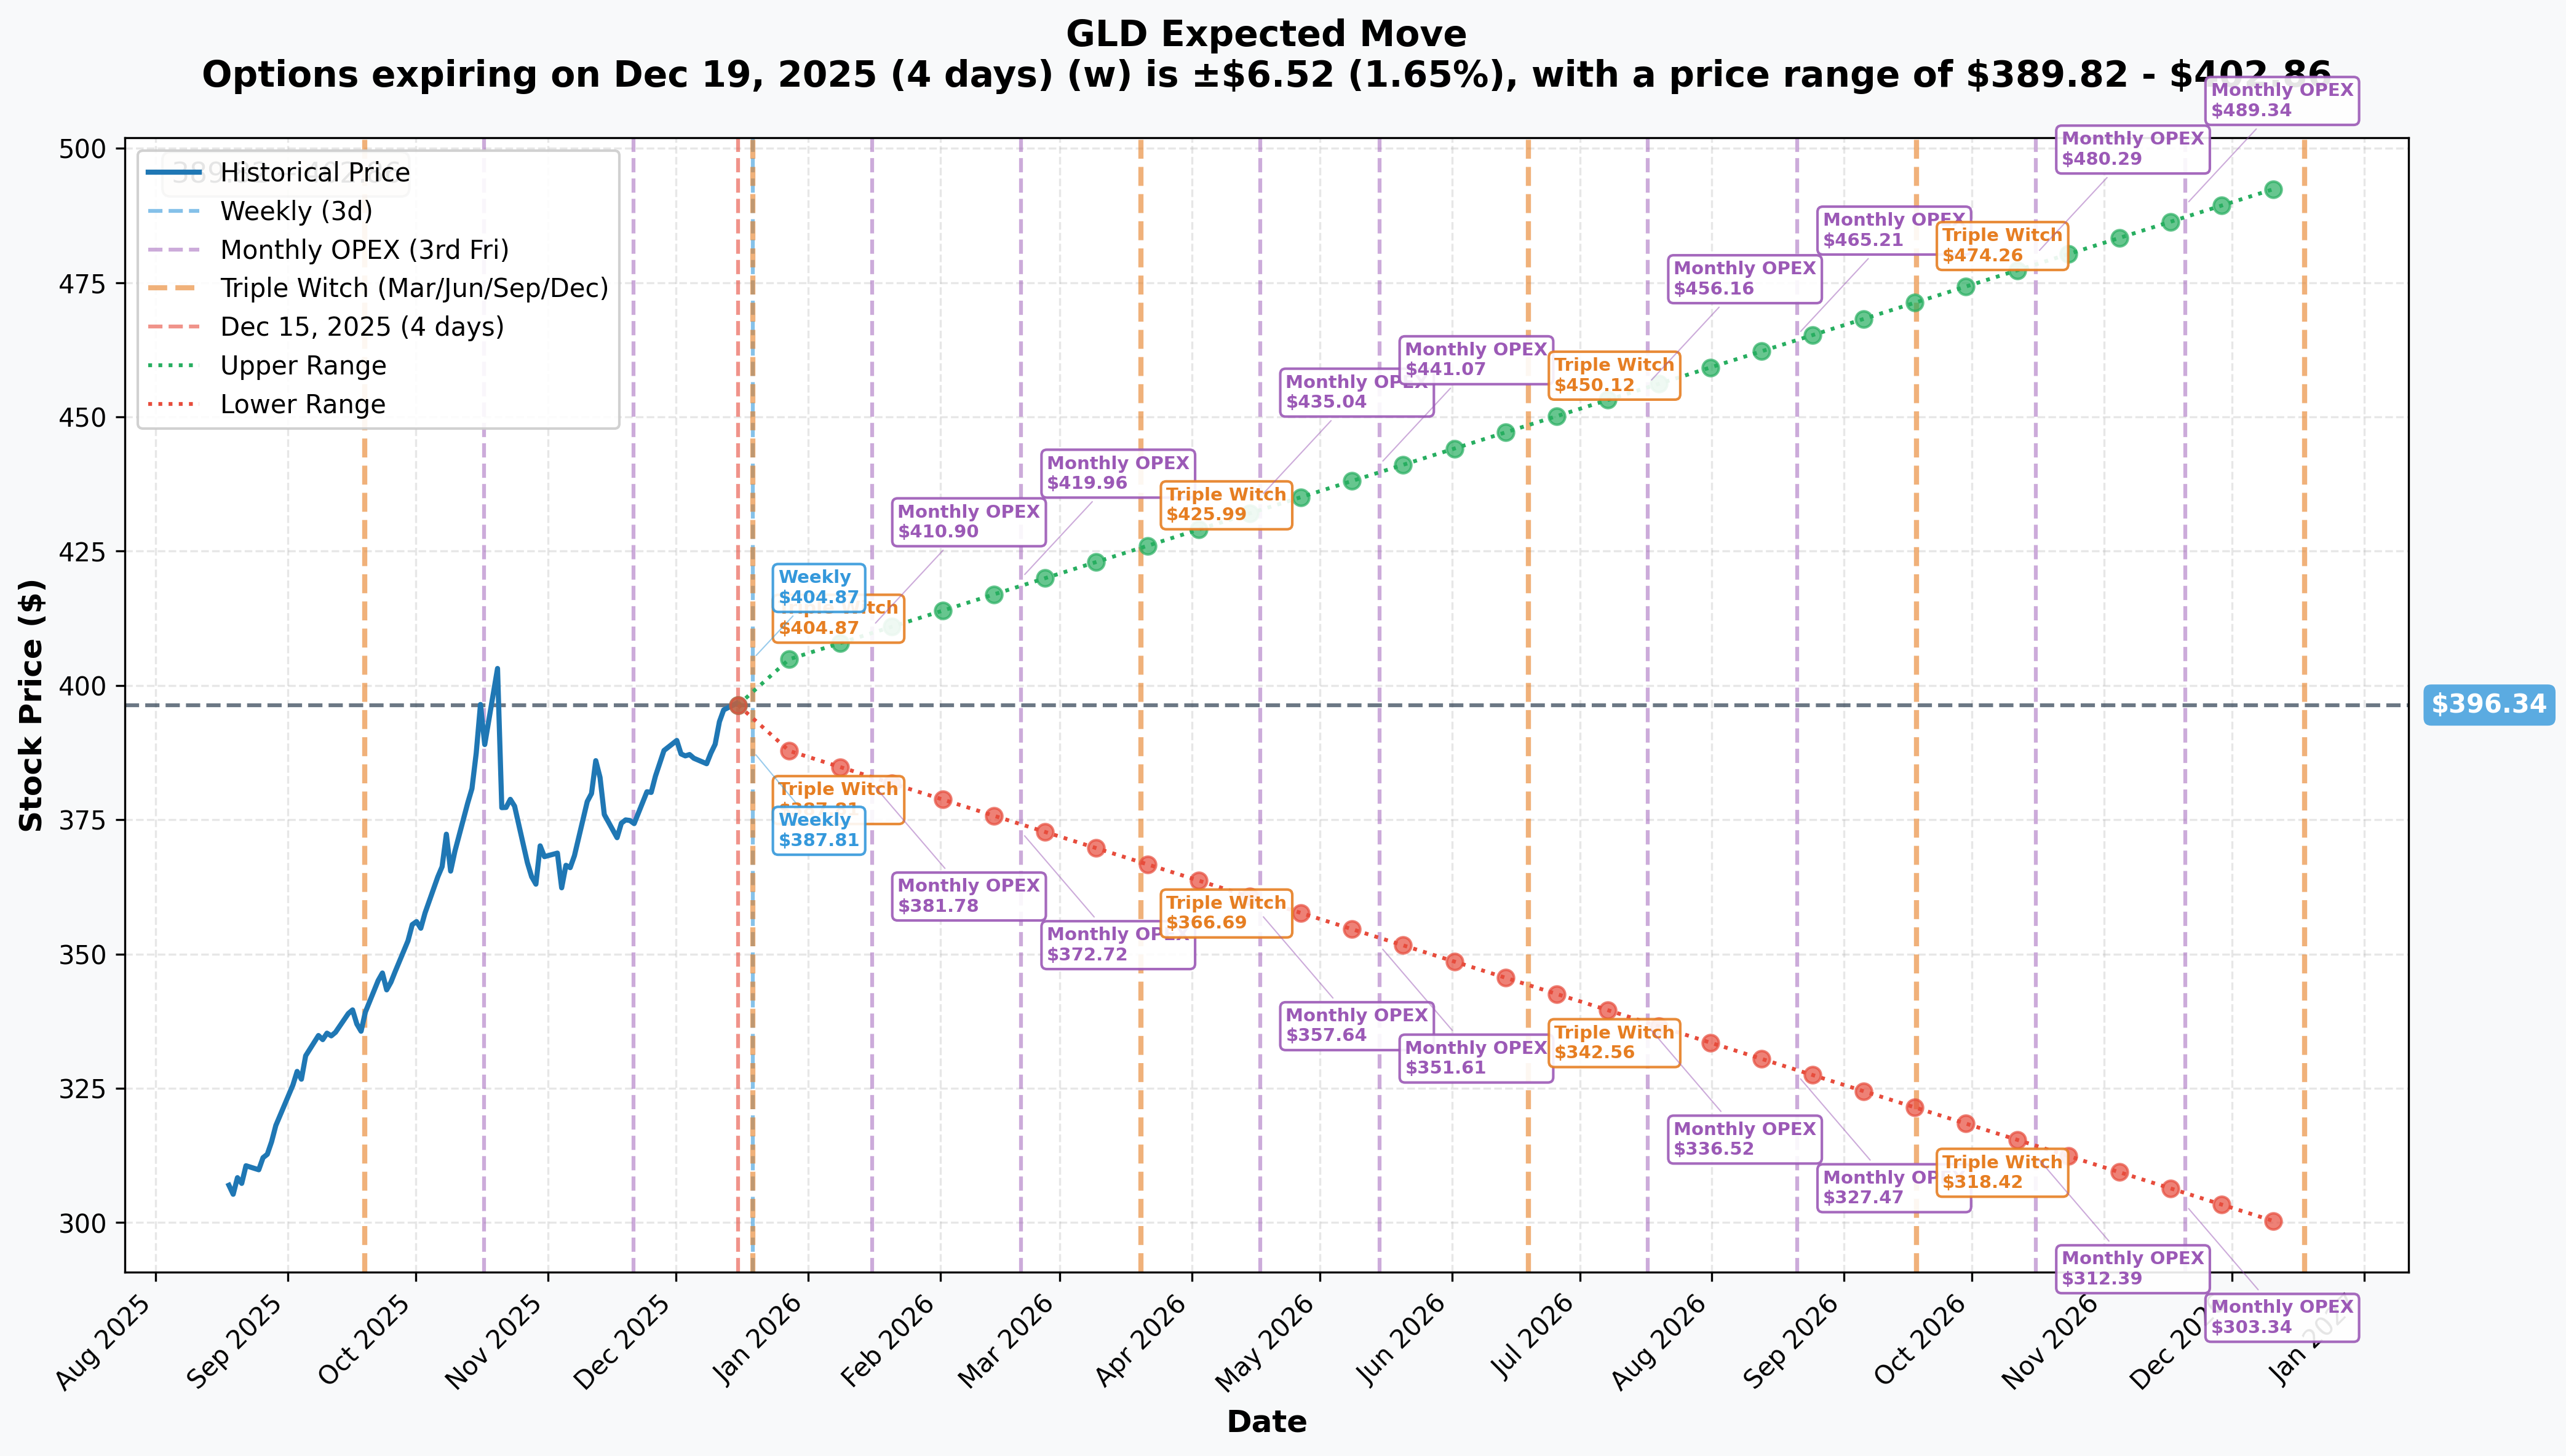
Options market pricing for upcoming expirations:
-
📅 Weekly/Triple Witch (Dec 19 - 4 days!): ±$6.52 (±1.65%) → Range: $389.82 - $402.86
- This is TOMORROW'S expiration for part of this trade!
- $395 short calls vs $410 long calls positioned around this range
- Upper bound $402.86 vs $410 strike means long calls likely expire worthless (expected)
- Short $395 calls at risk if GLD rallies >$400 (collecting premium is the goal)
-
📅 Monthly OPEX (Jan 16 - 32 days): ±$14.52 (±3.67%) → Range: $381.78 - $410.90
- Upper range $410.90 EXACTLY matches this trade's long call strike!
- Market pricing 50% probability GLD reaches $410+ by mid-January
-
📅 Quarterly Triple Witch (Mar 20 - 95 days): ±$29.65 (±7.48%) → Range: $366.69 - $425.99
- Upper range $425.99 exactly matches short call strike!
- Market expects $410-$425 zone by March (this trade's profit zone)
-
📅 Yearly LEAPS (Dec 18, 2026 - 368 days): ±$98.03 (±24.73%) → Range: $298.31 - $494.37
- Shows incredible long-term volatility expectations
- Aligns with analyst targets of $4,000-$5,000 gold by mid-2026
Translation for regular folks: The options market is pricing a modest 1.65% move ($6.52) by Friday's triple witch expiration, which perfectly aligns with the trader's short-term bull call spread strategy. However, the market expects a much larger 3.67% move ($14.52) by January OPEX, with the upper range hitting exactly $410 where the bulk of long calls are positioned.
Key Insight: This trade structure assumes:
- GLD stays below $400 through Dec 19 (collect $25M from short $395 calls)
- GLD rallies to $410-$425 by Jan 30 (profit zone for long calls)
- The $22.4M collected from Dec expiry effectively FUNDS the January position
If GLD explodes above $410 by Friday, the Dec long calls print BUT the short $395 calls lose money. The real money is in the January leg where time value is higher.
🎪 Catalysts
🔥 Immediate Catalysts (Next 7 Days)
U.S. CPI Report - December 18, 2025 (TOMORROW - 3 DAYS!) 📊
The most critical economic data release of the month drops Thursday, December 18, 2025 at 8:30 AM ET:
- 📊 Consensus Forecast: 2.9%-3.1% year-over-year for both headline and core CPI
- 🚨 Special Circumstances: Due to October's federal government shutdown, the BLS canceled the October CPI release. The December 18 report will not include month-over-month percentage changes for categories relying on October survey data
- 💰 Gold Implications: Gold currently trading above $4,300 could reach October high near $4,380 depending on outcome
Potential Scenarios:
- 📈 Upside Surprise (>3.1%): Markets could question whether Fed's "one cut in 2026" path is too aggressive → BULLISH for gold (higher inflation = more rate cuts eventually)
- 📉 Downside Surprise (<2.9%): Could increase expectations for additional Fed easing in 2026 → BULLISH for gold (more rate cuts = lower dollar)
- 🎯 In-Line Result: Gold maintains uptrend without explosive moves → Base case for this trade
Why this matters for the trade: The Dec 19 $395/$410 call spread expires THE DAY AFTER CPI. The trader is betting CPI doesn't cause a massive spike above $400, allowing them to collect the $22.4M net credit from this leg.
December 19 Triple Witch Expiration (4 DAYS!) 🎢
Friday December 19 marks quarterly triple witch OPEX - simultaneous expiration of stock options, stock index futures, and index options:
- 📊 Massive options volume expires (part of this trade: 142,400 contracts!)
- 🎯 GLD implied move: ±$6.52 ($389.82 - $402.86 range)
- ⚖️ Pin risk at $395 where huge short call interest exists
- 💥 Post-expiration volatility often increases as hedges come off
Trading implication: The short $395 calls collected $25M in premium. If GLD stays below $395 at Friday's close, the trader keeps the entire premium ($4.30/contract × 57,186 contracts). Even if GLD is at $399, they keep most of the premium. The $410 long calls are essentially lottery tickets (only $0.46) betting on a huge CPI spike.
🚀 Near-Term Catalysts (Next 30-60 Days)
Federal Reserve Decision - January 28, 2026 (44 DAYS) 💰
The first FOMC meeting of 2026 will set the tone for monetary policy this year:
- 📊 Current Guidance: Only one 25 bp rate cut expected for entire 2026
- 🎯 Fed Funds Rate: Currently 3.5%-3.75% after December 11 cut
- 📈 Dot Plot: Fed's updated projections show cautious approach with minimal easing
- 🕊️ Dovish Catalyst: New Fed Chair expected in May 2026 likely to be "a dove" - bullish for gold into early 2026
Key Factors Fed Will Monitor:
- Labor market conditions (unemployment trends)
- Inflation trajectory (CPI, PCE data through December)
- Economic growth indicators (Q4 2025 GDP)
- Global geopolitical developments
Gold Implications:
- Any hint of additional rate cuts beyond one in 2026 = VERY BULLISH for gold
- Hawkish surprise (zero cuts in 2026) = SHORT-TERM negative, but structural demand remains
- Dovish hold (rate cut delayed to later in year) = Neutral to slightly positive
Why this matters for the trade: The January 30 expiration is positioned to capture the Fed meeting reaction. If Powell signals more dovish stance than expected, gold could rally to the $410-$425 profit zone.
Trump Tariff Policy Implementation - Q1 2026 ⚖️
Trump administration's tariff policies remain a significant wildcard for gold markets:
2025 Background:
- 25% tariffs on Canada/Mexico imports
- 10% baseline tariff on all imports
- 34% tariffs on China
- 20% tariffs on European Union
August 2025 Gold Tariff Scare:
- U.S. Customs indicated 39% tariffs on Swiss gold bars
- Spot gold spiked 3% from $3,290 to $3,398 in single day
- Administration later clarified physical gold imports would NOT be subject to tariffs
- Shows gold's sensitivity to tariff headlines
2026 Outlook: Julia Khandoshko, CEO at Mind Money, stated: "Although we discuss the Fed out of habit, the real uncertainty for the markets is now related to a more serious factor — the tariff war."
Gold Implications:
- ✅ Tariffs → Inflation → Fed delays rate hikes → Bullish gold
- ✅ Trade war → Safe haven demand → Bullish gold
- ✅ Dollar weakness from trade tensions → Bullish gold
- ❌ BUT: Severe recession from tariffs → Risk-off could pressure all assets
📊 Structural Catalysts (H1 2026)
Central Bank Gold Purchases - Ongoing Through 2026 🏦
Central banks are expected to purchase approximately 900 tonnes of gold in 2025, with structural trend continuing through 2026:
Key Buyers:
- 🇨🇳 China: PBoC extended gold-buying streak to 11 consecutive months in November 2025, adding 30,000 troy ounces
- Q3 2025: 118 tonnes purchased (up 39% month-over-month, 55% year-over-year)
- Unofficial estimates suggest actual holdings may reach 5,411 tonnes vs officially reported 2,304 tonnes
- 🇮🇳 India: Ongoing reserve diversification away from USD
- 🇵🇱 Poland & Emerging Markets: Reducing dollar exposure as part of de-dollarization strategy
Structural Shift:
- Central banks' share of total gold demand rose to nearly 25% in 2024, vs 12% in 2015-19
- For first time since 1996, gold surpassed U.S. Treasuries share in central bank reserves
- This is NOT cyclical buying - it's structural de-dollarization
Why this matters: Central bank demand provides a FLOOR under gold prices. Even if Western ETF flows reverse, official sector purchases create steady bid. The 900 tonnes annual run rate equals ~$40-50B in demand at current prices.
Western Investment Demand Resurgence 💎
After years of outflows, Western investment demand decisively returned in 2025:
GLD Specific Flows:
- YTD 2025: $20.46 billion net inflows (approaching 2020 record of $15.1B)
- November 2025: $992.3 million
- Past 3 months: $9.66 billion
- The three biggest daily inflows GLD has ever seen all occurred in 2025
Global Gold ETF Flows:
- 2025 Total: $57.1 billion (strongest since 2020)
- September 2025 marked record monthly inflow in USD notional value
Regional Breakdown (November):
- North America: $1B inflow (sixth consecutive month)
- Europe: $978M (flipped from negative to positive, led by UK and Germany)
- Asia: $3.2B (third consecutive month, China contributed $2.2B)
Why this matters: This trade is a DIRECT reflection of institutional flows. The $112.6M position represents sophisticated money participating in the resurgence of Western gold demand after years of apathy.
🎯 Analyst Price Targets (Mid-2026)
Major financial institutions issued bullish 2026 forecasts:
| Institution | 2026 Gold Price Target | GLD Implied Price* | Details |
|---|---|---|---|
| Goldman Sachs | $5,000/oz | ~$465 | Lifted from previous forecast |
| J.P. Morgan | $4,000/oz | ~$372 | Mid-2026 target; Q4 2025 avg $3,675 |
| Morgan Stanley | $4,400/oz | ~$409 | End 2026; revised up from $3,313 |
| Metals Focus | $4,560/oz avg | ~$424 | Q4 2026 peak: $4,850 (~$451) |
| World Gold Council | +5% to +15% | $415-$454 | From current levels, scenario-dependent |
* GLD price implied assuming ~$107.50 gold-to-GLD ratio (1/10th ounce per share)
Current Context:
- Spot gold: ~$4,271/oz (as of December 12, 2025)
- GLD: $395.21 (December 15, 2025)
- Gold all-time high: $4,379 on October 17, 2025
Why this matters for the trade: The $410 long calls and $425 short calls create a profit zone of $410-$425, which corresponds to gold at ~$4,410-$4,565/oz. This PERFECTLY aligns with consensus analyst targets for Q1 2026! The trade is positioned exactly where Wall Street expects gold to be.
🎲 Price Targets & Probabilities
Using gamma levels, implied move data, upcoming catalysts, and analyst forecasts:
📈 Bull Case (35% probability)
Target: $425-$440 (GLD)
How we get there:
- 📊 December 18 CPI comes in hot at 3.2%+, forcing markets to price MORE Fed cuts than currently expected
- 🚀 January 28 Fed meeting hints at 2-3 rate cuts in 2026 vs currently guided one cut
- 🇨🇳 China accelerates gold purchases to 150+ tonnes per month (vs 118 current run rate)
- 🌍 Major geopolitical crisis (Middle East escalation, Taiwan tensions, European debt crisis) → massive safe haven flows
- 💰 Western ETF inflows ACCELERATE beyond current $20.46B YTD pace
- ⚖️ Trump tariff policies expand, creating inflation fears and trade war uncertainty
- 📈 Technical breakout above $400 resistance triggers momentum rally through $410 to $425
- 🏆 Spot gold reaches $4,500-$4,850 range (upper end of analyst targets)
Key Levels:
- Break above $400 gamma resistance (219.1B) confirms bull case
- $410 gamma level (71.3B) becomes support rather than resistance
- $425 represents this trade's maximum profit zone
Probability Assessment: 35% because it requires multiple bullish catalysts to align simultaneously. Gold already up 60.7% YTD - further gains need fresh fundamental drivers. However, analyst consensus supports $410-$425 range by Q1 2026.
Trade P&L in Bull Case:
- GLD at $425 on Jan 30: Maximum profit achieved
- Long Jan $410 calls worth $15.00 × 142,400 contracts = $21.4M gain
- Short Jan $425 calls worth $0 (at-the-money) = $0 loss
- Plus: Kept $22.4M from Dec spread (if stayed below $400)
- Total profit: ~$40-45M on $59.6M net debit (67-75% ROI!)
🎯 Base Case (50% probability)
Target: $395-$415 (CHOPPY CONSOLIDATION)
Most likely scenario:
- ✅ CPI meets expectations (2.9%-3.1%) - no major surprises either way
- 📱 Fed maintains current guidance: one 25 bp cut in 2026, data-dependent approach
- 🤖 Gold consolidates recent gains in $390-$410 range for several weeks
- 🇨🇳 China continues steady 100-120 tonnes/month purchases (structural but not accelerating)
- ⚖️ Geopolitical tensions remain elevated but contained (no major escalation)
- 🔄 Trading within gamma support ($395) and resistance ($400-$410) bands
- 💤 Volatility moderates post-triple witch expiration
- 📊 Western ETF flows remain positive but normalize from Q4 2025 surge
Key Characteristics:
- GLD stays rangebound between $395 support (140.6B gamma) and $410 resistance (71.3B gamma)
- Dec 19 spread expires with GLD at $395-$400 → Collect most of $22.4M credit
- Jan 30 calls modestly profitable if GLD ends $405-$415 range
- This is the "grind higher" scenario - no fireworks, just steady appreciation
Why 50% Probability: Stock at technical inflection point between major support and resistance. Fundamentals remain constructive (central bank buying, Western inflows, Fed easing) but not explosive. Most institutional players positioned for gradual appreciation, not moonshot.
Trade P&L in Base Case:
- GLD at $405-$410 on Jan 30: Modest profit
- Dec spread collected $22.4M (assumed GLD stayed below $400)
- Long Jan $410 calls worth $0-$5 = $0-$7.1M
- Short Jan $425 calls worthless = $0
- Total profit: $22.4M - $29M cost = Break-even to modest gain
- This scenario represents "mission accomplished" for risk management - long position protected, some profit captured
📉 Bear Case (15% probability)
Target: $370-$390 (TEST SUPPORT!)
What could go wrong:
- 😰 CPI surprises to downside (<2.5%) - deflationary concerns emerge, gold loses inflation hedge premium
- 🚨 Fed turns HAWKISH - signals ZERO rate cuts in 2026, dollar surges
- 💸 Broad risk-on rally in equities drains safe haven demand from gold
- 📉 Technical breakdown below $395 support triggers cascade through $390 to $385
- 🇨🇳 China unexpectedly pauses gold purchases or reduces pace
- 🌍 Geopolitical de-escalation (Ukraine peace deal, Middle East ceasefire) → safe haven premium evaporates
- 💰 Profit-taking after 60.7% YTD rally - institutions lock in gains
- 📊 Western ETF outflows resume as investors chase higher-yielding assets
- ⚖️ Dollar strength from divergent global monetary policy
Critical Support Levels:
- 🛡️ $395: Must hold (140.6B gamma) or momentum shifts bearish
- 🛡️ $390: Secondary floor (124.0B gamma) - breaks here accelerate selling
- 🛡️ $385: Deep support (22.5B gamma) - disaster scenario
- 🛡️ $380: Extended floor (20.3B gamma)
Probability Assessment: Only 15% because it requires reversal of multiple structural trends (central bank buying, de-dollarization, Western inflows). Gold's fundamentals remain strong even if price consolidates. Bear case more likely represents healthy correction than trend reversal.
Trade P&L in Bear Case:
- GLD at $385 on Jan 30: Significant loss
- Dec spread: If GLD dropped before Dec 19, short $395 calls remain worthless but long $410 calls also worthless → Still collect $22.4M
- Jan calls: All worthless at $385 → Lose $29M on Jan leg
- Total loss: ~$6-10M on $59.6M position (10-17% loss)
- Trade has some downside protection from Dec premium collection
💡 Trading Ideas
🛡️ Conservative: Buy the Dip at Gamma Support
Play: Wait for pullback to $385-$390 gamma support, then buy GLD shares or long-dated calls
Why this works:
- ⏰ Let CPI (Dec 18) and triple witch (Dec 19) volatility pass first
- 💸 Avoid paying elevated implied volatility before major events
- 📊 $390 represents 124.0B gamma support - institutional buying zone
- 🎯 Risk-defined entry with clear invalidation level ($380 breakdown)
- 📈 Structural tailwinds remain intact (central bank buying, Fed easing, geopolitical risks)
- 🤔 60.7% YTD gain deserves consolidation - better entry likely
Action Plan:
- 👀 Watch CPI Thursday morning - volatility spike creates opportunity
- 🎯 Set limit orders at $388-$390 for GLD shares (1.5-2.5% pullback from current)
- ✅ Alternative: Buy March 2026 $390 calls for leveraged exposure with defined risk
- 📊 Position size: 3-5% of portfolio (core holding in diversified portfolio)
- ⏰ Hold through Q1 2026 to capture Fed meeting Jan 28 and potential rally to $410+
Stop Loss: Exit if GLD breaks decisively below $380 (extended support violated)
Expected Outcome: Pullback to support provides 5-8% better entry than chasing here. Structural factors support recovery to $405-$415 by February.
Risk Level: Low (buying established uptrend at support) | Skill Level: Beginner-friendly
⚖️ Balanced: Copy the Pros - Bull Call Spread (Post-Volatility)
Play: After CPI/OPEX volatility settles (December 20+), replicate this trade's structure
Structure: Buy Feb $400 calls, Sell Feb $415 calls (February 20 expiration)
Why this works:
- 🎢 IV crush after Dec 19 OPEX makes spreads 30-40% cheaper
- 📊 Defined risk: $15 spread width = $1,500 max risk per spread
- 🎯 Profit zone $400-$415 matches analyst targets and gamma resistance levels
- 🤝 Copying institutional positioning at better post-event prices
- ⏰ 62 days to expiration captures Jan 28 Fed meeting reaction
- 🛡️ Maximum loss capped at debit paid (typically $5-7 net, or $500-$700)
Estimated P&L (adjust after Dec 19 IV crush):
- 💰 Pay ~$6-7 net debit per spread post-volatility crush
- 📈 Max profit: $8-9 if GLD above $415 at Feb expiration (110-130% ROI)
- 📉 Max loss: $6-7 if GLD below $400 (100% loss of premium)
- 🎯 Breakeven: ~$406-407
- 📊 Risk/Reward: ~1.3:1 (acceptable for directional bullish play)
Entry Timing:
- ⏰ Wait until December 20-23 for full IV collapse
- 🎯 Only enter if GLD trading $395-$402 (spread not too deep in-the-money)
- ❌ Skip if GLD already above $410 (missed the move)
Position Sizing: Risk only 2-5% of portfolio (10-20 spreads max for $50K account)
Risk Level: Moderate (defined risk, bullish directional) | Skill Level: Intermediate
🚀 Aggressive: Leveraged Gold Call Leap (ADVANCED)
Play: Buy long-dated LEAP calls for maximum leverage to gold rally
Structure: Buy June 2026 $400 calls (186 days to expiration)
Why this could work:
- 💥 Gold analyst targets of $4,400-$5,000/oz by mid-2026 imply GLD at $409-$465
- 🚀 Multiple Fed rate cuts could materialize if inflation persists
- 📊 Central bank purchases of 900+ tonnes create structural bid
- 🌍 Geopolitical risk premium historically accounts for 12 percentage points of returns
- ⚡ Leverage: ~5:1 to 10:1 depending on strike and time to expiration
- 📈 June expiration captures ALL major catalysts: Fed meetings, CPI reports, tariff implementations
Why this could blow up (SERIOUS RISKS):
- 💸 EXPENSIVE: LEAP calls cost $25-35 ($2,500-$3,500 per contract)
- ⏰ TIME DECAY: Theta burns $10-15/day even on 6-month options
- 😱 VOLATILITY RISK: Gold volatility could collapse if geopolitical tensions ease
- 📊 All-or-nothing: Unlike spread, unlimited downside (can lose 100% of premium)
- 🎢 Gold's correlation to dollar/rates can whipsaw violently on Fed surprises
- ⚠️ 60.7% YTD gain already in price - "buy high" risk
Estimated P&L:
- 💰 Cost: ~$30 per LEAP (using June $400 strike)
- 📈 Profit scenario: GLD at $450 by June = $50 gain (167% ROI)
- 🚀 Home run: GLD at $465 (Goldman $5,000 gold) = $65 gain (217% ROI!)
- 📉 Loss scenario: GLD below $430 at expiration = lose $20-30 (67-100% loss)
- 💀 Total loss: GLD below $400 = lose entire $30 (100% loss)
Breakeven Point: ~$430 (GLD needs to rally 8.8% from current $395.21)
CRITICAL WARNING - DO NOT attempt unless you:
- ✅ Can afford to lose ENTIRE premium (real possibility in gold selloff)
- ✅ Understand leverage cuts both ways (10% gold move = 50-100% option move)
- ✅ Have hedging strategy (stop loss, position sizing, portfolio correlation)
- ✅ Accept you're betting against current market positioning (contrarian long after 60%+ rally)
- ⏰ Plan to actively manage (take profits at 50-100%, cut losses at -30-50%)
Risk Level: EXTREME (can lose 100% of premium) | Skill Level: Advanced only
Probability of Profit: ~40-45% (favorable given analyst targets but requires continued rally)
⚠️ Risk Factors
Don't get caught by these potential landmines:
-
⏰ CPI Binary Event Tomorrow (Dec 18): Results Thursday 8:30 AM ET create MASSIVE volatility risk. Gold could gap $20-40 based on whether CPI comes in at 2.7% vs 3.3%. Market expectations are 2.9%-3.1% but special circumstances (October shutdown) create additional uncertainty. Options pricing ±1.65% move but actual moves could be 2-3x larger.
-
💸 Already Up 60.7% YTD: Gold near all-time highs after parabolic rally. GLD started 2025 at ~$245 and now at $395.21 - this is NOT a "cheap" entry. Mean reversion risk is REAL. Historical precedent: Gold rallied 23% in 2020, then dropped 12% in 2021. Even bulls should expect consolidation after this magnitude of gains.
-
🇺🇸 Fed Hawkish Surprise Risk: Current dot plot shows only ONE rate cut in 2026. If Fed turns MORE hawkish (zero cuts), dollar surges and gold corrects 10-15%. Powell already signaled: "We are well positioned to wait and see how the economy evolves." This is NOT a dovish Fed anymore.
-
💰 Profit-Taking After Record Inflows: $20.46B YTD inflows represents MASSIVE institutional accumulation. These same funds could SELL if catalysts disappoint. The three biggest daily inflows GLD ever saw all occurred in 2025 - what happens when they reverse? December-January is traditional profit-taking season.
-
🌍 Geopolitical De-escalation Wildcard: Gold's 12 percentage point geopolitical risk premium evaporates INSTANTLY if major conflicts resolve. Ukraine peace deal? Middle East ceasefire? Any one of these removes billions in safe haven demand overnight. Gold dropped 3% in hours when August tariff scare was clarified.
-
🇨🇳 China Purchase Slowdown: PBoC buying 118 tonnes in Q3 2025 is extraordinary, but NOT guaranteed to continue. If China pauses (economic weakness, currency defense, policy shift), a key pillar of demand disappears. Remember: China's purchases are NOT transparent - we only know what they report to IMF.
-
📊 Gamma Ceiling at $400: Massive 219.1B call gamma at $400 (HIGHEST SINGLE LEVEL!) means market makers systematically SELL into rallies to hedge exposure. This creates mechanical resistance making breakouts difficult. Current price $395.21 sitting RIGHT under this ceiling. Multiple failed breakout attempts could trigger bearish momentum.
-
⚖️ Dollar Strength Scenario: Gold trades inversely to USD. If dollar rallies on relative economic strength (US economy outperforms Europe/China), gold gets crushed. Dollar Index (DXY) currently weak, but reversal to 105+ would pressure gold to $360-$370 range quickly. Gold is a currency, not a stock - macro matters MORE than company fundamentals.
-
💎 28% Collectibles Tax: Gold ETFs like GLD are taxed as collectibles with long-term capital gains taxed at maximum 28% (vs 15-20% for stocks). This creates headwind for taxable accounts during selling. Institutions aware of this may preemptively sell in December for tax management.
-
🎢 Extreme Leverage in This Trade: $112.6M position controlling ~$133M in gold exposure (336,400 contracts × $395.21 = $133M notional). This is 1.2:1 leverage INCLUDING the short calls. If volatility spikes, margin calls and forced liquidations could cascade. This trade assumes NO counterparty blowups - but options are derivatives with counterparty risk.
-
📉 Recession Risk Paradox: Gold typically rallies in recessions (safe haven), BUT severe deflationary recession could see ALL assets sell (2008-style). If credit markets freeze or equity crash forces liquidation, gold could initially drop 20-30% before recovering. Not primary scenario but tail risk is real.
🎯 The Bottom Line
Real talk: Someone just deployed $112.6 MILLION in a sophisticated multi-leg gold options spread just THREE DAYS before the most important inflation report of the month and FOUR DAYS before quarterly triple witch expiration. This isn't a simple bullish bet - it's a carefully engineered position that:
- Collects $22.4M in short-term premium (Dec 19 spread)
- Uses that premium to FUND a longer-term bullish position (Jan 30 calls)
- Caps maximum profit at $425 but eliminates most downside below $395
What this trade tells us:
- 🎯 Sophisticated player expects GLD to CONSOLIDATE at $395-$400 through Friday (collect premium)
- 💰 Then expects rally to $410-$425 by late January (profit zone)
- ⚖️ Positioned EXACTLY where analyst consensus expects gold to be ($4,400-$4,560 range = GLD $409-$424)
- 📊 Timing captures Dec 18 CPI, Dec 19 triple witch, Jan 28 Fed meeting
- ⏰ NOT a short-term trade - this is 46-day structured position with multiple scenarios
This is NOT a "buy everything" signal - it's a "gold rally continues but requires careful positioning" signal.
If you own GLD:
- ✅ You've already won! Up 60.7% YTD is EXCEPTIONAL. Consider trimming 20-30% to lock gains.
- 📊 If holding, set MENTAL STOP at $385 (gamma support breakdown = trend change)
- ⏰ Don't chase here at $395 - let CPI/OPEX volatility pass first
- 🎯 If price pulls back to $388-$390, that's GIFT to add/re-enter
- 🛡️ Consider selling covered calls at $405-$410 to collect premium (copy this trade's strategy!)
If you're watching from sidelines:
- ⏰ Thursday December 18, 8:30 AM ET - CPI is the catalyst everyone's watching
- 🎯 Pullback to $385-$390 post-volatility would be EXCELLENT entry (structural support + better risk/reward)
- 📈 Looking for confirmation: CPI in-line or hot, Fed stays dovish, China continues 100+ tonne monthly purchases
- 🚀 Longer-term (Q1-Q2 2026), gold's fundamental case remains STRONG: Fed easing, central bank buying, geopolitical risks, de-dollarization
- ⚠️ Current valuation requires near-perfect catalyst execution - one stumble and it's back to $370-$380
If you're bearish:
- 🎯 Wait for failed breakout above $400 resistance (219.1B gamma ceiling)
- 📊 First support at $395 (140.6B gamma), critical support at $390 (124.0B gamma)
- ⚠️ Post-OPEX put spreads ($395/$385 or $390/$380) offer defined-risk downside play
- 📉 Watch for breakdown below $385 - that triggers cascade to $375-$370
- ⏰ Early January after Fed positioning settled offers better risk/reward for bears than fighting here
Mark Your Calendar - Key Dates:
- 📅 December 18 (Wednesday) 8:30 AM ET - U.S. CPI Report (TOMORROW!)
- 📅 December 19 (Thursday) - Quarterly Triple Witch OPEX (part of this trade expires!)
- 📅 January 16, 2026 - Monthly OPEX
- 📅 January 28, 2026 - Federal Reserve FOMC Meeting (first of 2026!)
- 📅 January 30, 2026 - This trade's January calls expire (main profit window)
- 📅 February 20, 2026 - Monthly OPEX
- 📅 March 20, 2026 - Quarterly Triple Witch
- 📅 May 2026 - New Fed Chair appointment expected (likely dovish)
- 📅 Mid-2026 - Goldman Sachs $5,000 gold target
Final Verdict: Gold's structural bull market remains INTACT - central bank buying at 900 tonnes annually, Western investment demand surging after years of outflows, Fed easing cycle beginning, geopolitical risks elevated, and de-dollarization accelerating. These are multi-year trends that don't reverse overnight.
BUT - at $395.21 after a 60.7% YTD rally with CPI tomorrow and triple witch Friday, the risk/reward for AGGRESSIVE new longs is NO LONGER favorable. This $112.6M trade shows how smart money approaches this setup: collect premium on short-term volatility, fund medium-term bullish position, cap upside at realistic targets ($410-$425).
Be strategic. Let the volatility settle. Look for pullbacks to $385-$390. The gold rally will still be here in January, and you'll sleep better paying $388 instead of $395.
Gold is a marathon, not a sprint. Position accordingly. 💎
Disclaimer: Options trading involves substantial risk of loss and is not suitable for all investors. This analysis is for educational purposes only and not financial advice. Past performance doesn't guarantee future results. Gold and gold ETFs are subject to commodity price volatility, currency fluctuations, geopolitical events, and macroeconomic factors beyond investor control. The unusual size of this trade reflects institutional portfolio hedging that may not be appropriate for retail investors. CPI and Fed meetings create binary event risk with potential for 5-10% gaps either direction. GLD is taxed as a collectible with 28% maximum long-term capital gains rate. Always do your own research and consider consulting a licensed financial advisor before trading.
About SPDR Gold Shares (GLD): The SPDR Gold Shares ETF provides investors with direct exposure to the price of physical gold bullion through a grantor trust structure, holding actual gold bars in secure London vaults, with $143.22 billion in assets under management making it the world's largest gold-backed ETF.