GLD Institutional Gold Play: $35.6M Loaded Into Deep ITM LEAPS Calls
January 13, 2026 | Unusual Activity Detected
The Quick Take
Someone just deployed $35.6 million into GLD September 2026 $250 calls in a coordinated series of 8 trades - and these aren't lottery tickets. These are deep in-the-money LEAPS with $250 strikes while GLD trades at $424.50. This institutional-sized position is essentially a synthetic long on gold with built-in leverage, suggesting conviction in the ongoing gold bull market through Q3 2026.
About GLD
SPDR Gold Trust (GLD) is the world's largest gold-backed ETF, holding physical gold bullion in vaults. Listed on NYSE Arca, GLD provides investors direct exposure to gold prices without the complexity of futures contracts or physical storage.
| Metric | Value |
|---|---|
| Current Price | $424.50 |
| 52-Week Range | $245.52 - $425.74 |
| AUM | ~$140.8B |
| YTD Return | +4.6% to +6% |
| 1-Year Return | +68.6% |
| Gold Spot Price | $4,609.75/oz |
SIC Classification: Commodity Contracts Brokers & Dealers
GLD tracks gold prices with high fidelity, making it the preferred vehicle for institutions seeking gold exposure. With gold surging 72% year-over-year to record highs above $4,600/oz, today's activity suggests continued institutional conviction in the precious metals rally.
The Option Flow Breakdown
What Just Happened
A series of 8 coordinated trades hit the tape at 10:17:07 ET - all targeting the same contract: September 18, 2026 $250 calls. Here's the complete breakdown:
| Time | Direction | Strike | Expiration | Volume | Premium | Option Price | OI | Z-Score | Option |
|---|---|---|---|---|---|---|---|---|---|
| 10:17:07 | BUY | $250 | 2026-09-18 | 9,000 | $4.80M | $6.51 | 32,000 | 1,537 | GLD20260918C250 |
| 10:17:07 | BUY | $250 | 2026-09-18 | 35,000 | $4.49M | $6.51 | 32,000 | 5,979 | GLD20260918C250 |
| 10:17:07 | BUY | $250 | 2026-09-18 | 16,000 | $4.50M | $6.10 | 32,000 | 2,733 | GLD20260918C250 |
| 10:17:07 | SELL | $250 | 2026-09-18 | 7,000 | $4.55M | $6.10 | 32,000 | 1,195 | GLD20260918C250 |
| 10:17:07 | BUY | $250 | 2026-09-18 | 55,000 | $4.51M | $6.51 | 32,000 | 9,395 | GLD20260918C250 |
| 10:17:07 | SELL | $250 | 2026-09-18 | 7,000 | $4.55M | $6.51 | 32,000 | 1,195 | GLD20260918C250 |
| 10:17:07 | BUY | $250 | 2026-09-18 | 7,000 | $4.50M | $6.51 | 32,000 | 1,195 | GLD20260918C250 |
| 10:17:07 | SELL | $250 | 2026-09-18 | 26,000 | $3.70M | $6.10 | 63,000 | 4,441 | GLD20260918C250 |
Net Position: 82,000 contracts BOUGHT (122,000 buys - 40,000 sells)
Total Premium: ~$35.6M
Strategy Classification: Complex Multi-Leg
What This Actually Means
Let me break this down. These aren't speculative out-of-the-money bets hoping for a moonshot. These are deep in-the-money LEAPS with intrinsic value of about $174.50 per share ($424.50 current price minus $250 strike).
Why would someone do this?
- Synthetic Stock Position: Deep ITM calls act like stock ownership but with less capital tied up and defined risk
- Leverage with Safety: These calls have delta close to 1.0, meaning they move nearly dollar-for-dollar with GLD
- Tax Efficiency: Institutions sometimes use LEAPS for tax planning purposes
- Conviction Signal: With 8 months until expiration and the strike 41% below current prices, this is a confident, patient bet
The irregular volume pattern (buys of 9k, 35k, 16k, 55k, 7k mixed with sells of 7k, 7k, 26k) suggests this may be an institutional rebalancing or a complex hedged position rather than a single directional bet. However, the net bullish bias of 82,000 contracts bought signals overall positive sentiment.
Z-Scores ranging from 1,195 to 9,395 indicate these trades are roughly 1,200x to 9,400x more unusual than typical GLD options activity. This level of activity happens only a handful of times per year.
Technical Setup
YTD Chart
GLD has been on a tear in 2026, already up 4.6% to 6% year-to-date after an incredible 64% rally in 2025. The ETF is currently trading near all-time highs around $424.50, approaching the 52-week high of $425.74.
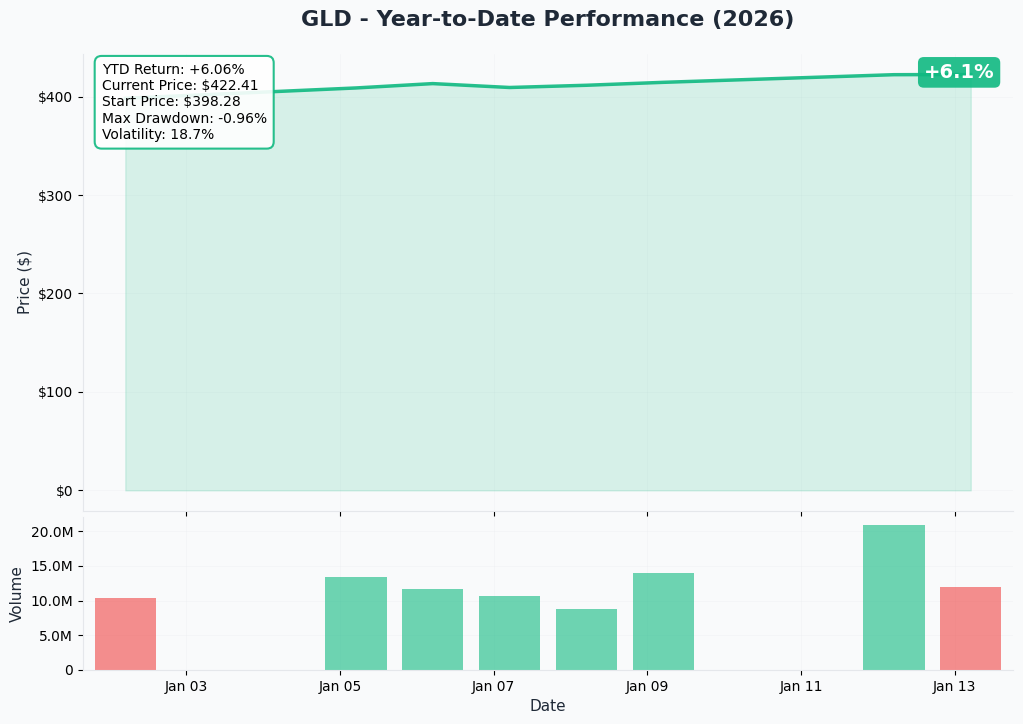
The chart shows a powerful uptrend with gold benefiting from geopolitical uncertainty (Venezuela intervention, Iran tensions) and concerns about Federal Reserve independence. However, with RSI at 80+, the momentum oscillators are flashing overbought signals.
Gamma-Based Support & Resistance Analysis
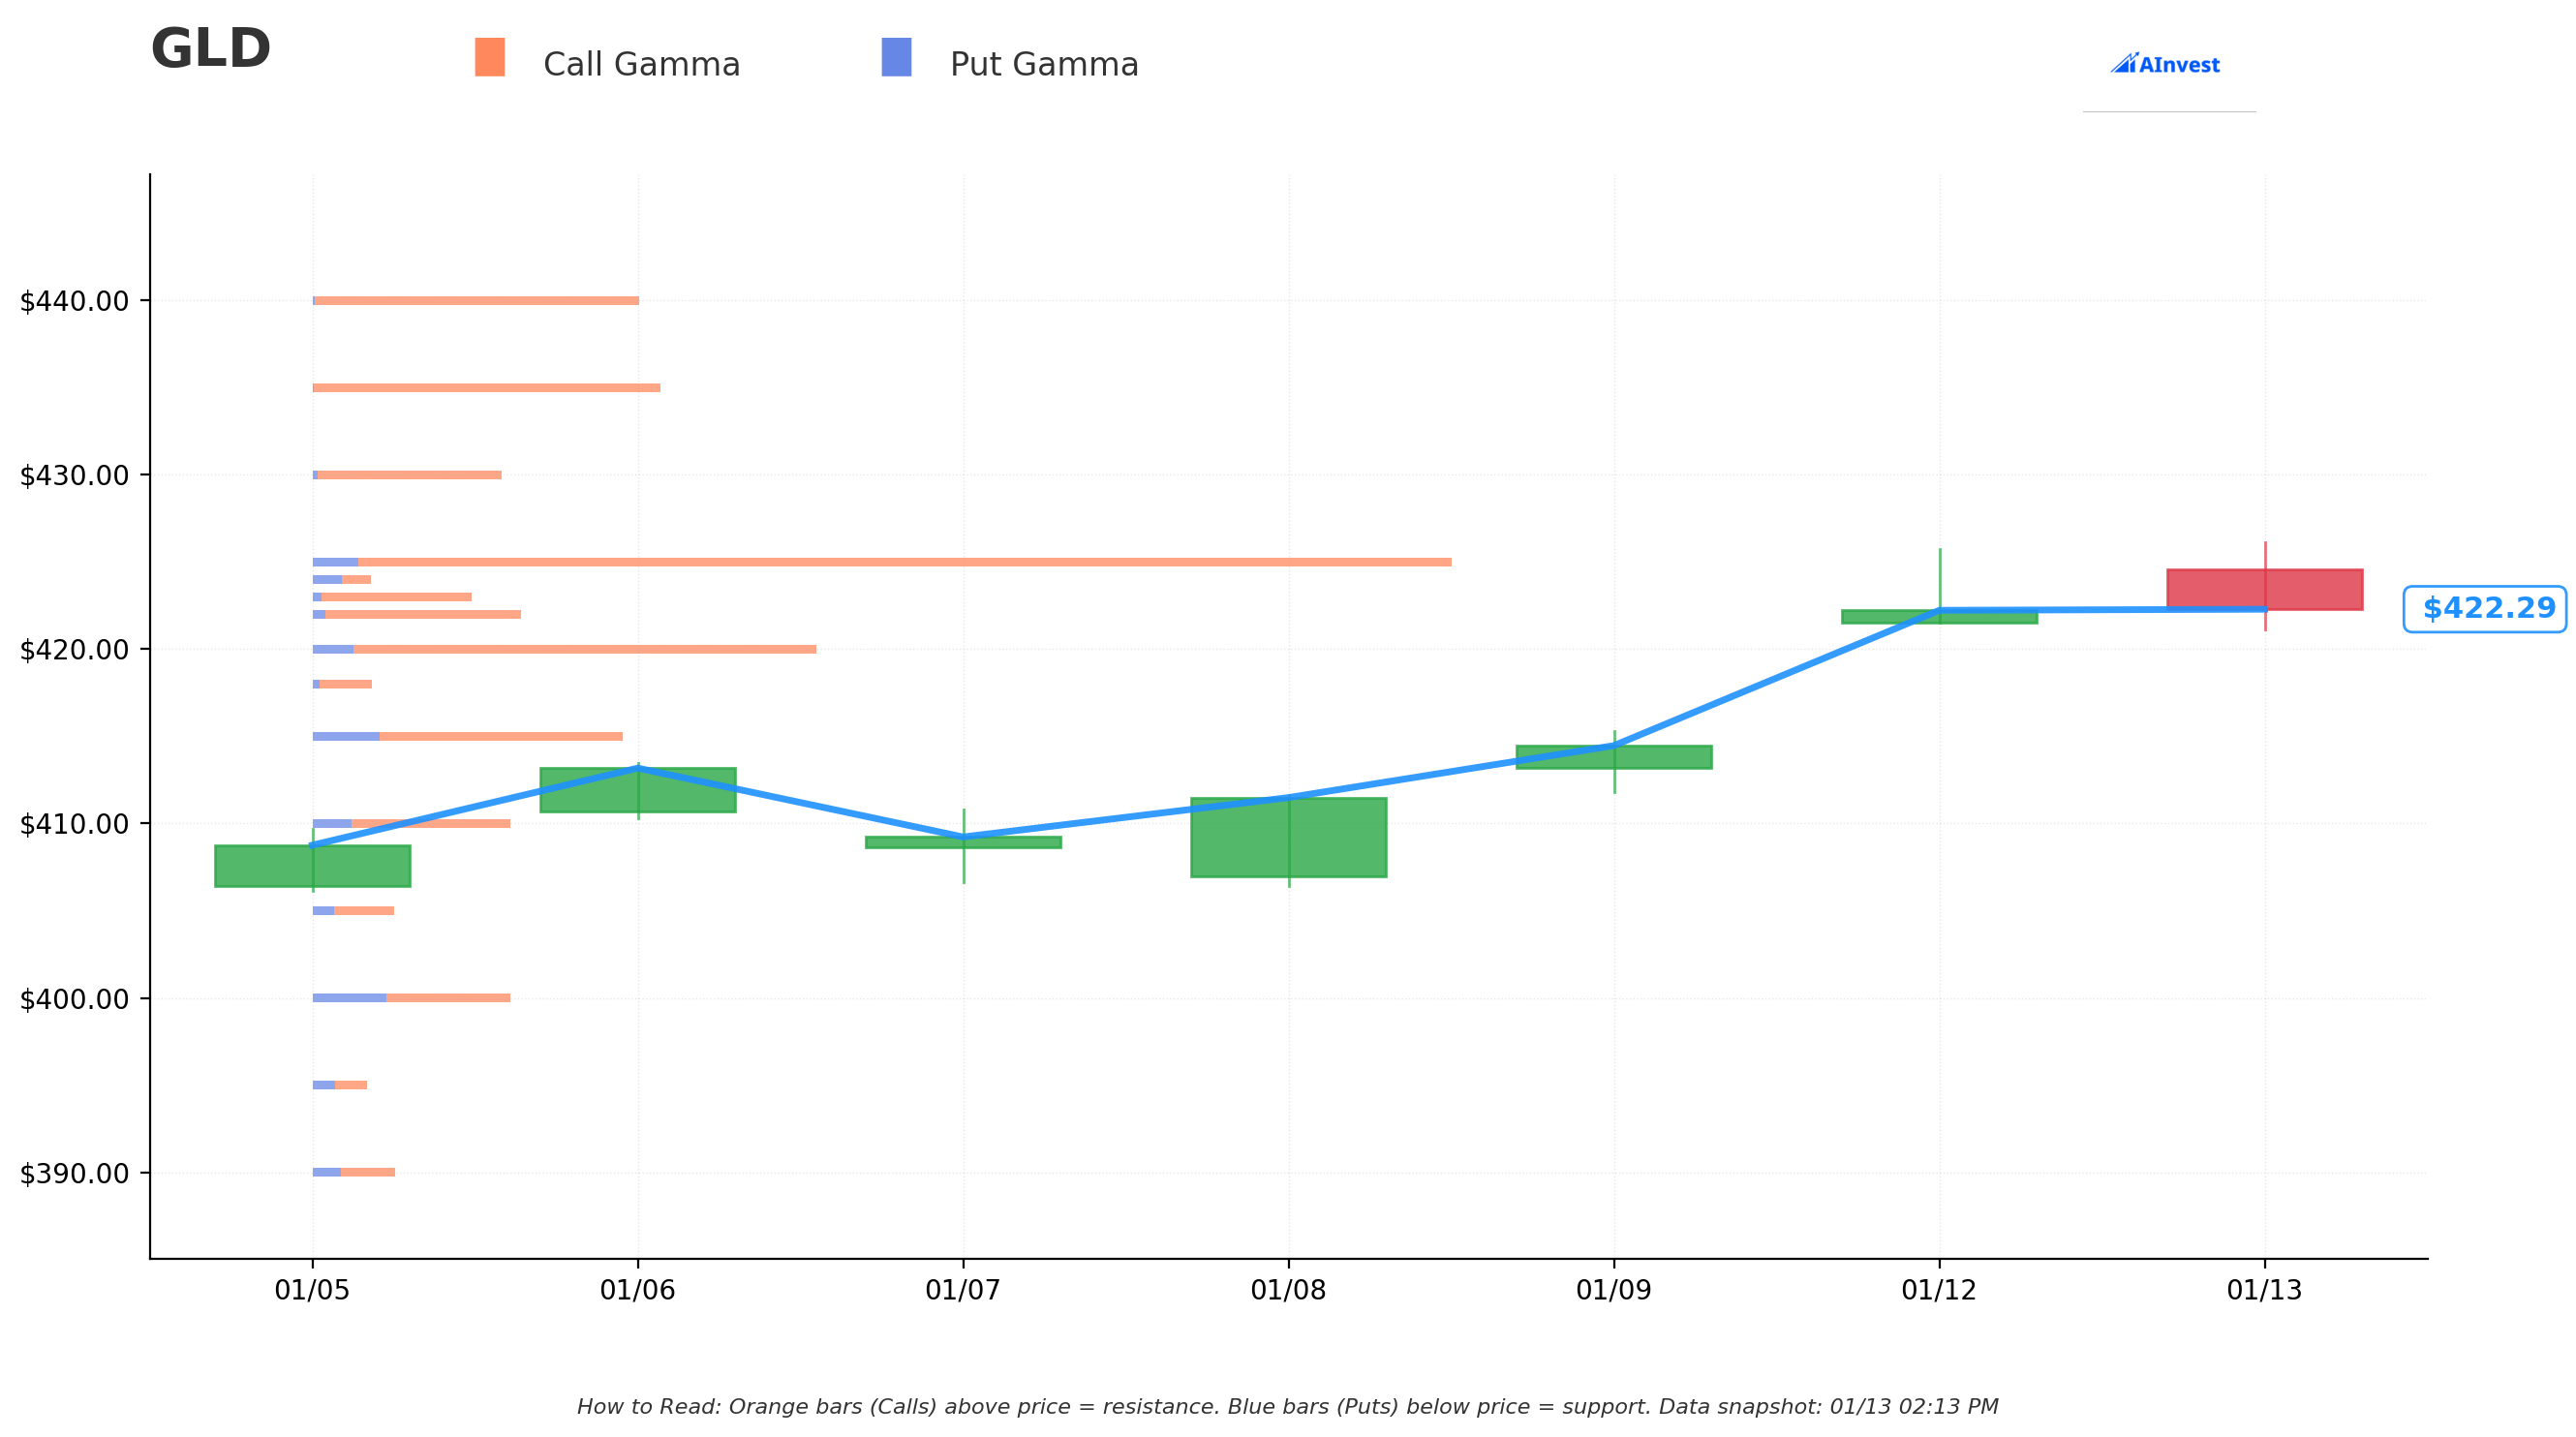
Based on dealer gamma positioning, here are the key levels to watch:
Resistance Levels (Where Selling Pressure Builds):
| Strike | Net Gamma | Distance from Current |
|---|---|---|
| $425 | 347.7 | +0.6% - Strongest resistance |
| $435 | 115.1 | +3.0% |
| $440 | 106.6 | +4.2% |
| $430 | 59.3 | +1.8% |
| $423 | 53.8 | +0.1% |
Support Levels (Where Buying Pressure Emerges):
| Strike | Net Gamma | Distance from Current |
|---|---|---|
| $420 | 139.5 | -0.6% - Strongest support |
| $422 | 64.1 | -0.1% |
| $415 | 58.1 | -1.8% |
| $410 | 39.4 | -2.9% |
| $400 | 15.9 | -5.3% |
Gamma Analysis: The net gamma bias is bullish with total call gamma of 1,478.6 versus put gamma of 240.6. This 6:1 ratio indicates dealers are heavily positioned to buy on dips and sell on rips, which typically creates support but can also cap upside moves. The $420-$425 range shows the highest gamma concentration, suggesting price may oscillate within this zone in the near term.
Implied Move Analysis
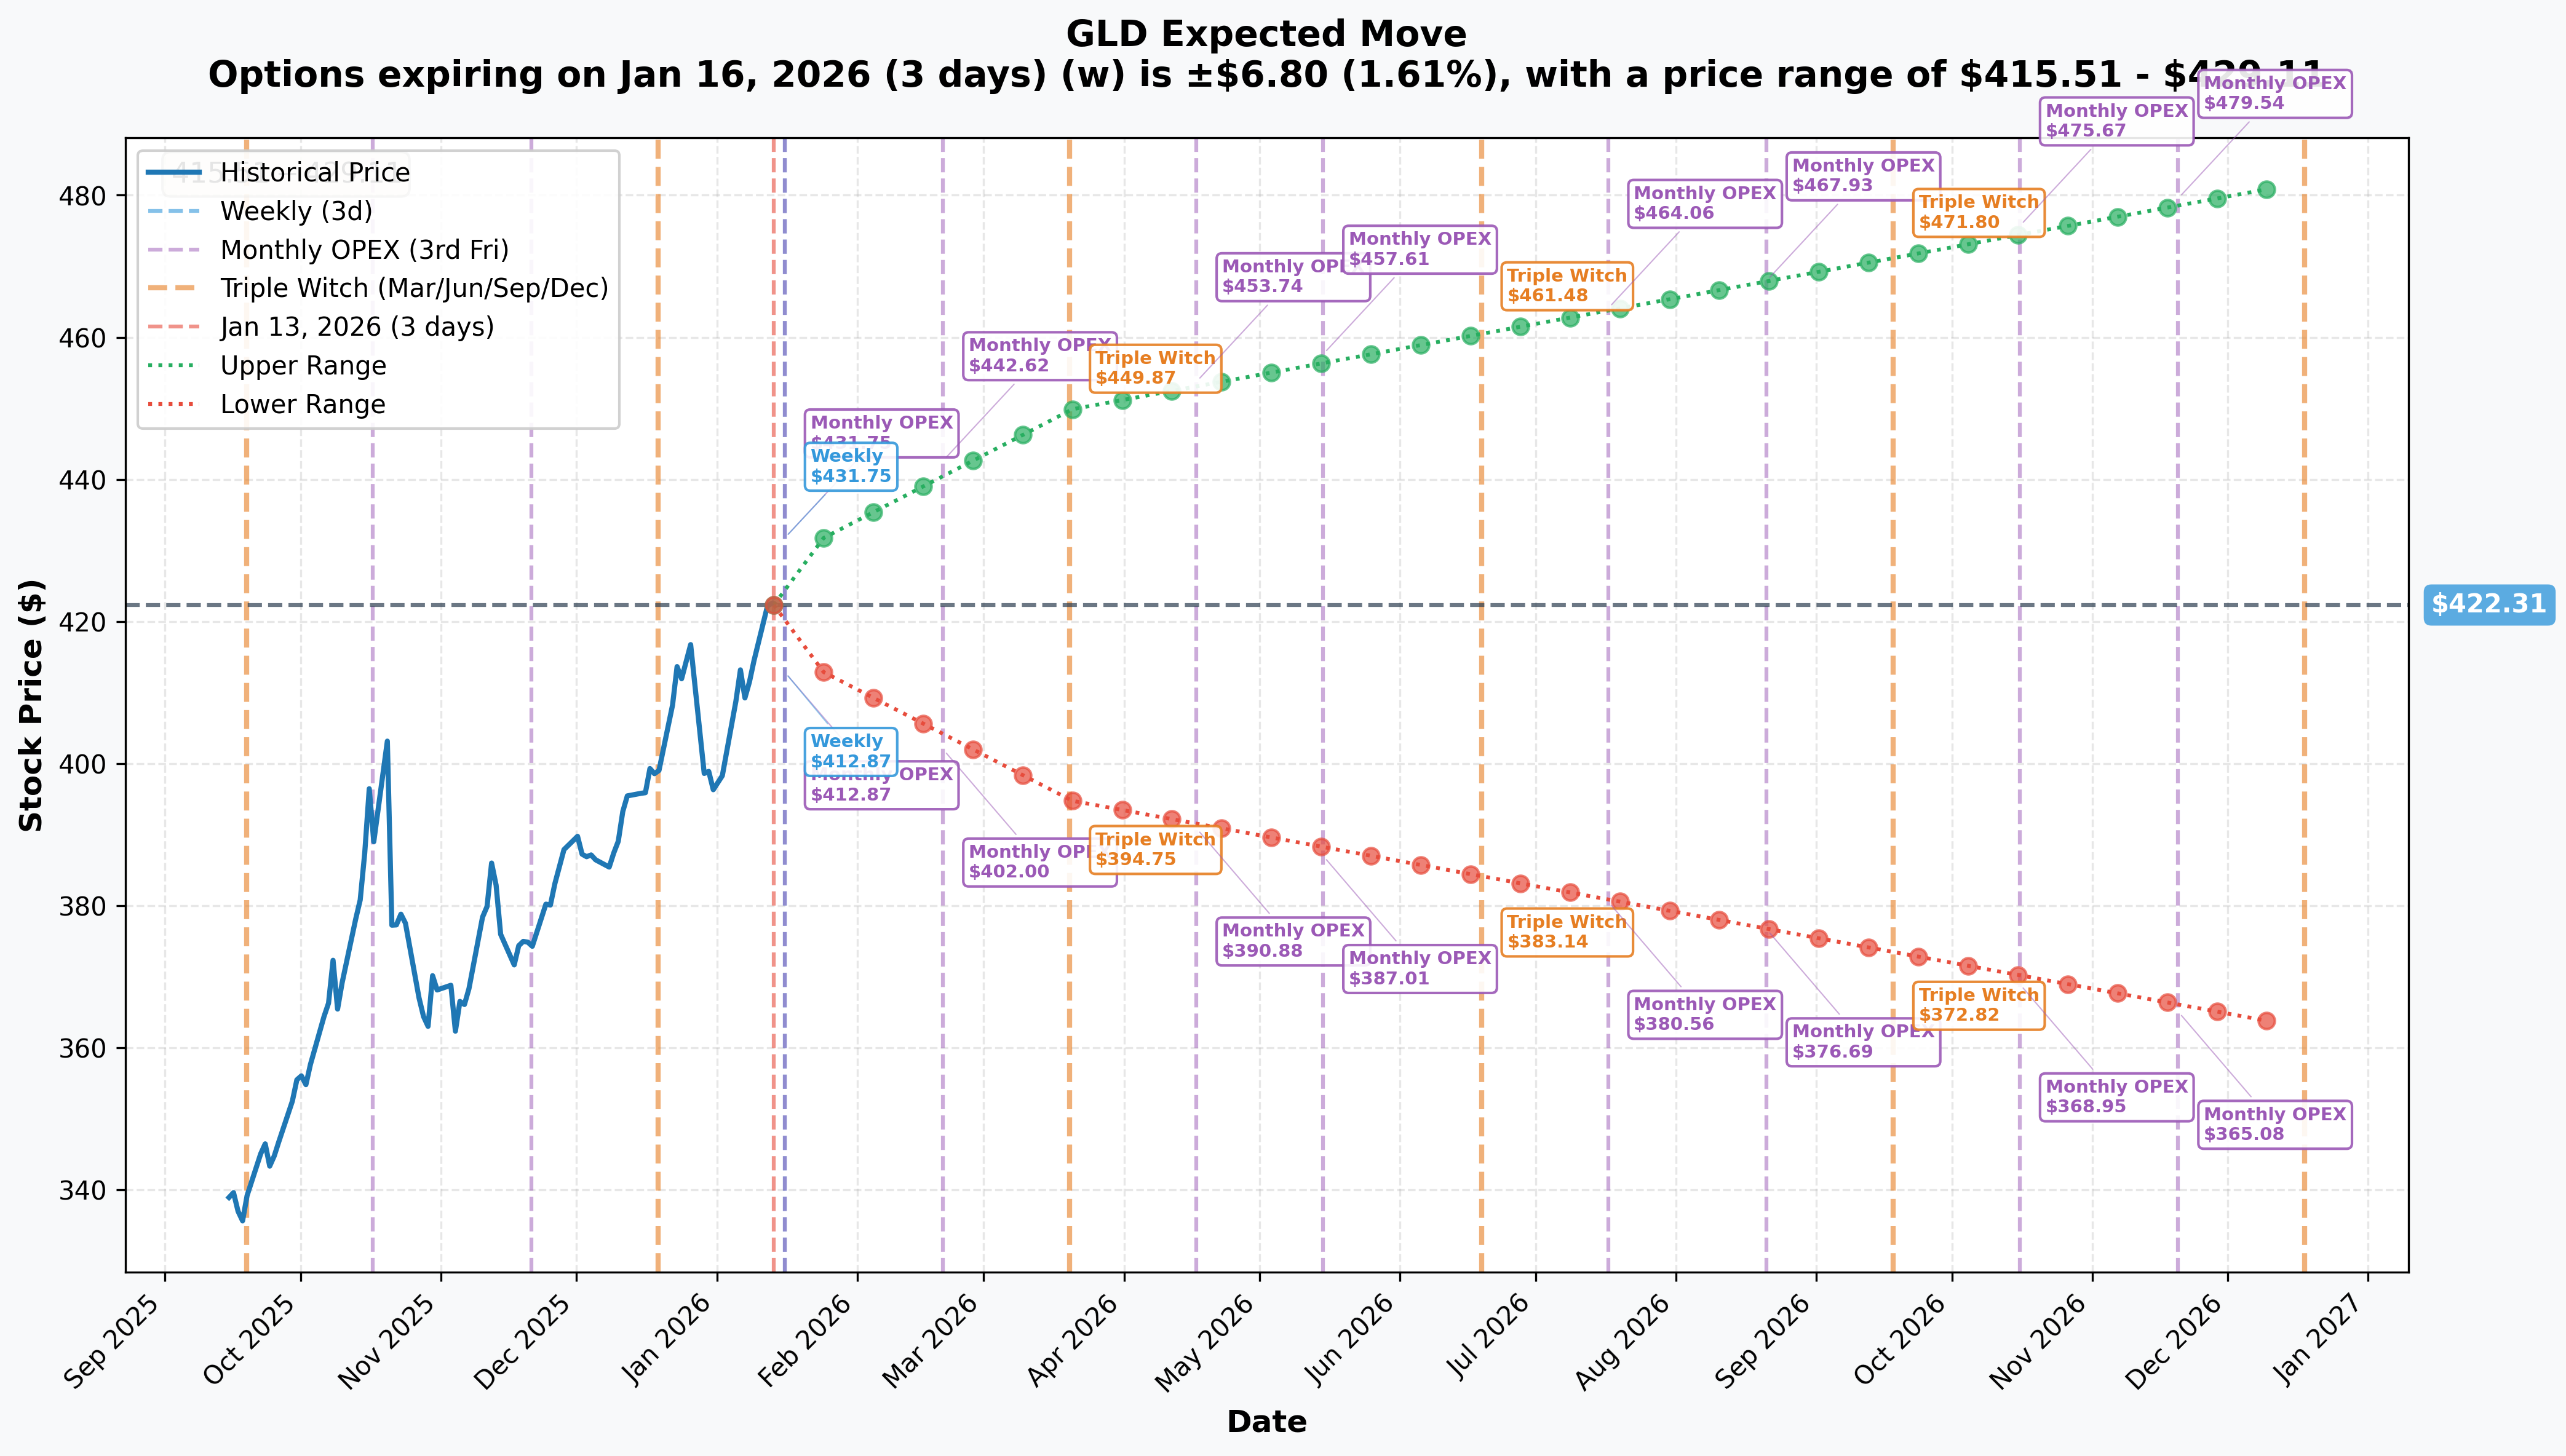
The options market is pricing in the following expected moves:
| Timeframe | Expiry | Implied Move | Range |
|---|---|---|---|
| Weekly | Jan 16 | +/-1.61% | $415.51 - $429.11 |
| Monthly | Jan 16 | +/-1.61% | $415.51 - $429.11 |
| Quarterly (Triple Witch) | Mar 20 | +/-6.53% | $394.75 - $449.87 |
| LEAPS | Dec 18, 2026 | +/-14.11% | $362.73 - $481.89 |
Key Takeaway: The September 2026 expiration of the unusual trades falls between the quarterly and yearly timeframes. Based on interpolation, the market expects GLD could move approximately +/-10% by September, translating to a range of roughly $382 to $467.
The $250 strike sits well below even the most bearish yearly scenario ($362.73), indicating these calls will almost certainly retain significant intrinsic value regardless of normal market fluctuations.
Catalysts
Recent Catalysts (Already Happened)
-
US Military Intervention in Venezuela (January 3, 2026): The unprecedented capture of President Maduro triggered a surge in safe-haven demand, pushing gold above $4,600/oz (CNBC)
-
Federal Reserve Independence Concerns: Federal prosecutors are examining a $2.5 billion Fed headquarters renovation and Powell's Congressional testimony, adding policy uncertainty (CNBC)
-
December 2025 CPI Release (January 13, 2026): Core CPI came in at +2.6% YoY, the lowest since March 2021, supporting the case for eventual Fed rate cuts (BLS)
-
Record 2025 ETF Inflows: Global gold ETFs saw $89 billion in inflows during 2025, the largest on record (World Gold Council)
Upcoming Catalysts
| Date | Event | Expected Impact |
|---|---|---|
| January 27-28, 2026 | FOMC Meeting | ~80% probability of rates held steady; focus on forward guidance |
| February 11, 2026 | January CPI | Inflation trajectory crucial for Fed policy |
| Q1 2026 | Supreme Court Tariff Ruling | Could impact trade policy and gold's safe-haven premium |
| March 17-18, 2026 | FOMC + Economic Projections | Updated dot plot for 2026 rate path |
| June 16-17, 2026 | FOMC Meeting | Market expects first 2026 rate cut |
| Ongoing | Iran Protests / Tensions | Safe-haven demand driver; US has warned it is "locked and loaded" (Al Jazeera) |
Price Targets & Probabilities
Based on the gamma levels, implied move data, and analyst forecasts, here are the scenarios:
Bull Case: $450-$475 (35% Probability)
Why it could happen:
- Gold analyst targets from JP Morgan ($5,000/oz) and Goldman Sachs ($4,900/oz) imply GLD in the $450-$475 range (JP Morgan)
- Iran situation escalates, driving safe-haven demand
- Fed signals more aggressive rate cuts
- Quarterly implied move upper bound is $449.87
- LEAPS implied move upper bound is $481.89
Key resistance: $425 gamma wall needs to break first
Base Case: $420-$435 (45% Probability)
Why this makes sense:
- Strongest gamma concentration at $420-$425 suggests price gravitates here
- Technical overbought conditions (RSI 80+) may limit near-term upside
- January FOMC likely a non-event with rates held steady
- Current analyst consensus centers around $4,450-$4,800/oz gold
Range: The gamma-defined trading range aligns with weekly implied move
Bear Case: $395-$415 (20% Probability)
Why it could happen:
- Strong dollar resurgence (DXY recently hit 98.60)
- Geopolitical tensions ease faster than expected
- Fed hawkish surprise keeping rates higher for longer
- Profit-taking after 64% 2025 rally
- Citi's bearish target of $3,600-$3,800/oz gold would put GLD around $330-$350 (FXStreet)
Support levels: $420 gamma wall, then $415, $410
Trading Ideas
Conservative: "The Gold Standard"
Strategy: Buy GLD shares or deep ITM calls (mirroring institutional flow)
Setup:
- Buy GLD shares at $424.50, or
- Buy September 2026 $380 calls (~$50-55 premium)
Why this works: You're aligning with institutional money flow while maintaining significant downside protection. The deep ITM calls have high delta and move nearly dollar-for-dollar with GLD.
Target: $450 (+6%) Stop: $405 (-5%) Risk/Reward: 1.2:1
Balanced: "Riding the Gamma Wave"
Strategy: Bull call spread to define risk
Setup:
- Buy March 2026 $420 call (~$15)
- Sell March 2026 $440 call (~$6)
- Net debit: ~$9 ($900 per spread)
- Max profit: $11 ($1,100 per spread) if GLD above $440 by March expiration
Why this works: The quarterly implied move shows $449.87 as the upper bound. This spread captures the majority of that upside while defining your maximum risk at $9 per share.
Break-even: $429 Max profit zone: Above $440
Aggressive: "Geopolitical Gold Rush"
Strategy: Near-term call position for January catalyst exposure
Setup:
- Buy January 31, 2026 $430 calls (~$3-4)
- Position size: Risk only what you can afford to lose
Why this works: If Iran tensions escalate or the FOMC surprises dovish, gold could spike. This is a defined-risk bet on volatility around the January 27-28 FOMC meeting.
Target: $440 (+3.5% from current) Risk: Entire premium if GLD stays below $430
Caution: This is a high-risk, high-reward play. Options expire worthless if GLD doesn't move significantly higher.
Risk Factors
Technical Overbought Conditions: RSI at 80+ signals gold is stretched. According to Investing.com's technical analysis, oscillators are flashing sell signals even as moving averages remain bullish.
Dollar Strength: A resurgent US dollar could pressure gold prices. The DXY recently climbed to 98.60, temporarily stalling the rally (Financial Content).
Geopolitical De-escalation: If Venezuela/Iran situations calm faster than expected, the safe-haven bid could evaporate quickly.
ETF Outflow Risk: GLD experienced a $752.6M single-day outflow on January 6, 2026 (AInvest). Sector rotation into risk assets remains a concern.
Pace of Gains Unlikely to Repeat: After a 64% rally in 2025, most analysts expect more modest gains in 2026. The easy money may have already been made.
Higher-for-Longer Rates: If inflation proves sticky and the Fed delays cuts beyond June, real rates could pressure gold.
The Bottom Line
Here's the deal: A large institution just put $35.6 million to work in deep ITM GLD calls expiring in September 2026. This isn't a lottery ticket play - it's a confident, patient bet that gold remains elevated through Q3 2026.
What the flow tells us:
- Net bullish with 82,000 contracts bought vs. 40,000 sold
- Deep ITM strikes ($250 vs. $424.50 spot) signal conviction, not speculation
- Z-scores up to 9,395x normal indicate this is exceptionally rare activity
- Complex multi-leg structure suggests sophisticated institutional positioning
Your Action Plan:
| If You're... | Consider This |
|---|---|
| Bullish on Gold | Use the gamma-defined $420 support as your entry zone. Target $435-$450. |
| Already Long | The institutional flow validates your thesis. Consider taking partial profits at $425-$430 resistance and re-entering on pullbacks. |
| Skeptical | Watch the $420 gamma support. A break below signals the rally may be exhausting. |
Mark Your Calendar: The January 27-28 FOMC meeting is the next major catalyst. While rates are expected to hold, any dovish language or hints about the Fed leadership situation could spark the next leg higher.
The Big Picture: Gold has rallied on geopolitical chaos - Venezuela, Iran, and Fed independence concerns. While the technical setup is overbought short-term, the structural bull case (central bank buying, de-dollarization, safe-haven demand) remains intact. Today's institutional flow suggests the smart money agrees.
Disclaimer: This analysis is for informational purposes only and does not constitute investment advice. Options trading involves substantial risk of loss and is not suitable for all investors. Past performance does not guarantee future results. Always do your own research and consider consulting a financial advisor before making investment decisions.
Data sources: World Gold Council, CNBC, JP Morgan, Goldman Sachs