GLD Options Analysis: $12.9M Put Block Accumulation
Date: January 16, 2026 Ticker: GLD (SPDR Gold Shares) Signal: Institutional Put Accumulation Total Premium: $12,900,000
Trade Tape
| Time | Symbol | Side | Type | Strike | Expiry | Premium | Size | OI | Spot | Option Price |
|---|---|---|---|---|---|---|---|---|---|---|
| 13:37:29 | GLD20260320P400 | BUY | PUT | $400 | 2026-03-20 | $10,000,000 | 19,497 | 24,000 | $422.18 | $5.34 |
| 13:38:21 | GLD20260320P400 | BUY | PUT | $400 | 2026-03-20 | $2,900,000 | 5,350 | 24,000 | $422.32 | $5.33 |
Total Volume: 50,000 contracts Combined Premium: $12.9M Pattern: Block Accumulation (BTO)
What Is Block Accumulation?
This is textbook institutional behavior. Rather than placing a single massive order that would move the market, the buyer split their position into two fills 52 seconds apart. Notice how the second fill came in at $5.33 versus $5.34 on the first - they got a penny better execution by not telegraphing their full size upfront.
When you see 24,847 contracts traded against an open interest of only 24,000, you're watching someone build a brand new position in real-time. The combined volume of 50,000 contracts (across both fills and market activity) dwarfs the existing OI by more than 2x. This isn't a hedge being rolled - someone is placing a fresh directional bet.
About GLD
SPDR Gold Trust (GLD) is the world's largest physically-backed gold ETF, holding over $160 billion in assets under management.1 Each share represents approximately 1/10th of an ounce of gold bullion stored in secure vaults. The fund trades on NYSE Arca and has been the go-to vehicle for institutional gold exposure since its 2007 launch.
Key Stats:
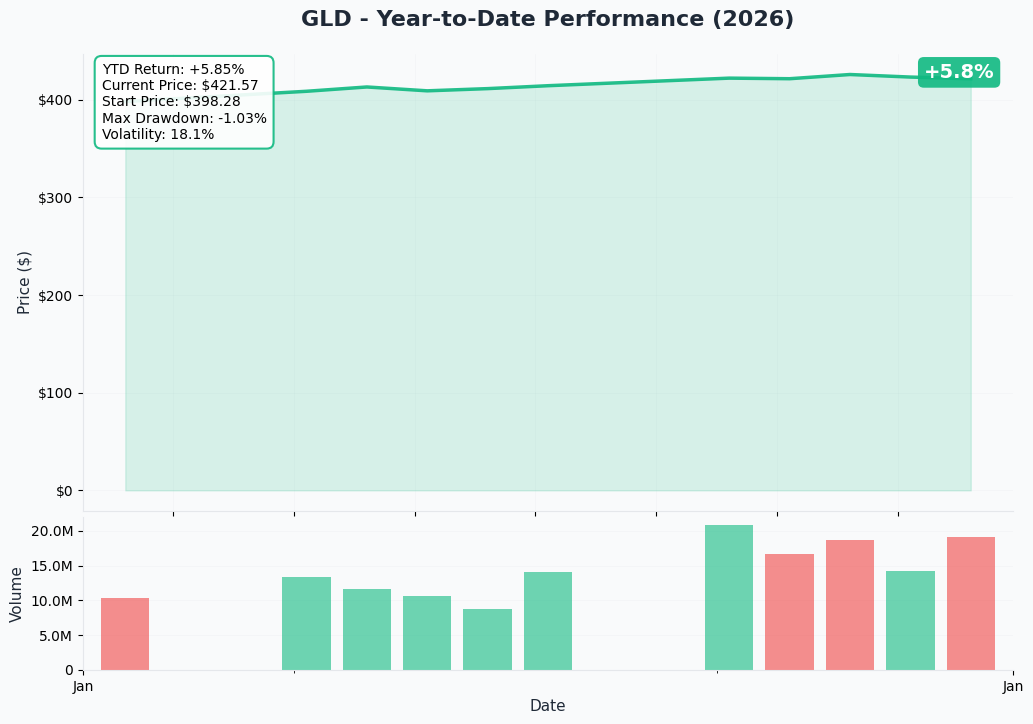
- Current Price: $422.18 (at time of trade)
- Gold Spot Price: ~$4,560/oz
- All-Time High: $4,642.58/oz (January 14, 2026)2
- AUM: $160B+1
- Expense Ratio: 0.40%3
- 52-Week Range: $249.15 - $426.864
- 2025 Performance: +64% (best year since 1979)5
- YTD 2026: +6%6
Why This Trade Matters
The Setup
Gold just hit an all-time high of $4,642.58 on January 14th2 - that's 2 days ago. After a 64% rip in 2025 and another 6% gain in the first two weeks of 2026, someone with $12.9 million is betting on a pullback.
The $400 strike represents a 5.3% decline from current levels. With 63 days until March 20th expiration (Triple Witch), this trade needs gold to drop roughly $22/share - or about $240/oz in gold terms - to break even at expiration.
Unusualness Assessment
Premium Context: $12.9 million is the size of a small hedge fund's entire gold allocation, not a single trade. For perspective:
- This equals roughly 24,847 contracts worth of new positioning
- Volume exceeded existing open interest by 2x on the day
- The buyer accepted immediate fills across two orders, signaling urgency
Historical Rarity: Block trades of this magnitude on GLD puts are extraordinarily rare. The combination of size, urgency (two fills in under a minute), and timing (2 days after all-time highs) suggests informed institutional conviction.
Catalyst Analysis
What Could Drive This Trade?
1. Technical Overextension
Gold's 64% rally in 2025 followed by 6% more in 2026 has stretched the metal far above any reasonable moving average. After hitting $4,642.58 on January 14th, we've already seen a 1% pullback to $4,560.7 Classic profit-taking behavior could accelerate.
2. FOMC Meeting (January 27-28)
Markets are pricing a 95% probability of rates holding steady.8 If the Fed sounds hawkish or signals fewer cuts than expected, gold loses a key tailwind. The "well positioned to wait" language from Powell in December raised the bar for further easing.9
3. Geopolitical De-escalation Risk
Gold's recent surge has been turbocharged by:
Any diplomatic resolution to these flashpoints could trigger a rapid safe-haven unwind. As Matthew Miskin of Manulife noted: "Gold prices are just screaming that markets are concerned about geopolitical risk."12 If that risk premium evaporates, so does $200-300/oz.
4. Dollar Bounce Potential
The DXY is down 9.27% over 12 months13, but analysts project a "V-shaped" recovery with potential bounce to 94 in Q2 before year-end.14 A strengthening dollar directly pressures gold.
5. Central Bank Buying Slowdown
Central banks purchased 1,045 tonnes in 202415, but 2026 projections show 755 tonnes - a meaningful deceleration.16 If monthly purchases fall below 50 tonnes, it would signal structural demand softening.17
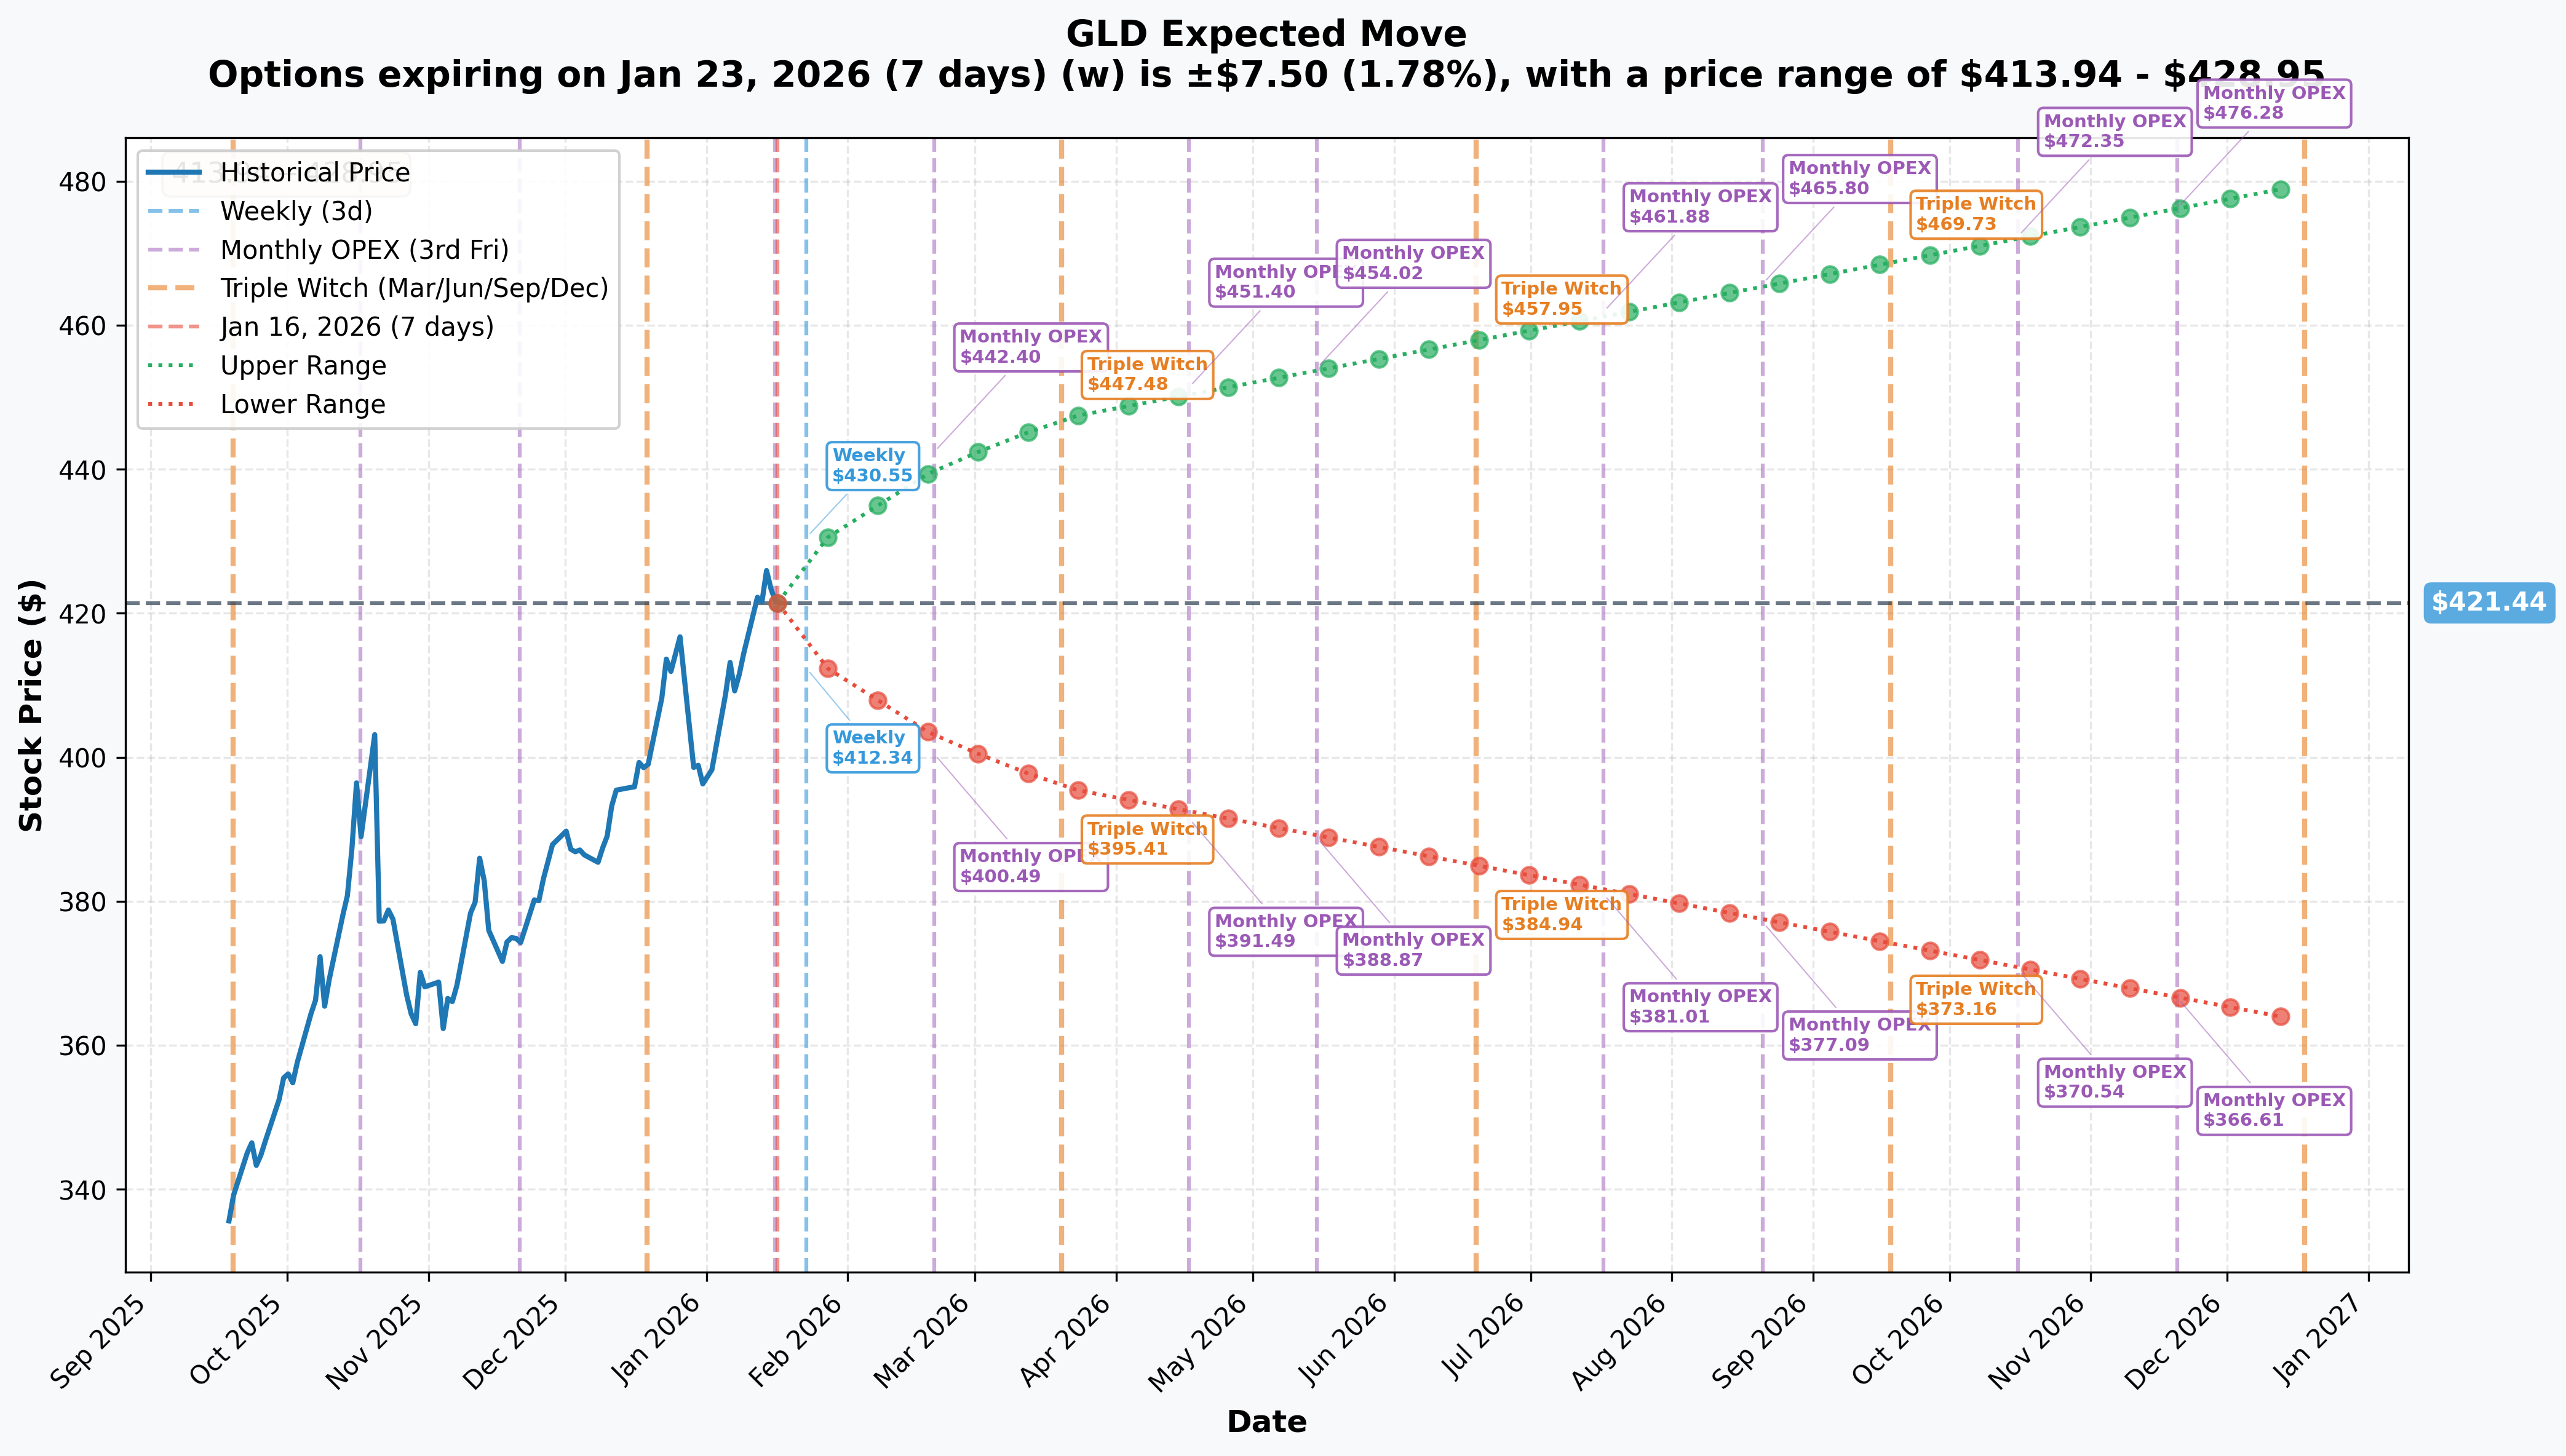
Implied Move Analysis
Based on current options pricing, here's what the market expects:
| Timeframe | Expiry | Implied Move | Range |
|---|---|---|---|
| Weekly | 2026-01-23 | +/-1.78% | $413.94 - $428.95 |
| Monthly | 2026-02-20 | +/-4.44% | $402.72 - $440.17 |
| Quarterly (Trade Expiry) | 2026-03-20 | +/-6.09% | $395.77 - $447.12 |
| Yearly | 2026-12-18 | +/-13.8% | $363.28 - $479.61 |
The $400 strike sits just above the lower bound of the 1-sigma implied move range ($395.77). This trade is betting on a move to the edge of expected distribution - aggressive but not outlandish.
Gamma & Support/Resistance Levels
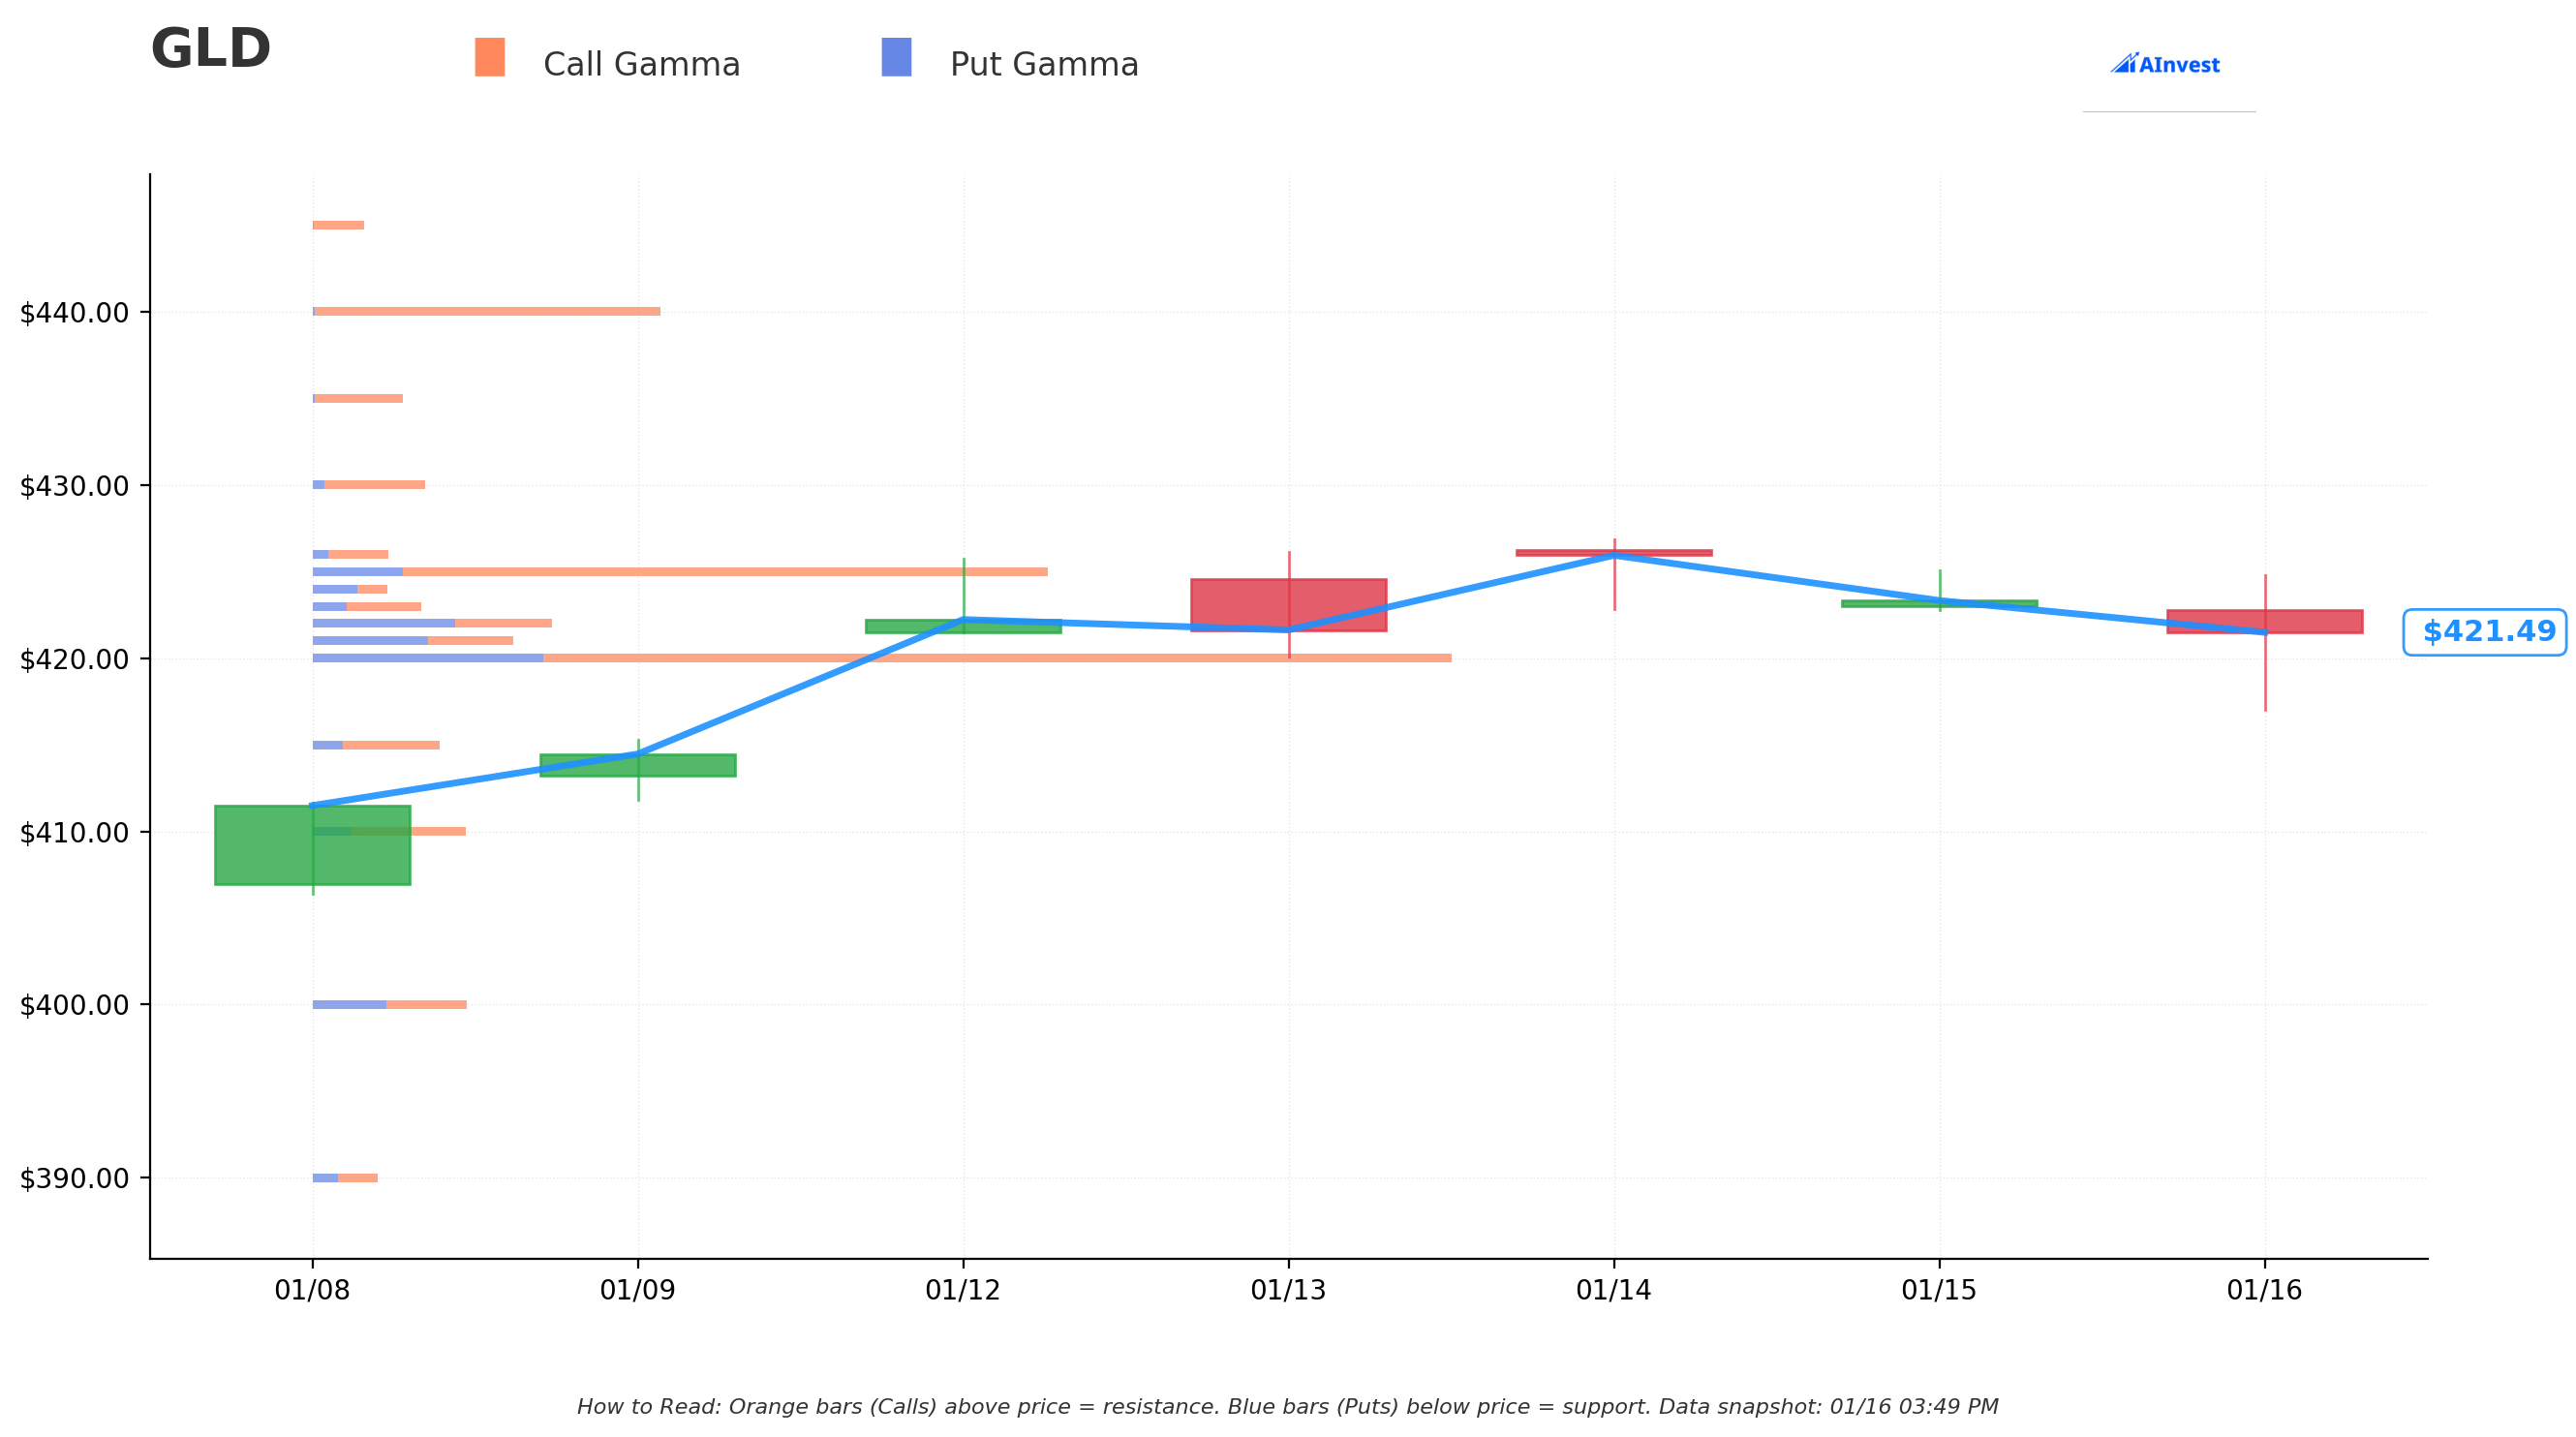
Key Levels to Watch:
| Level | Significance | Price |
|---|---|---|
| All-Time High | Recent Peak | $426.86 |
| Current Price | Trade Entry | $422.18 |
| Psychological Support | Round Number | $420.00 |
| Put Strike | Breakeven Target | $400.00 |
| Implied Move Low | 1-Sigma Downside | $395.77 |
| Bear Case Support | Major Floor | $380.00 |
Price Targets & Probabilities
Target 1: $410 (Mild Pullback)
Probability: 45%
A garden-variety 3% correction from recent highs. This level represents:
- Profit-taking after record run
- Normal volatility without catalyst
- Put position shows modest profit (~$3/contract gain)
Catalyst: Quiet FOMC, no geopolitical surprises, gradual consolidation.
Target 2: $400 (Trade Breakeven)
Probability: 30%
The strike price itself. A 5.3% decline would require:
- Fed hawkish surprise or rate hike threat
- Diplomatic progress on Iran/Venezuela/Greenland
- Dollar strength materializing
- Put position profitable (intrinsic value kicks in)
Catalyst: Multiple bearish factors converging - hawkish Fed + geopolitical de-escalation + dollar bounce.
Target 3: $385 (Full Bearish Scenario)
Probability: 15%
A 9% correction back to late-2025 levels. This would require:
- "Risk-on" market environment returning
- Complete geopolitical de-escalation
- Fed hiking or maintaining rates through 2026
- Major ETF outflows
- Put position highly profitable (~$15/contract intrinsic)
Catalyst: Black swan positive event (peace deals, inflation solved, growth reaccelerates).
Upside Scenario: $440+ (Trade Failure)
Probability: 10%
Gold continues ripping toward Wall Street's $4,900-$5,000 targets.1819 The $400 puts expire worthless, losing the full $12.9M premium.
Catalyst: Escalating geopolitical crisis, Powell removal, dollar collapse, central bank buying acceleration.
Trading Strategies
Conservative: Protective Puts for Gold Bulls
If you're long GLD and this trade has you worried, consider downside protection.
Trade:
- Buy GLD March 20 $410 Put @ ~$8.00
- Cost: $800 per contract
Rationale: You stay long gold's uptrend but have a floor 3% below current levels. If the big money is right about a pullback, you're protected. If gold keeps running, you lose the premium but participate in gains.
Max Risk: Premium paid Breakeven: $402 at expiration Best For: Nervous bulls who want insurance
Balanced: Put Spread Replication
Mirror the institutional thesis with defined risk.
Trade:
- Buy GLD March 20 $400 Put @ $5.35
- Sell GLD March 20 $385 Put @ $2.10
- Net Debit: $3.25 ($325 per spread)
Rationale: You're betting on the same $400 breakdown but capping your max profit at $15 (the spread width). Your cost basis is 40% lower than naked puts.
Max Risk: $325 per spread Max Profit: $1,175 per spread (at $385 or below) Breakeven: $396.75 Best For: Tactical bears who want to express conviction efficiently
Aggressive: Fade the Fade (Contrarian Bull)
Bet that this institutional put buyer is wrong and gold continues higher.
Trade:
- Sell GLD March 20 $400 Put @ $5.35
- Collect: $535 per contract
Rationale: If you believe gold's structural bull market is intact and $400 won't be touched, you pocket the rich premium. This is essentially the opposite side of the block trade.
Max Risk: Assignment at $400 (buy 100 shares at $400) Max Profit: $535 per contract (put expires worthless) Breakeven: $394.65 (strike minus premium) Best For: Aggressive gold bulls with capital to back assignment
Warning: This is an undefined risk trade. If gold crashes to $380, you're buying at $400 and immediately underwater.
Risk Factors
Why This Trade Could Be Wrong
-
Gold's Structural Bull Market: Central banks are still buying 750+ tonnes annually.16 The de-dollarization trend hasn't reversed.
-
Geopolitical Uncertainty Persists: Venezuela, Iran, and Greenland disputes could escalate rather than de-escalate, driving further safe-haven flows.
-
Fed Cutting Cycle: Even if January holds, markets expect cuts by June 2026.8 Lower rates support gold.
-
Dollar Weakness Trend: The DXY's worst year since 2017 may continue if U.S. growth disappoints.20
-
Inflation Above Target: With CPI at 2.7%21 and tariff-driven price pressures ahead, gold's inflation hedge appeal remains relevant.
-
Wall Street Consensus: Every major bank targets $4,500-$5,000+ gold by year-end.181922
Why This Trade Could Be Right
-
Technical Overextension: 64% gain in 2025 + 6% in 2026 = mean reversion risk.
-
Sentiment Extreme: When everyone is bullish, who's left to buy?
-
ETF Flow Vulnerability: Part of the rally is momentum-driven ETF positioning that could reverse sharply.23
-
Safe Haven Correlation Shift: Academic research suggests gold's safe-haven properties may be diminishing.24
-
Expense Ratio Drag: GLD's 0.40% fee creates gradual erosion of NAV.3
The Bottom Line
A $12.9 million put accumulation on GLD two days after all-time highs is a meaningful institutional signal. The buyer split their order into two fills within a minute, suggesting urgency and conviction. They're targeting a 5.3% pullback to $400 by March Triple Witch expiration.
The thesis makes sense: Gold is technically overextended after a historic 70%+ run, and multiple catalysts (Fed hawkishness, geopolitical de-escalation, dollar bounce) could trigger profit-taking.
But the timing is risky: Fighting a structural bull market with unprecedented central bank buying and multiple geopolitical flashpoints is contrarian by definition.
Action Plan
If You're Neutral on Gold:
- This is a "watch and wait" situation
- Monitor the January 27-28 FOMC meeting for hawkish signals
- Track geopolitical headlines for de-escalation signs
- Consider the balanced put spread if you want to express a tactical bearish view with defined risk
If You're Long Gold:
- Don't panic-sell based on one trade
- Consider adding protective puts if you're nervous
- Remember: institutional trades are often hedges, not directional bets
- Wall Street consensus remains bullish ($4,900-$5,000 targets)
If You're Looking to Short Gold:
- The put spread replication strategy offers defined risk
- Wait for confirmation (break below $415) before aggressive positioning
- Respect that you're fighting a trend backed by central bank structural buying
Key Dates to Watch:
- January 27-28: FOMC meeting (95% chance of hold, watch statement language)
- February 11: January CPI release
- March 20: Options expiration (Triple Witch)
Analysis generated by OptionLabs. Options involve risk and are not suitable for all investors. This is not financial advice.
References
Footnotes
-
24/7 Wall St., "GLD's $141 Billion Rally Hinges on Continued Central Bank Buying", December 15, 2025 ↩ ↩2
-
Nasdaq, "Gold Price Hits New Record, Breaks US$4,600", January 14, 2026 ↩ ↩2
-
State Street Global Advisors, "SPDR Gold Shares (GLD)", January 2026 ↩ ↩2
-
Investing.com, "GLD Stock Price | SPDR Gold Shares ETF", January 16, 2026 ↩
-
The Motley Fool, "Should You Buy SPDR Gold ETF After Its 64% Rally in 2025?", January 10, 2026 ↩
-
CNBC, "Gold smashes new record of $4,600", January 12, 2026 ↩
-
Fortune, "Current price of gold: January 16, 2026", January 16, 2026 ↩
-
CNN Business, "The Fed is unlikely to cut interest rates any time soon", January 13, 2026 ↩ ↩2
-
CBS News, "Federal Reserve lowers its benchmark interest rate", December 2025 ↩
-
CNBC, "Markets aren't fazed by Iran, Greenland or Venezuela", January 16, 2026 ↩ ↩2
-
CNBC, "Gold and silver surge as geopolitics heat up", January 15, 2026 ↩
-
CNBC, "Gold tops $4,600/oz as Fed uncertainty fans safe-haven rush", January 12, 2026 ↩
-
Trading Economics, "United States Dollar", January 16, 2026 ↩
-
Cambridge Currencies, "US Dollar Forecast 2026", January 2026 ↩
-
World Gold Council, "Central Banks Gold Reserves by Country", January 2026 ↩
-
State Street, "Gold 2026 Outlook: Can the structural bull cycle continue?", January 2026 ↩ ↩2
-
SPDR Gold Shares, "Performance", January 2026 ↩
-
TheStreet, "Goldman Sachs quietly revamps gold price target for 2026", January 2026 ↩ ↩2
-
J.P. Morgan, "Gold price predictions from J.P. Morgan Global Research", January 2026 ↩ ↩2
-
Morningstar, "What a Weaker US Dollar Means for Investors in 2026", January 2026 ↩
-
CNN Business, "Inflation remained at 2.7% in December", January 13, 2026 ↩
-
Kitco News, "Gold will be the primary hedge and performance driver in 2026", January 5, 2026 ↩
-
Nasdaq, "3 Best Gold ETF Picks for 2026", January 2026 ↩
-
ScienceDirect, "The diminishing lustre: Gold's market volatility", January 2026 ↩