🥇 GLD: Whale Battle Royale - $50M in Conflicting Bets on Gold's Next Move!
📅 January 23, 2026 | 🔥 Unusual Activity Detected
🎯 The Quick Take
Two institutional heavyweights just threw down $50M in total bets on GLD today - and they're fighting each other! First, someone loaded up a $25M bull call spread betting gold breaks higher by Monday. Then, just 45 minutes later, another whale deployed a $25M bear call spread essentially betting against that exact move. With gold sitting at all-time highs near $5,000/oz and geopolitical tensions running hot, this battle of the titans could signal a major inflection point. 👀
📊 About GLD (SPDR Gold Shares ETF)
GLD is the world's largest physically-backed gold ETF, launched by State Street Global Advisors in 2004. The trust holds actual gold bullion stored as London Good Delivery bars (400 oz each) in secure vaults worldwide. With $168.9B in assets under management and unmatched liquidity, GLD is the go-to vehicle for institutional gold exposure.
| Metric | Value |
|---|---|
| Current Price | $457.66 |
| AUM | $168.89B |
| Expense Ratio | 0.40% |
| 1-Year Return | +80.75% |
| 52-Week Range | $251.92 - $456.39 |
| Category | Commodities - Physical Gold |
💰 The Option Flow Breakdown
📊 What Just Happened
Two distinct strategies deployed within 45 minutes of each other - same expiration, overlapping strikes, completely opposite directional bets!
Strategy 1 - BULL CALL SPREAD (12:56:50 ET):
| Leg | Strike | Expiry | Volume | Premium | Action | Activity Level |
|---|---|---|---|---|---|---|
| Long Call | $444 | 2026-01-26 | 10,000 | $13M | BTO | ~80x normal ⚡ EXTREMELY UNUSUAL |
| Short Call | $445 | 2026-01-26 | 10,000 | $12M | STO | ~31x normal |
Net Debit: ~$1M | Max Profit: ~$9M | Breakeven: ~$444.10
Strategy 2 - BEAR CALL SPREAD (13:41:41 ET):
| Leg | Strike | Expiry | Volume | Premium | Action | Activity Level |
|---|---|---|---|---|---|---|
| Short Call | $445 | 2026-01-26 | 20,000 | $13M | STO | ~62x normal |
| Long Call | $446 | 2026-01-26 | 10,000 | $12M | BTO | ~40x normal |
Net Credit: ~$1M | Max Profit: Credit received | Max Loss: ~$9M | Breakeven: ~$445.10
🤓 What This Actually Means
Plot twist! These aren't just two random trades - they're potentially connected:
🟢 The Bull: The first trader paid ~$1M to control 1 million shares worth of gold exposure, betting GLD stays above $444 through Monday. With current price at $457.66, these calls are deep in the money - this is a leveraged bullish play that profits as long as gold doesn't crash 3%+ by expiration.
🔴 The Bear: The second trader collected premium by selling the $445 calls (DOUBLE the volume!) while hedging with $446 calls. This is a bearish credit spread betting GLD either stays flat or pulls back. The 20,000 contracts sold at $445 (vs 10,000 bought at $446) suggests they might be closing out the bull's position or scaling into a larger bearish bet.
The Activity Levels Tell the Story:
- The $444 calls saw roughly 80x normal volume - a few times a year event
- The $445 calls saw roughly 62x normal volume
- These aren't retail traders - this is institutional capital taking positions
Key Insight: Both spreads expire in just 3 days (Monday, January 26). This is a battle for the weekend - whoever's right collects, whoever's wrong gets crushed.
📈 Technical Setup & Chart Analysis
YTD Chart Analysis
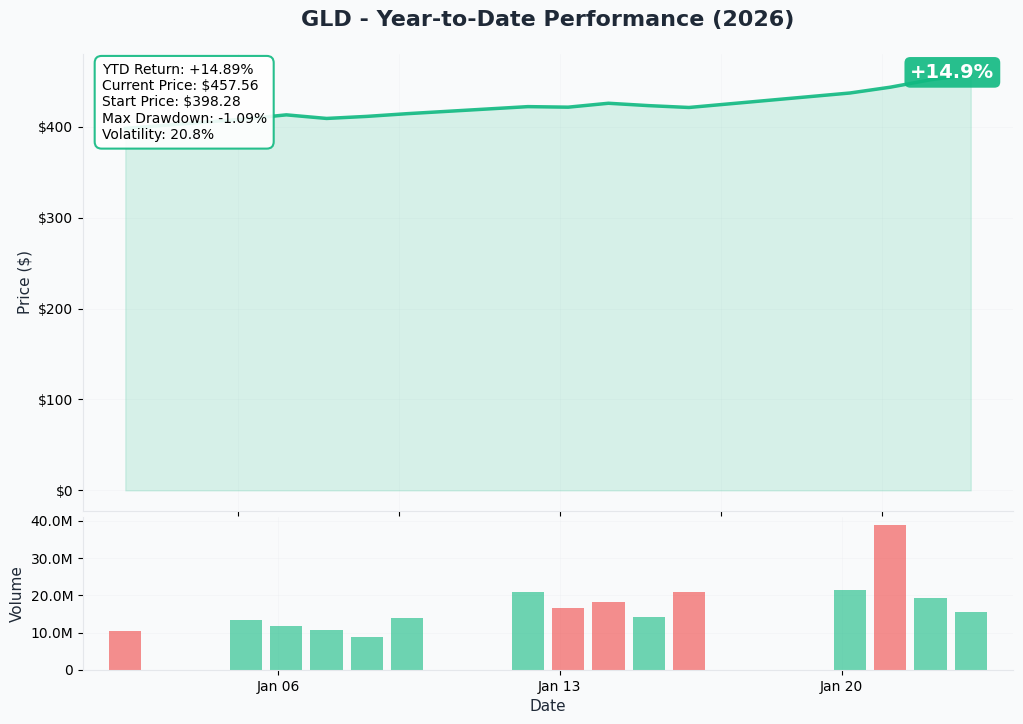
GLD has been on an absolute tear in 2026, up over 10% year-to-date following a monster 64% gain in 2025. The ETF just printed fresh all-time highs with gold spot pushing toward the psychological $5,000/oz barrier. However, the RSI at 73.54 screams overbought, and price is stretched 25% above the 200-day moving average - historically a zone where mean reversion becomes increasingly likely.
📊 Gamma-Based Support & Resistance
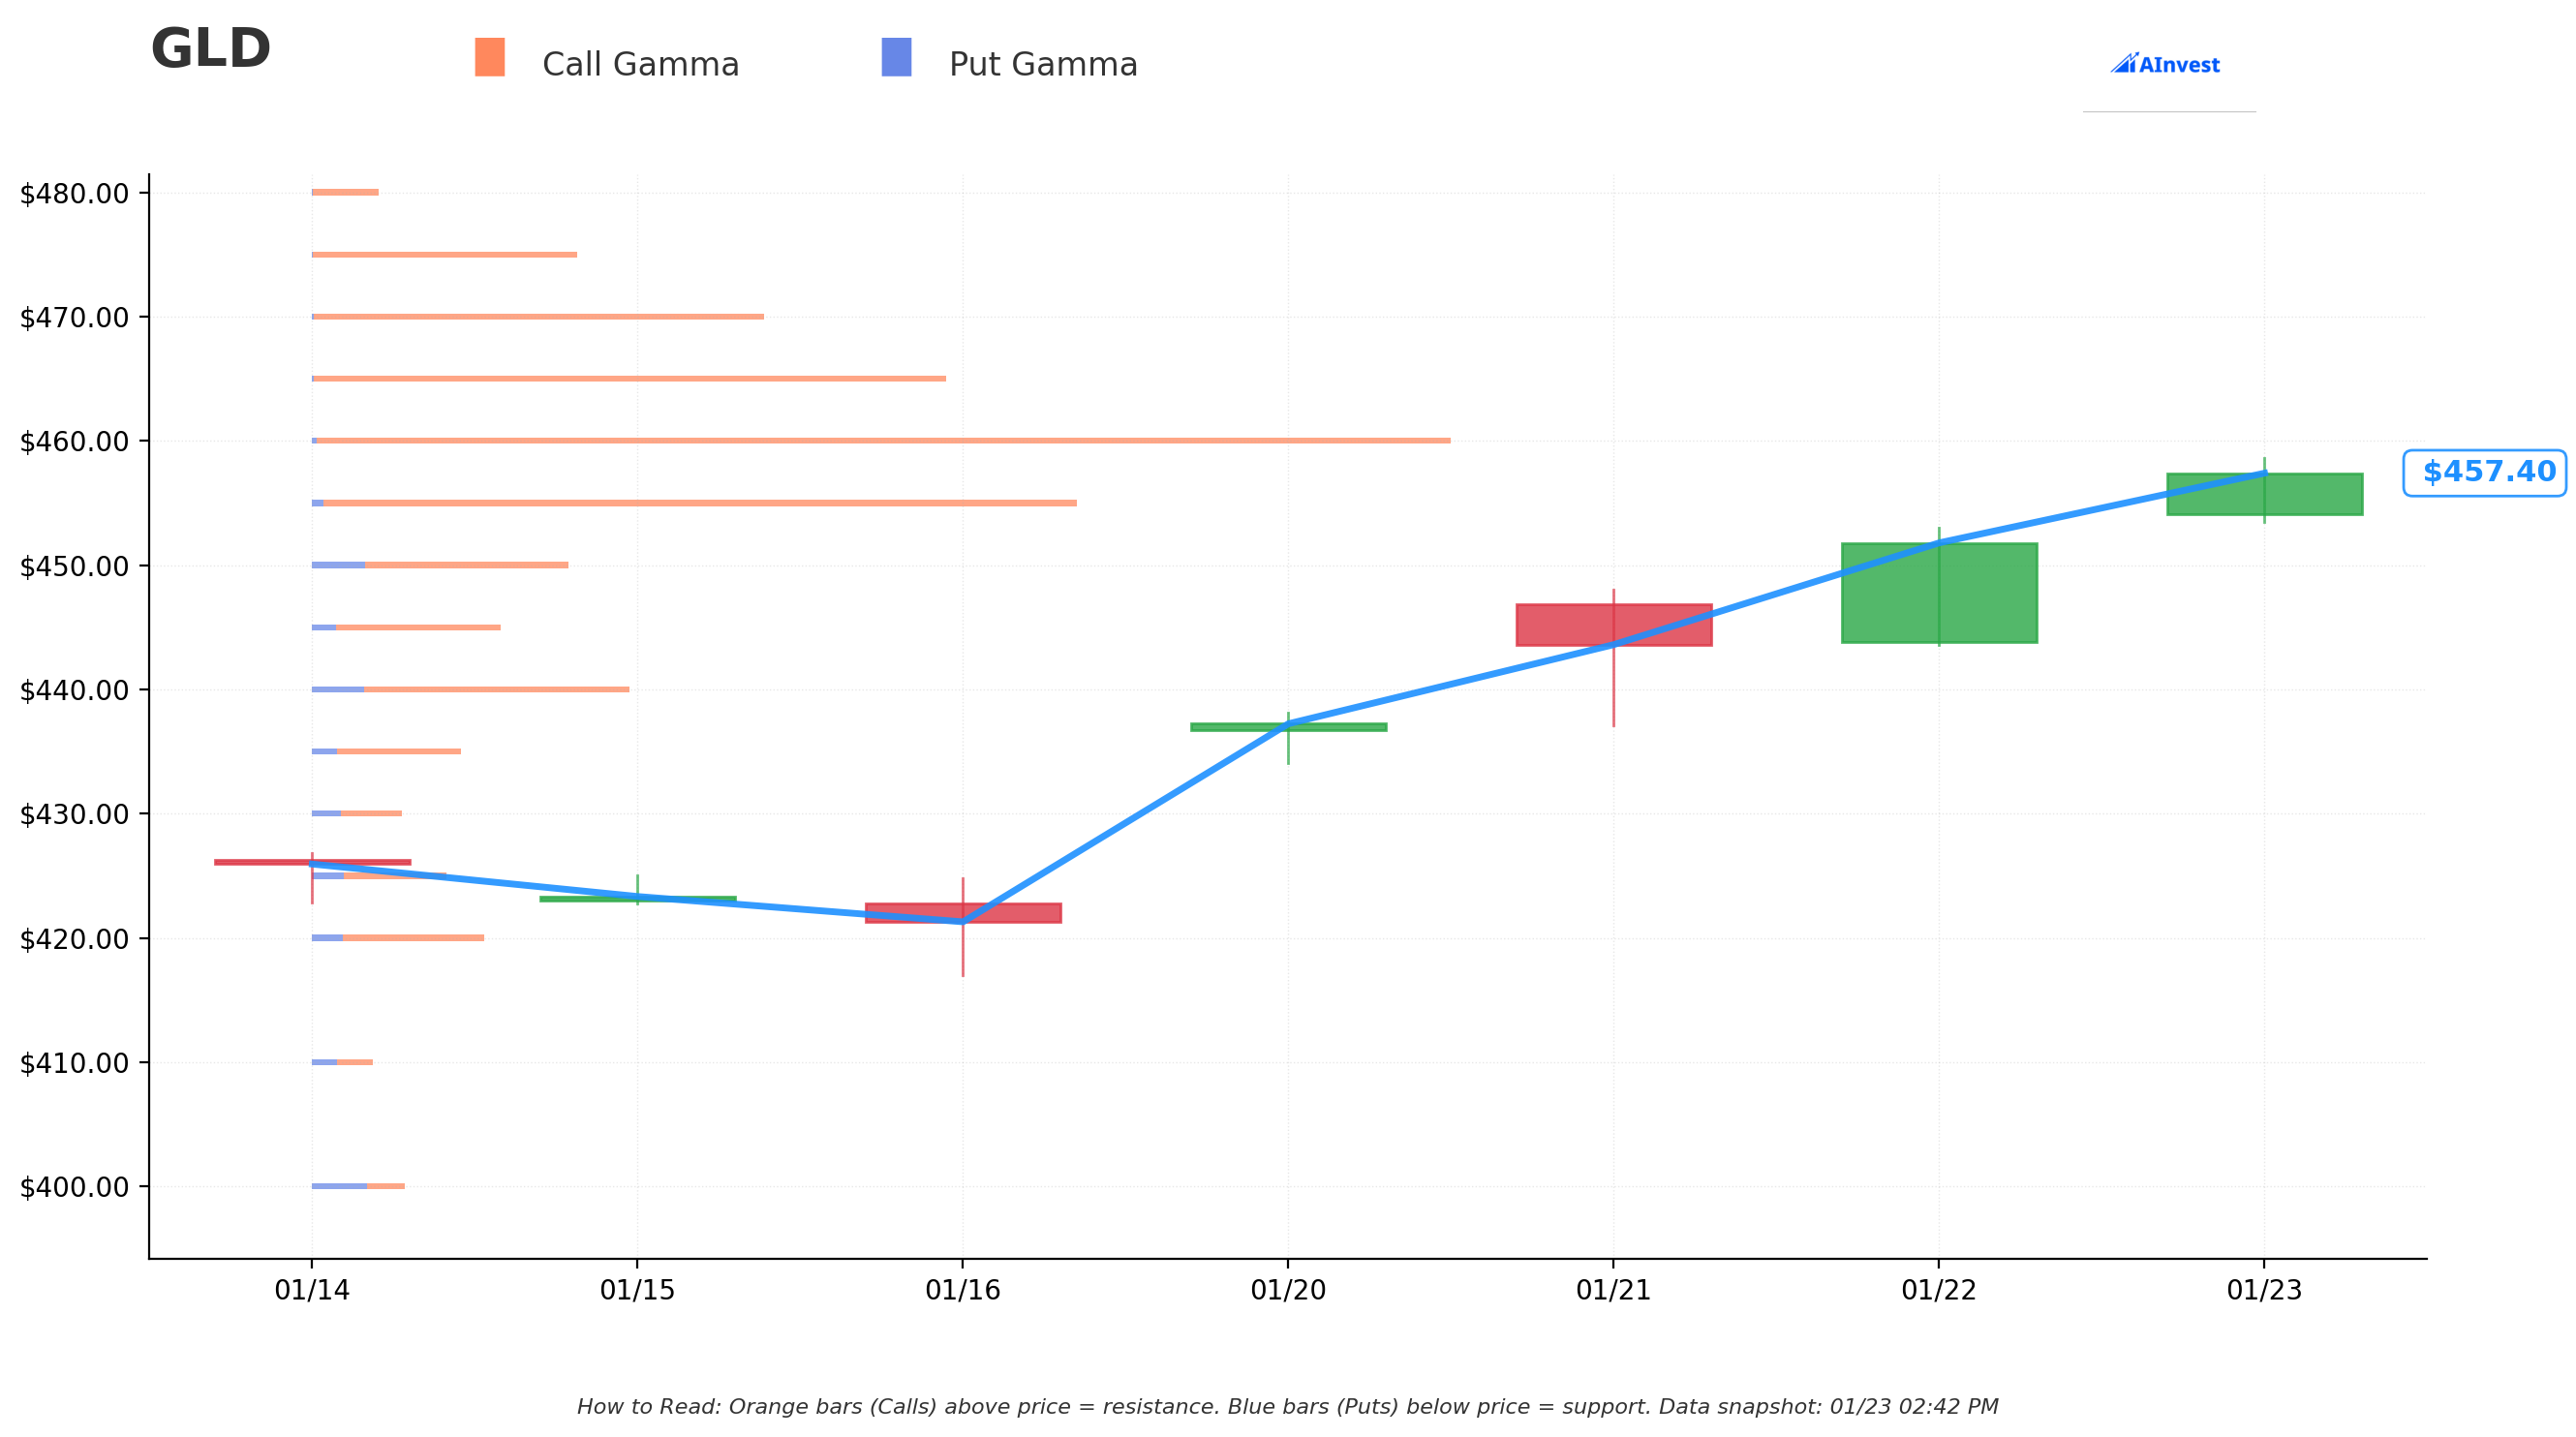
Current Price: $457.66 | Net GEX Bias: BULLISH 🟢
The gamma profile shows overwhelming call-side positioning, creating a "gamma wall" effect:
Resistance Levels (Call Gamma):
| Strike | Distance | Gamma Strength | Significance |
|---|---|---|---|
| $460 | +0.5% | 🟠🟠🟠🟠🟠 | Strongest Resistance - Major dealer hedging zone |
| $465 | +1.6% | 🟠🟠🟠🟠 | Secondary resistance |
| $470 | +2.7% | 🟠🟠🟠 | Extended target |
| $475 | +3.8% | 🟠🟠 | Bull case ceiling |
Support Levels (Put Gamma):
| Strike | Distance | Gamma Strength | Significance |
|---|---|---|---|
| $455 | -0.6% | 🔵🔵🔵🔵🔵 | Strongest Support - Nearest floor |
| $450 | -1.7% | 🔵🔵🔵 | Secondary support |
| $445 | -2.8% | 🔵🔵 | The spread strike zone! |
| $440 | -3.9% | 🔵🔵🔵 | Strong support cluster |
| $425 | -7.1% | 🔵🔵 | Bear case floor |
Gamma Translation for Regular Folks: The massive call gamma at $460 means market makers are heavily short calls there. If GLD pushes toward $460, dealers need to buy shares to hedge, creating a "magnetic" pull toward that level. Conversely, the put support at $455 acts as a cushion - dealers buying on dips to hedge their put exposure.
Key Insight: Total Call GEX (1,514) vs Put GEX (184) = 8:1 ratio! This extreme bullish positioning typically supports prices but also creates crowded trade risk.
📉 Implied Move Analysis
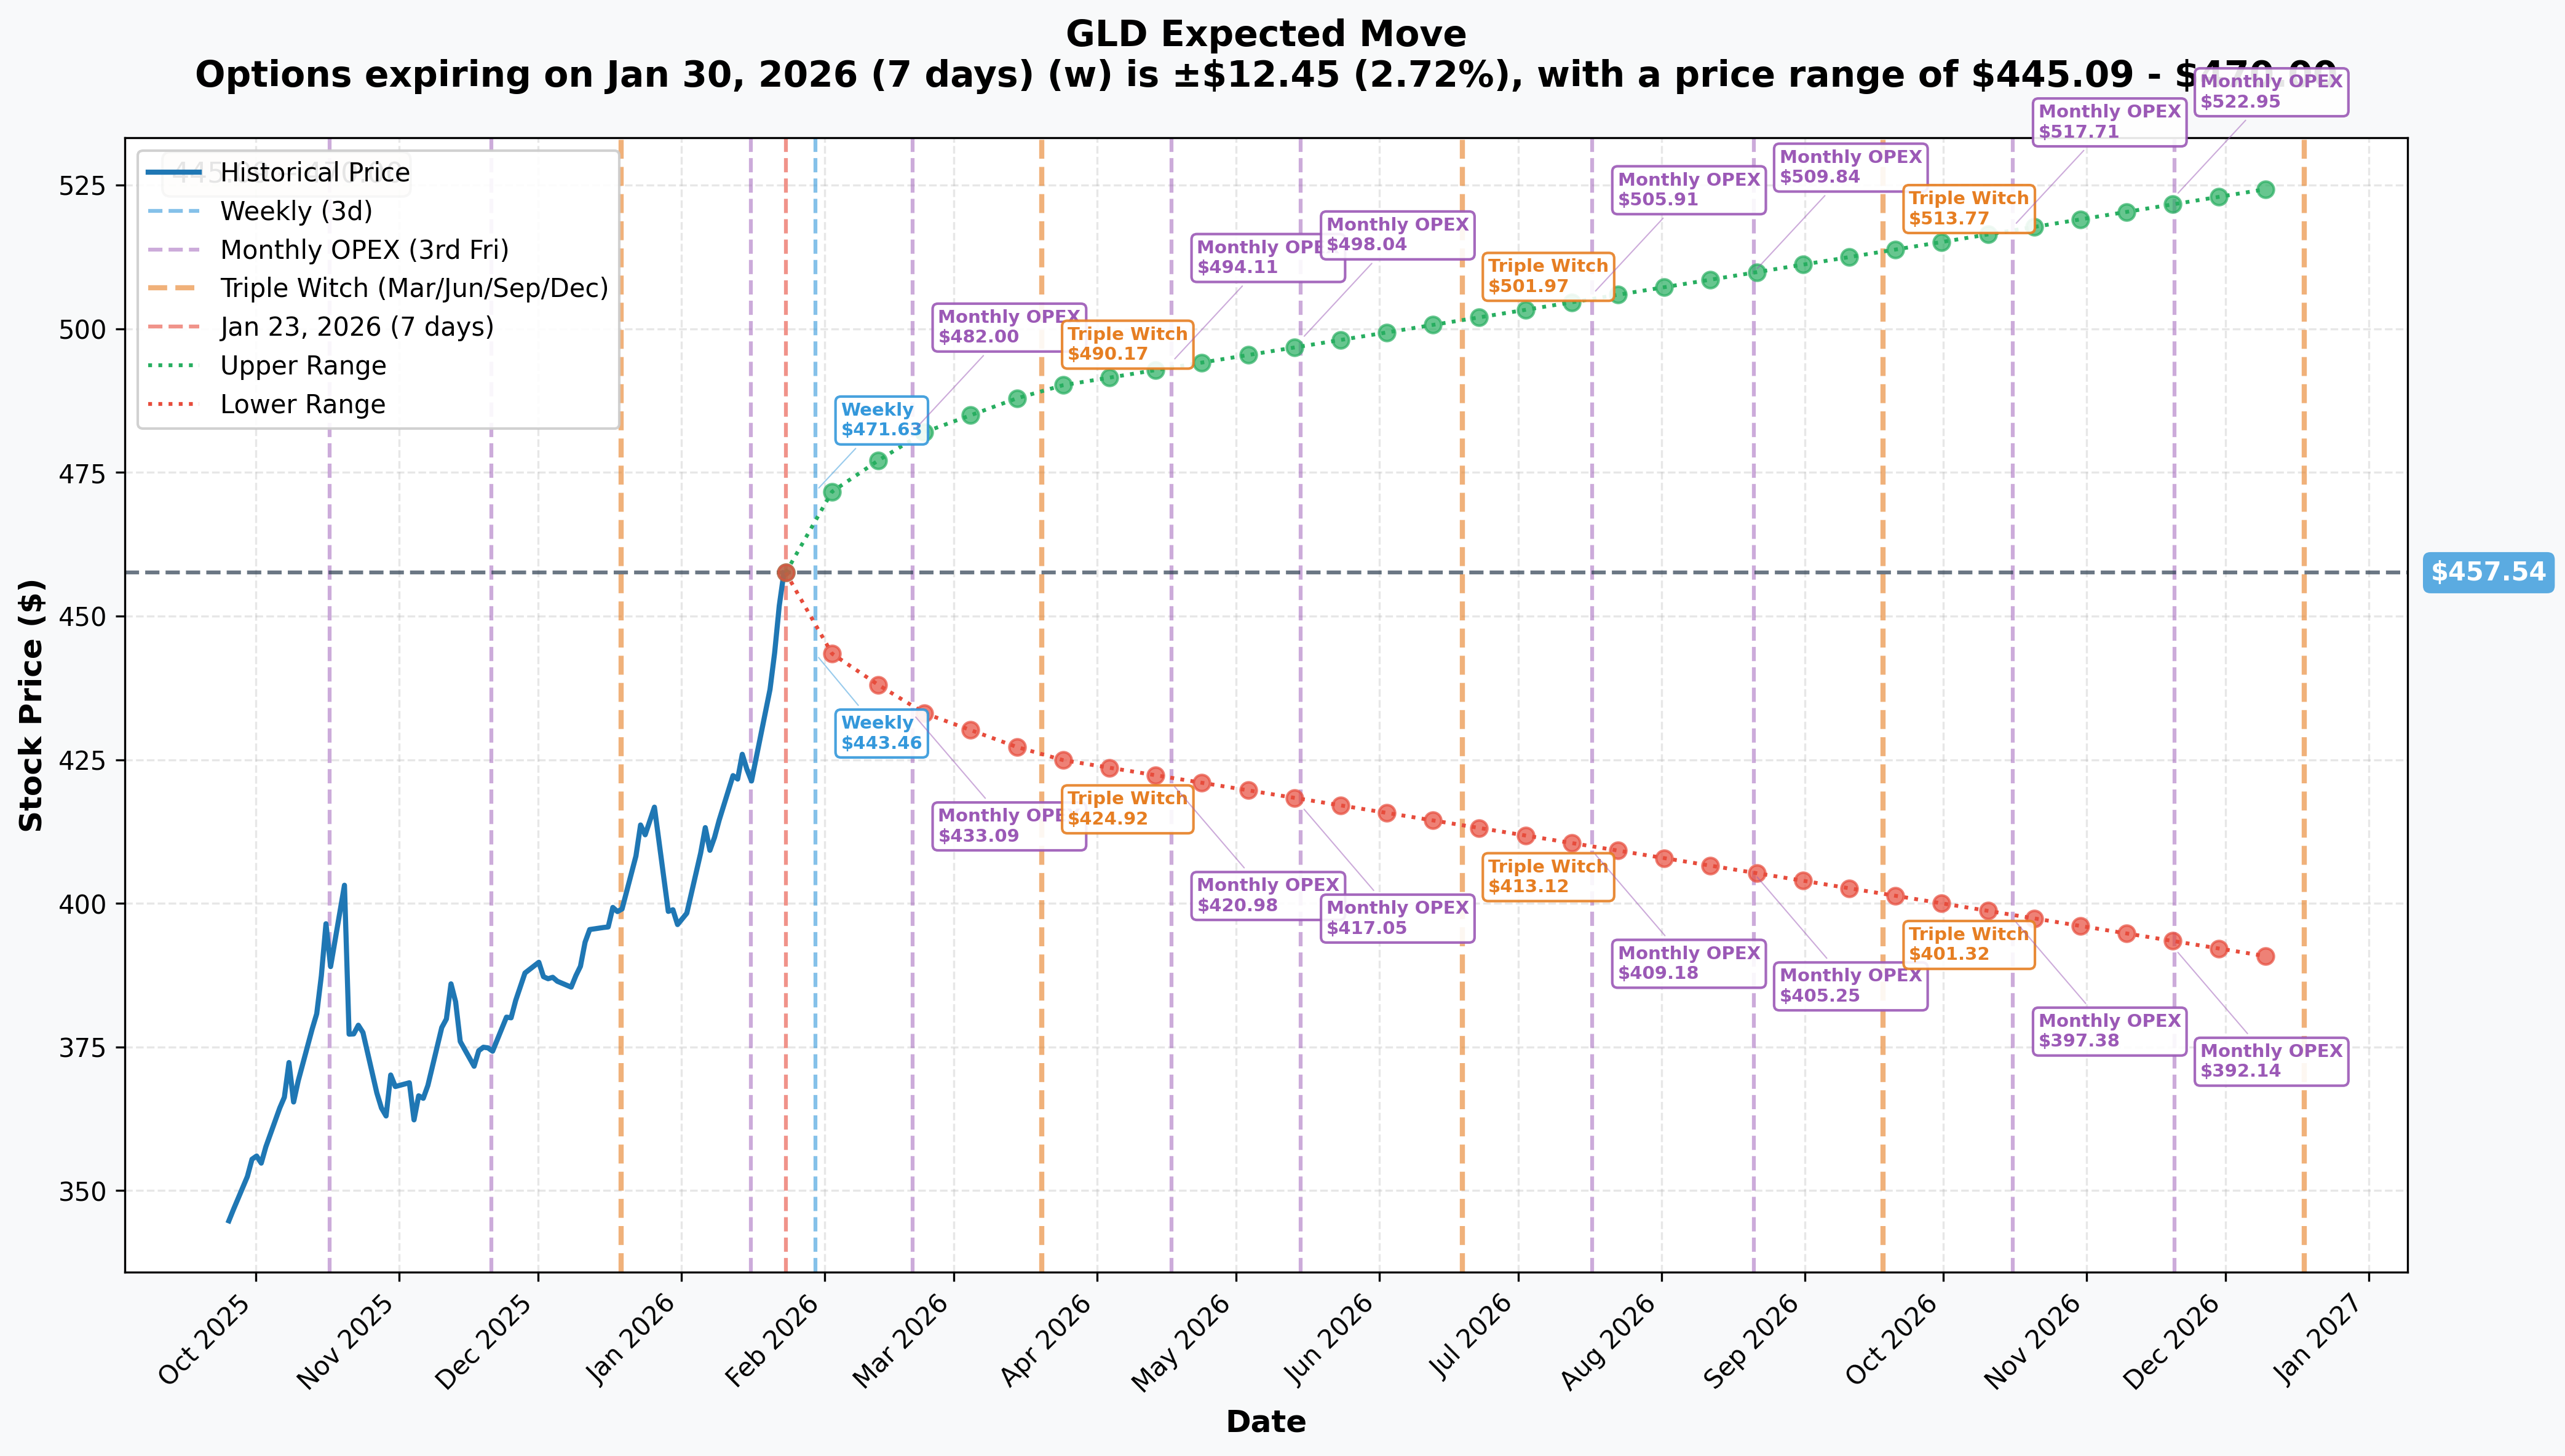
The options market is pricing in the following expected moves:
| Timeframe | Expiry | Implied Move | Range |
|---|---|---|---|
| Weekly | Jan 30 | ±2.72% | $445.09 - $470.00 |
| Monthly OPEX | Feb 20 | ±5.22% | $433.68 - $481.41 |
| Quarterly | Mar 20 | ±7.02% | $425.44 - $489.65 |
| Yearly LEAPS | Dec 18 | ±14.84% | $389.65 - $525.44 |
What This Means: The market expects GLD to stay between $445-$470 through next week with 68% probability. Notice how both spread strategies are positioned right at that lower boundary ($444-$446 strikes) - these traders are betting on whether GLD breaches or holds that floor!
🎪 Catalysts
📅 Upcoming Events (Next 30 Days)
| Date | Event | Impact |
|---|---|---|
| Jan 26 | Options Expiration (spreads) | HIGH - Winner takes all |
| Jan 28-29 | FOMC Meeting | HIGH - Rate decision |
| Feb 1 | Trump Greenland Tariffs (10%) | MEDIUM - Safe-haven flow |
| Feb 7 | Jobs Report | MEDIUM - Fed implications |
| Feb 20 | Monthly OPEX | MEDIUM - Position unwinding |
📰 Recent Events (Driving Current Rally)
According to CNBC's coverage, gold's surge to near $5,000/oz has been fueled by:
- 🔥 Venezuela Military Intervention (Jan 3) - US seized 161 metric tons of Venezuelan gold, sparking "crisis of trust" in sovereign immunity
- 🔥 Iran Civil Uprising (Dec 28-present) - Rial collapse, thousands of casualties, regional instability
- 🔥 Trump Greenland Tariffs (Jan 18) - Triggered "Sell America" trade, gold's biggest one-day gain since 2020
- 🔥 Powell Investigation - Fed uncertainty adding policy risk premium
- 🔥 Central Bank Buying - 1,000+ tonnes annually since 2022, China buying nearly $1B from Russia
🎲 Price Targets & Probabilities
Based on gamma positioning, implied moves, and catalyst analysis:
🐂 Bull Case: $470-$475 (25% probability)
Trigger: Geopolitical escalation or Fed dovish surprise
- Weekly implied move upper bound: $470
- Strong gamma resistance at $475
- Requires break above $460 dealer wall
- Both spreads profitable but bull spread captures max gain
⚖️ Base Case: $455-$465 (55% probability)
Trigger: Status quo, range-bound trading
- Price gravitates toward high gamma zone ($455-$460)
- Strongest support/resistance within 1% of current price
- Bull spread profitable, bear spread also collects premium
- Most likely outcome given positioning
🐻 Bear Case: $440-$450 (20% probability)
Trigger: Risk-on rotation, geopolitical de-escalation, profit-taking
- RSI overbought at 73.54 signals correction risk
- Price 25% above 200-DMA = extreme extension
- World Gold Council warns of 5-20% correction risk
- Bear spread highly profitable, bull spread underwater
💡 Trading Ideas
🛡️ Conservative: "Gold's Safety Net" (Iron Condor)
The Setup:
- Sell Feb 20 $440 Put
- Buy Feb 20 $435 Put
- Sell Feb 20 $480 Call
- Buy Feb 20 $485 Call
Why This Works: Gold is in a strong uptrend but stretched. This iron condor profits from the 55% base case where GLD stays between $440-$480 through February OPEX. The $440 lower strike aligns with strong gamma support, while $480 sits below the implied move upper bound ($481.41).
| Metric | Value |
|---|---|
| Max Profit | ~$180-220 per spread |
| Max Risk | ~$280-320 per spread |
| Win Rate | ~65-70% |
| Ideal For | Income traders, volatility sellers |
⚖️ Balanced: "Ride the Golden Wave" (Call Debit Spread)
The Setup:
- Buy Feb 20 $460 Call
- Sell Feb 20 $475 Call
Why This Works: If you're bullish on gold's macro setup (geopolitical uncertainty, central bank buying, Fed cuts) but don't want to overpay for premium, this spread captures upside to the quarterly implied move target while capping risk. The $460 strike sits at the strongest resistance - a break above unlocks the path to $475.
| Metric | Value |
|---|---|
| Entry Cost | ~$4-5 per spread |
| Max Profit | ~$10-11 per spread |
| Breakeven | ~$464-465 |
| Win Rate | ~40-45% |
| Ideal For | Directional bulls with defined risk |
🚀 Aggressive: "Follow the Whale" (Naked Put Sale)
The Setup:
- Sell Feb 20 $440 Put (naked or cash-secured)
Why This Works: This is essentially betting gold doesn't crash 4%+ in the next month. The $440 strike sits at strong gamma support with 90.78 total GEX - dealers will aggressively buy dips here. You're getting paid to potentially own GLD at a 4% discount during a generational gold bull market. J.P. Morgan projects $5,000+ gold by year-end.
| Metric | Value |
|---|---|
| Premium Collected | ~$3-4 per contract |
| Margin Required | ~$4,400 |
| Return on Capital | ~6-8% in 28 days |
| Win Rate | ~80-85% |
| Ideal For | Premium sellers with capital, bullish bias |
⚠️ Warning: Naked puts carry significant risk if gold crashes. Only for experienced traders with adequate capital!
⚠️ Risk Factors
🔴 Immediate Risks (Next 7 Days)
- FOMC Meeting (Jan 28-29): Hawkish surprise could trigger dollar rally, gold selloff
- Crowded Positioning: 8:1 call/put gamma ratio = everyone's on same side of the boat
- Weekend Gap Risk: Geopolitical news over weekend could cause Monday gap
🟠 Medium-Term Risks (1-3 Months)
- Technical Overbought: RSI 73.54, 25% above 200-DMA - corrections from these levels are historically sharp
- Stronger Dollar: If Fed stays hawkish, USD rally pressures gold
- Geopolitical De-escalation: Russia-Ukraine peace, Iran stabilization would reduce safe-haven premium
- Risk-On Rotation: AI productivity gains driving equity rally could pull capital from gold
🟡 Structural Risks
- Central Bank Selling: Though unlikely, any major sovereign reducing reserves would shock prices
- ETF Expense: GLD's 0.40% fee compounds over time vs cheaper alternatives like GLDM (0.10%)
- No Yield: Gold pays nothing while rates remain elevated at 3.5%+
🎯 The Bottom Line
Real talk: We just witnessed a $50M institutional cage match in GLD options, and the fighters are betting opposite directions on a 3-day timeframe. Here's what to do:
If You're Already Long Gold/GLD:
✅ Consider taking partial profits - you're up 80%+ in 12 months ✅ Hedge with a put spread or collar if position is large ✅ Watch the $455 support level like a hawk - a break below signals trouble
If You're Watching From the Sidelines:
👀 Wait for post-FOMC clarity (Jan 29) before initiating new positions 👀 The $440-$445 zone is attractive for dip-buying if we get a pullback 👀 Iron condors make sense while IV remains elevated
If You're Bearish:
🐻 The overbought technicals support your thesis short-term 🐻 But fighting a structural bull market backed by central banks is dangerous 🐻 Consider bear put spreads rather than naked shorts
Mark Your Calendar: January 26 (spread expiration), January 28-29 (FOMC), February 1 (tariffs kick in)
The Lesson: When two institutional players make opposing $25M bets on the same expiration, one of them is wrong. The fact that they're willing to take this size of bet tells you gold is at a critical inflection point. Trade accordingly - and size appropriately! 💪
📚 Sources & References
- SPDR Gold Shares Official - Fund details and AUM
- ETFdb GLD Profile - ETF statistics and flows
- World Gold Council 2026 Outlook - Scenario analysis
- J.P. Morgan Gold Research - Price targets
- CNBC Gold Coverage - Catalyst reporting
Disclaimer: This analysis is for educational purposes only and does not constitute investment advice. Options trading involves significant risk of loss. Past performance does not guarantee future results. Always do your own research and consider your risk tolerance before trading. The unusual activity highlighted may represent hedging, speculation, or complex multi-leg strategies not fully captured in this analysis.
Analysis Date: January 23, 2026 | Data Sources: Theta Data, Polygon, Ainvest Option Flow