Gold's Historic Rally Triggers $9.5M LEAP Bull Call Spread - Institutional Money Betting on $5,700+ Gold!
January 29, 2026 | Unusual Activity Detected
The Quick Take
Someone just deployed a $9.5M bull call spread on GLD this morning at 09:37:46! This institutional player bought 2,078 contracts of the $555/$560 call spread expiring January 15, 2027 -- a defined-risk bet that gold reaches $5,700/oz within the next 11.5 months. With GLD up a staggering +98.3% YTD and gold just smashing through $5,500/oz for the first time in history, this trader is paying just ~$300K in net premium for a potential $1.04M max payout. Translation: Smart money sees the gold bull market continuing well into 2027, and they are positioning for another 10% move higher from here.
ETF Overview
SPDR Gold Trust (GLD) is the largest and most liquid physical gold ETF, providing direct exposure to gold price movements without holding physical bullion:
- AUM: $100B+ (largest gold ETF globally)
- Industry: Commodity Contracts Brokers & Dealers
- Current Price: $486.77 (near all-time highs)
- Primary Exposure: Physical gold bullion held in HSBC London vaults; each share represents approximately 1/10th of an ounce of gold
- Expense Ratio: 0.40%
The Option Flow Breakdown
The Tape (January 29, 2026 @ 09:37:46):
| Time | Symbol | Side | Buy/Sell | Type | Expiration | Premium | Strike | Volume | OI | Size | Spot | Option Price | Option Symbol |
|---|---|---|---|---|---|---|---|---|---|---|---|---|---|
| 09:37:46 | GLD | MID | BUY | CALL $555 | 2027-01-15 | $9.5M | $555 | 5,000 | 5,100 | 2,078 | $507.33 | $45.85 | GLD20270115C555 |
| 09:37:46 | GLD | MID | SELL | CALL $560 | 2027-01-15 | $9.2M | $560 | 5,000 | 5,700 | 2,078 | $507.33 | $44.30 | GLD20270115C560 |
What This Actually Means
This is a LEAP bull call spread -- a defined-risk bullish strategy with capped upside. Here is the breakdown:
- Net debit paid: ~$300K ($9.5M spent on long calls minus $9.2M received from short calls). This means the trader spent $1.55 per spread ($45.85 - $44.30) for 2,078 contracts.
- Max profit: $1.04M if GLD is above $560 at January 2027 expiration. That is ($560 - $555) x 100 x 2,078 = $1,039,000.
- Max loss: ~$300K (the net premium paid) if GLD is below $555 at expiration.
- Risk/reward ratio: ~3.5:1 -- risking $300K to make $1.04M. Outstanding asymmetry.
- Breakeven: GLD at ~$556.55 at expiration (gold at approximately $5,715/oz).
- Target move: GLD needs to rally from $507.33 to $555+ (9.4% higher), or gold from ~$5,220/oz to ~$5,700/oz.
- Time horizon: 11.5 months (January 15, 2027 expiration) -- plenty of runway for continued gold appreciation.
What is really happening here: This trader is making a high-conviction, defined-risk bet that the gold bull market has more room to run. By using a call spread instead of outright calls, they dramatically reduced their cost basis from $9.5M to just ~$300K while still capturing $1M+ of upside if gold rallies another 10%. The $555/$560 strike selection aligns closely with Goldman Sachs' year-end 2026 gold target of $5,400/oz and sits comfortably within Deutsche Bank's $6,000/oz forecast. The tight $5-wide spread on a $507 underlying tells us this is a leveraged directional bet -- the trader wants maximum leverage for minimum premium outlay.
Institutional fingerprints:
- Executed at MID price (not aggressively sweeping the ask -- disciplined execution)
- 2,078 contracts represents significant size relative to open interest (5,000-5,700 OI)
- Same-second execution of both legs confirms this is a single spread order, not two separate trades
- LEAP expiration (11.5 months out) is characteristic of institutional positioning, not short-term speculation
- Volume of 5,000 contracts vs. 5,100/5,700 OI nearly doubles open interest -- this IS the market
Technical Setup / Chart Check-Up
One Calendar Year Chart
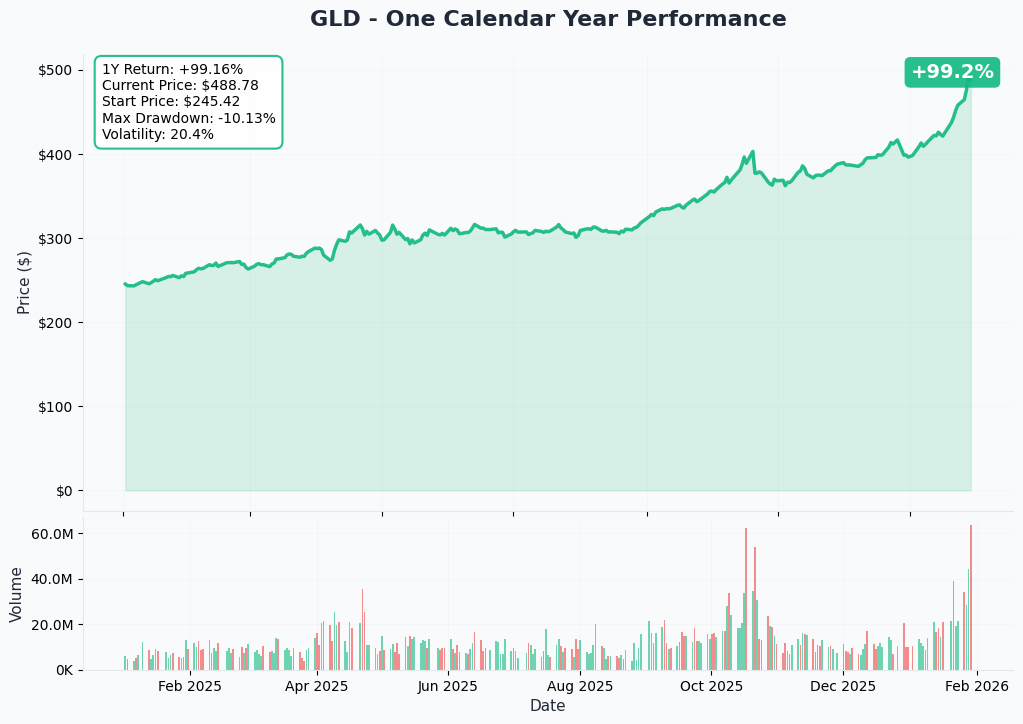
GLD is having a year for the history books -- up +98.3% YTD with the current price around $486.77. Gold has been on an absolute tear, breaking through $4,000/oz in October 2025, $5,000/oz on January 26, 2026, and surpassing $5,500/oz on January 29, 2026.
Key observations:
- Parabolic acceleration: Gold moved from $4,500 to $5,500+ in under 3 weeks -- a breathtaking 22% surge
- Historic milestones: $4,000 in October, $5,000 on January 26, $5,500+ on January 29 -- each level falling faster than the last
- 2025 full-year return: +64% for GLD, outperforming every major U.S. equity index (Motley Fool)
- Record ETF inflows: Nearly $89B flowed into gold ETFs in 2025, pushing holdings to all-time highs near 4,025 tonnes (J.P. Morgan)
- Near-term caution: GLD traded down 3.36% intraday on January 29 despite gold hitting new highs -- some profit-taking emerging at these levels
Gamma-Based Support & Resistance Analysis
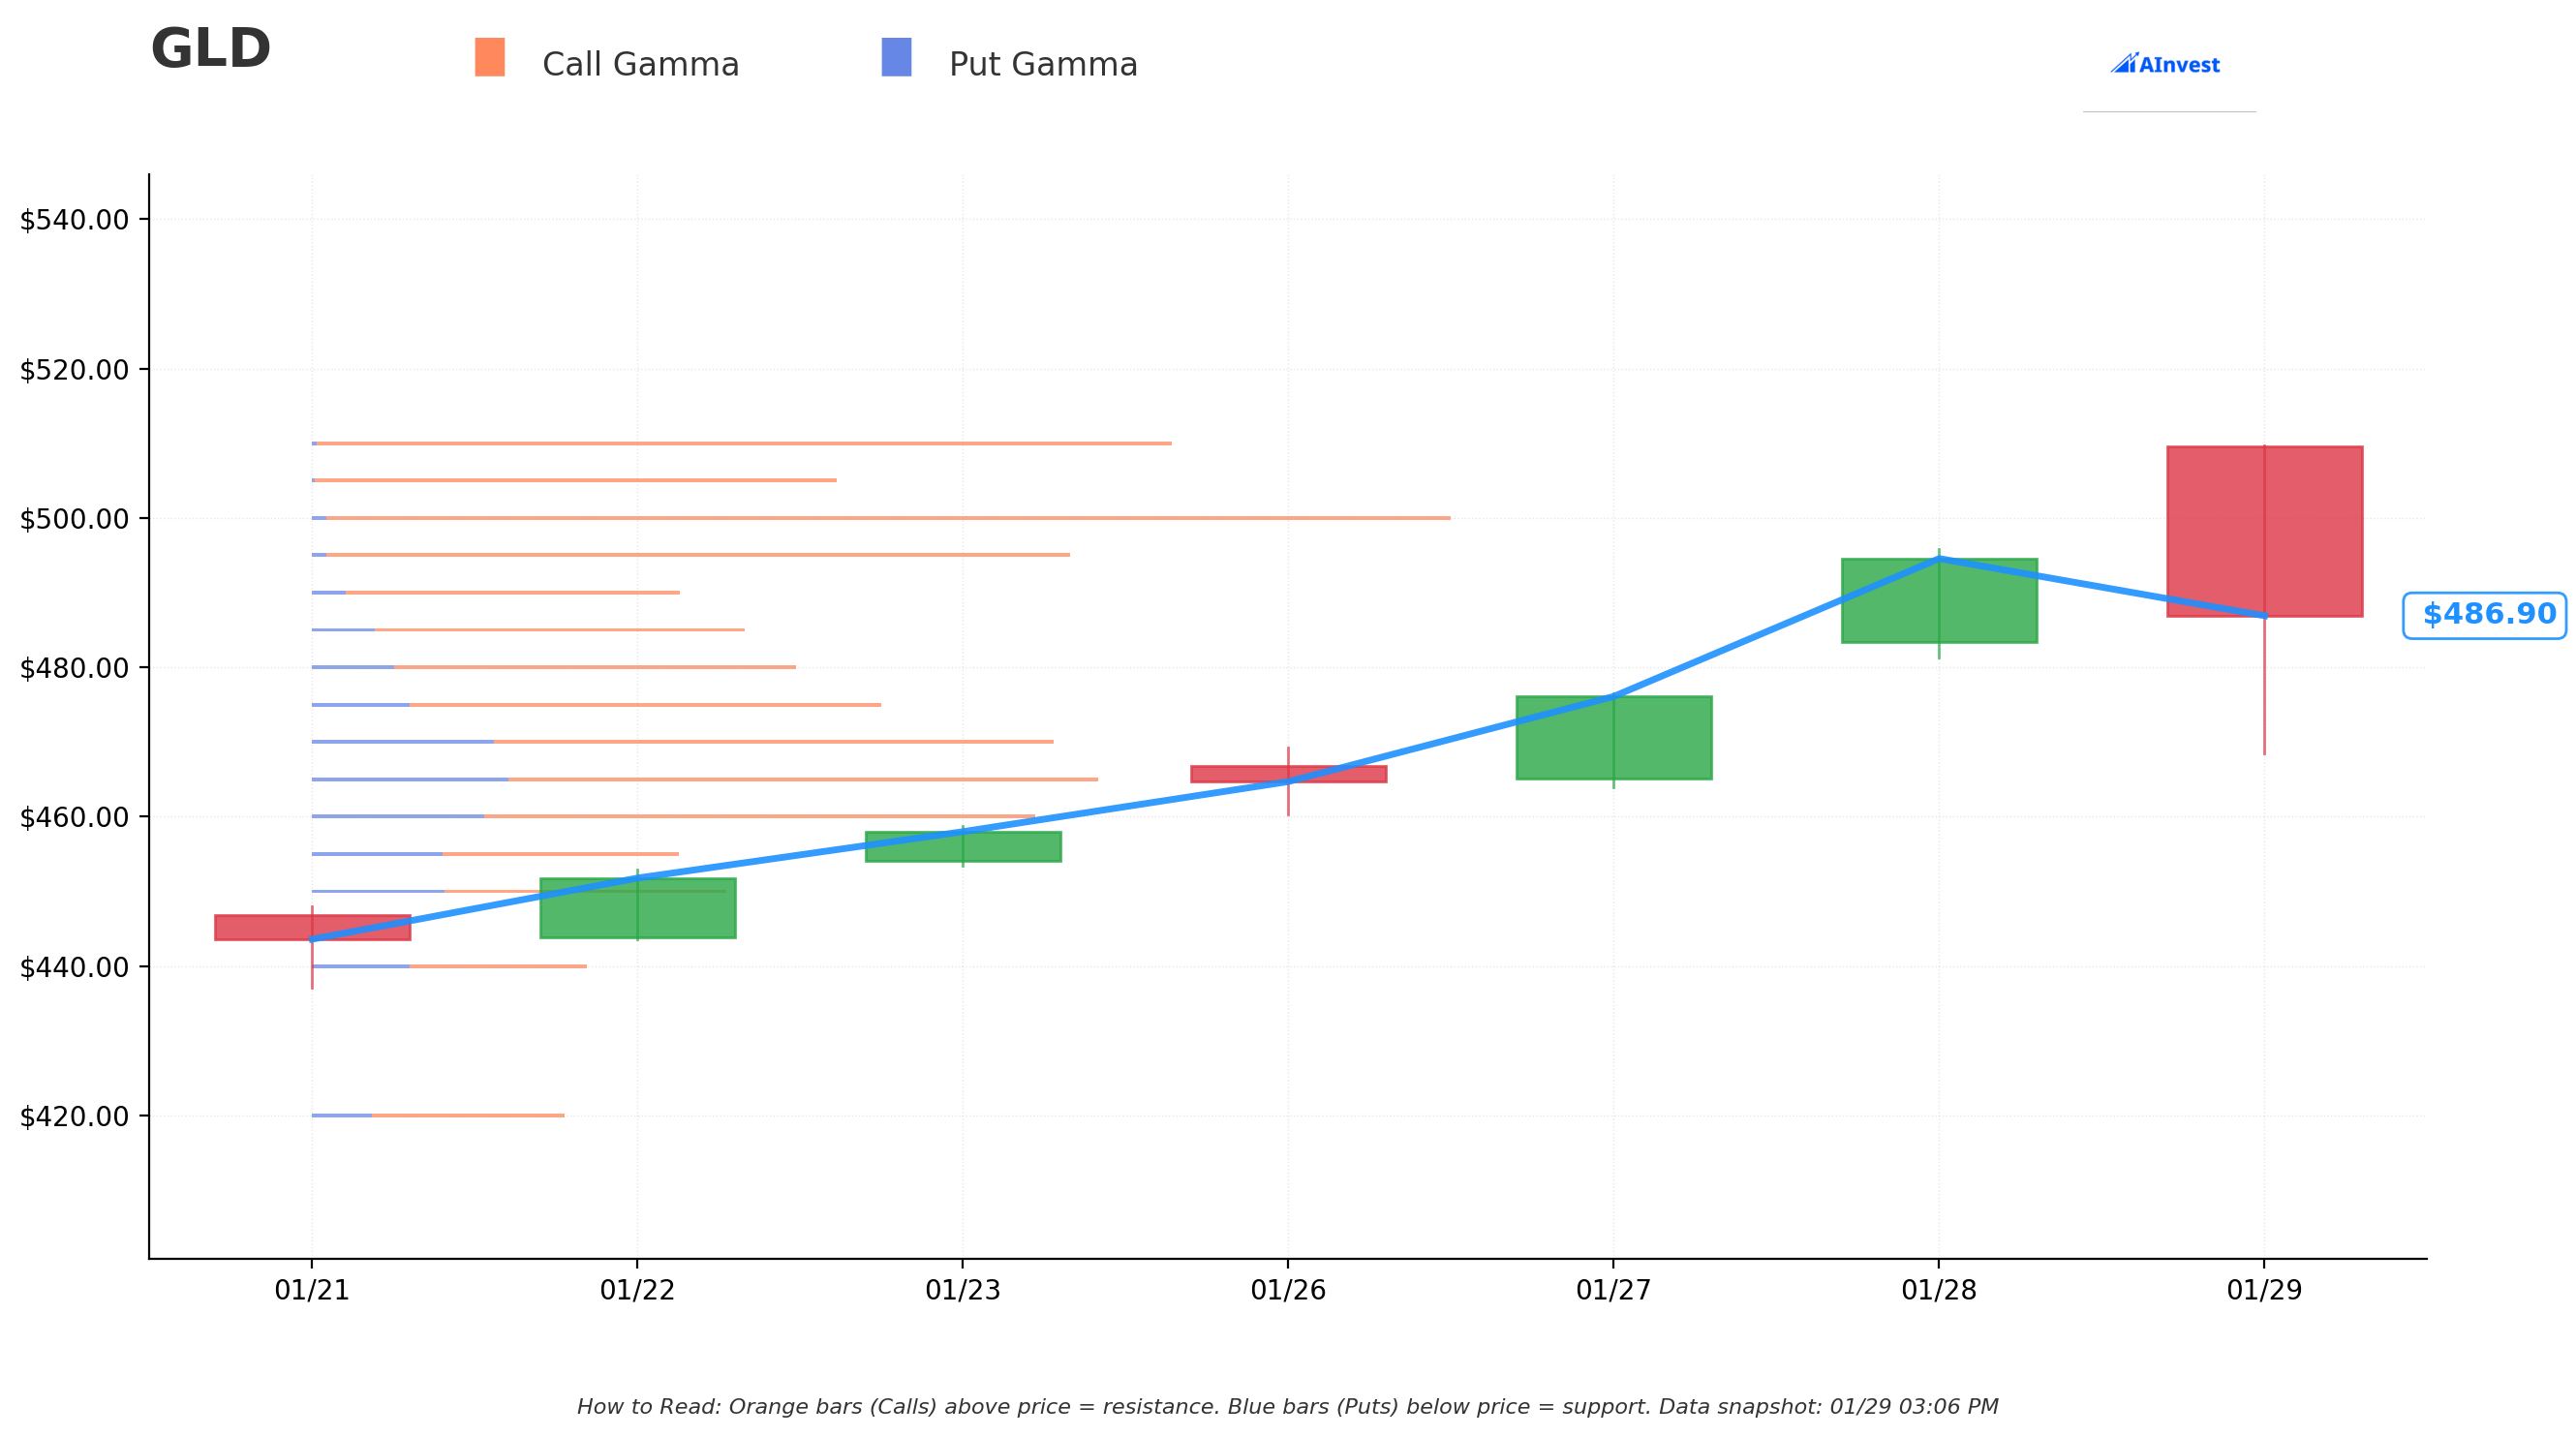
Current Price: $486.91
The gamma exposure map reveals critical levels where dealer hedging activity creates mechanical support and resistance:
Support Levels (Dealer Buy Zones Below Price):
- $480 - First support shelf; dealers likely to buy dips here
- $475 - Secondary support; significant put gamma concentration
- $470 - Structural floor with strong gamma footprint
- $465 - Deep support level; breaking here shifts momentum
- $460 - Major gamma wall; represents ~4% pullback from current
- $455 - Extended support; last line before a larger correction
Resistance Levels (Dealer Sell Zones Above Price):
- $495 - Immediate overhead ceiling; dealers sell into rallies toward this level
- $500 - Major psychological and gamma resistance (round number + high open interest)
- $505 - Secondary resistance; the current spot price on the trade ($507.33) sits just above this
- $510 - Upper gamma boundary; breakout above here opens the door to further upside
What this means for traders: GLD is trading in a zone of strong bullish momentum with layered support below. The $480-$475 zone offers the first meaningful gamma cushion for any pullback. The $500 round number remains a key psychological level -- gold just breached $5,000/oz for the first time on January 26, and GLD holding above $490-$500 would confirm this breakout.
Net GEX Bias: Bullish -- Call-side gamma dominates, suggesting dealer positioning will provide a supportive floor on dips and reduce volatility to the downside. This is a positive gamma environment where dips tend to be bought.
Implied Move Analysis
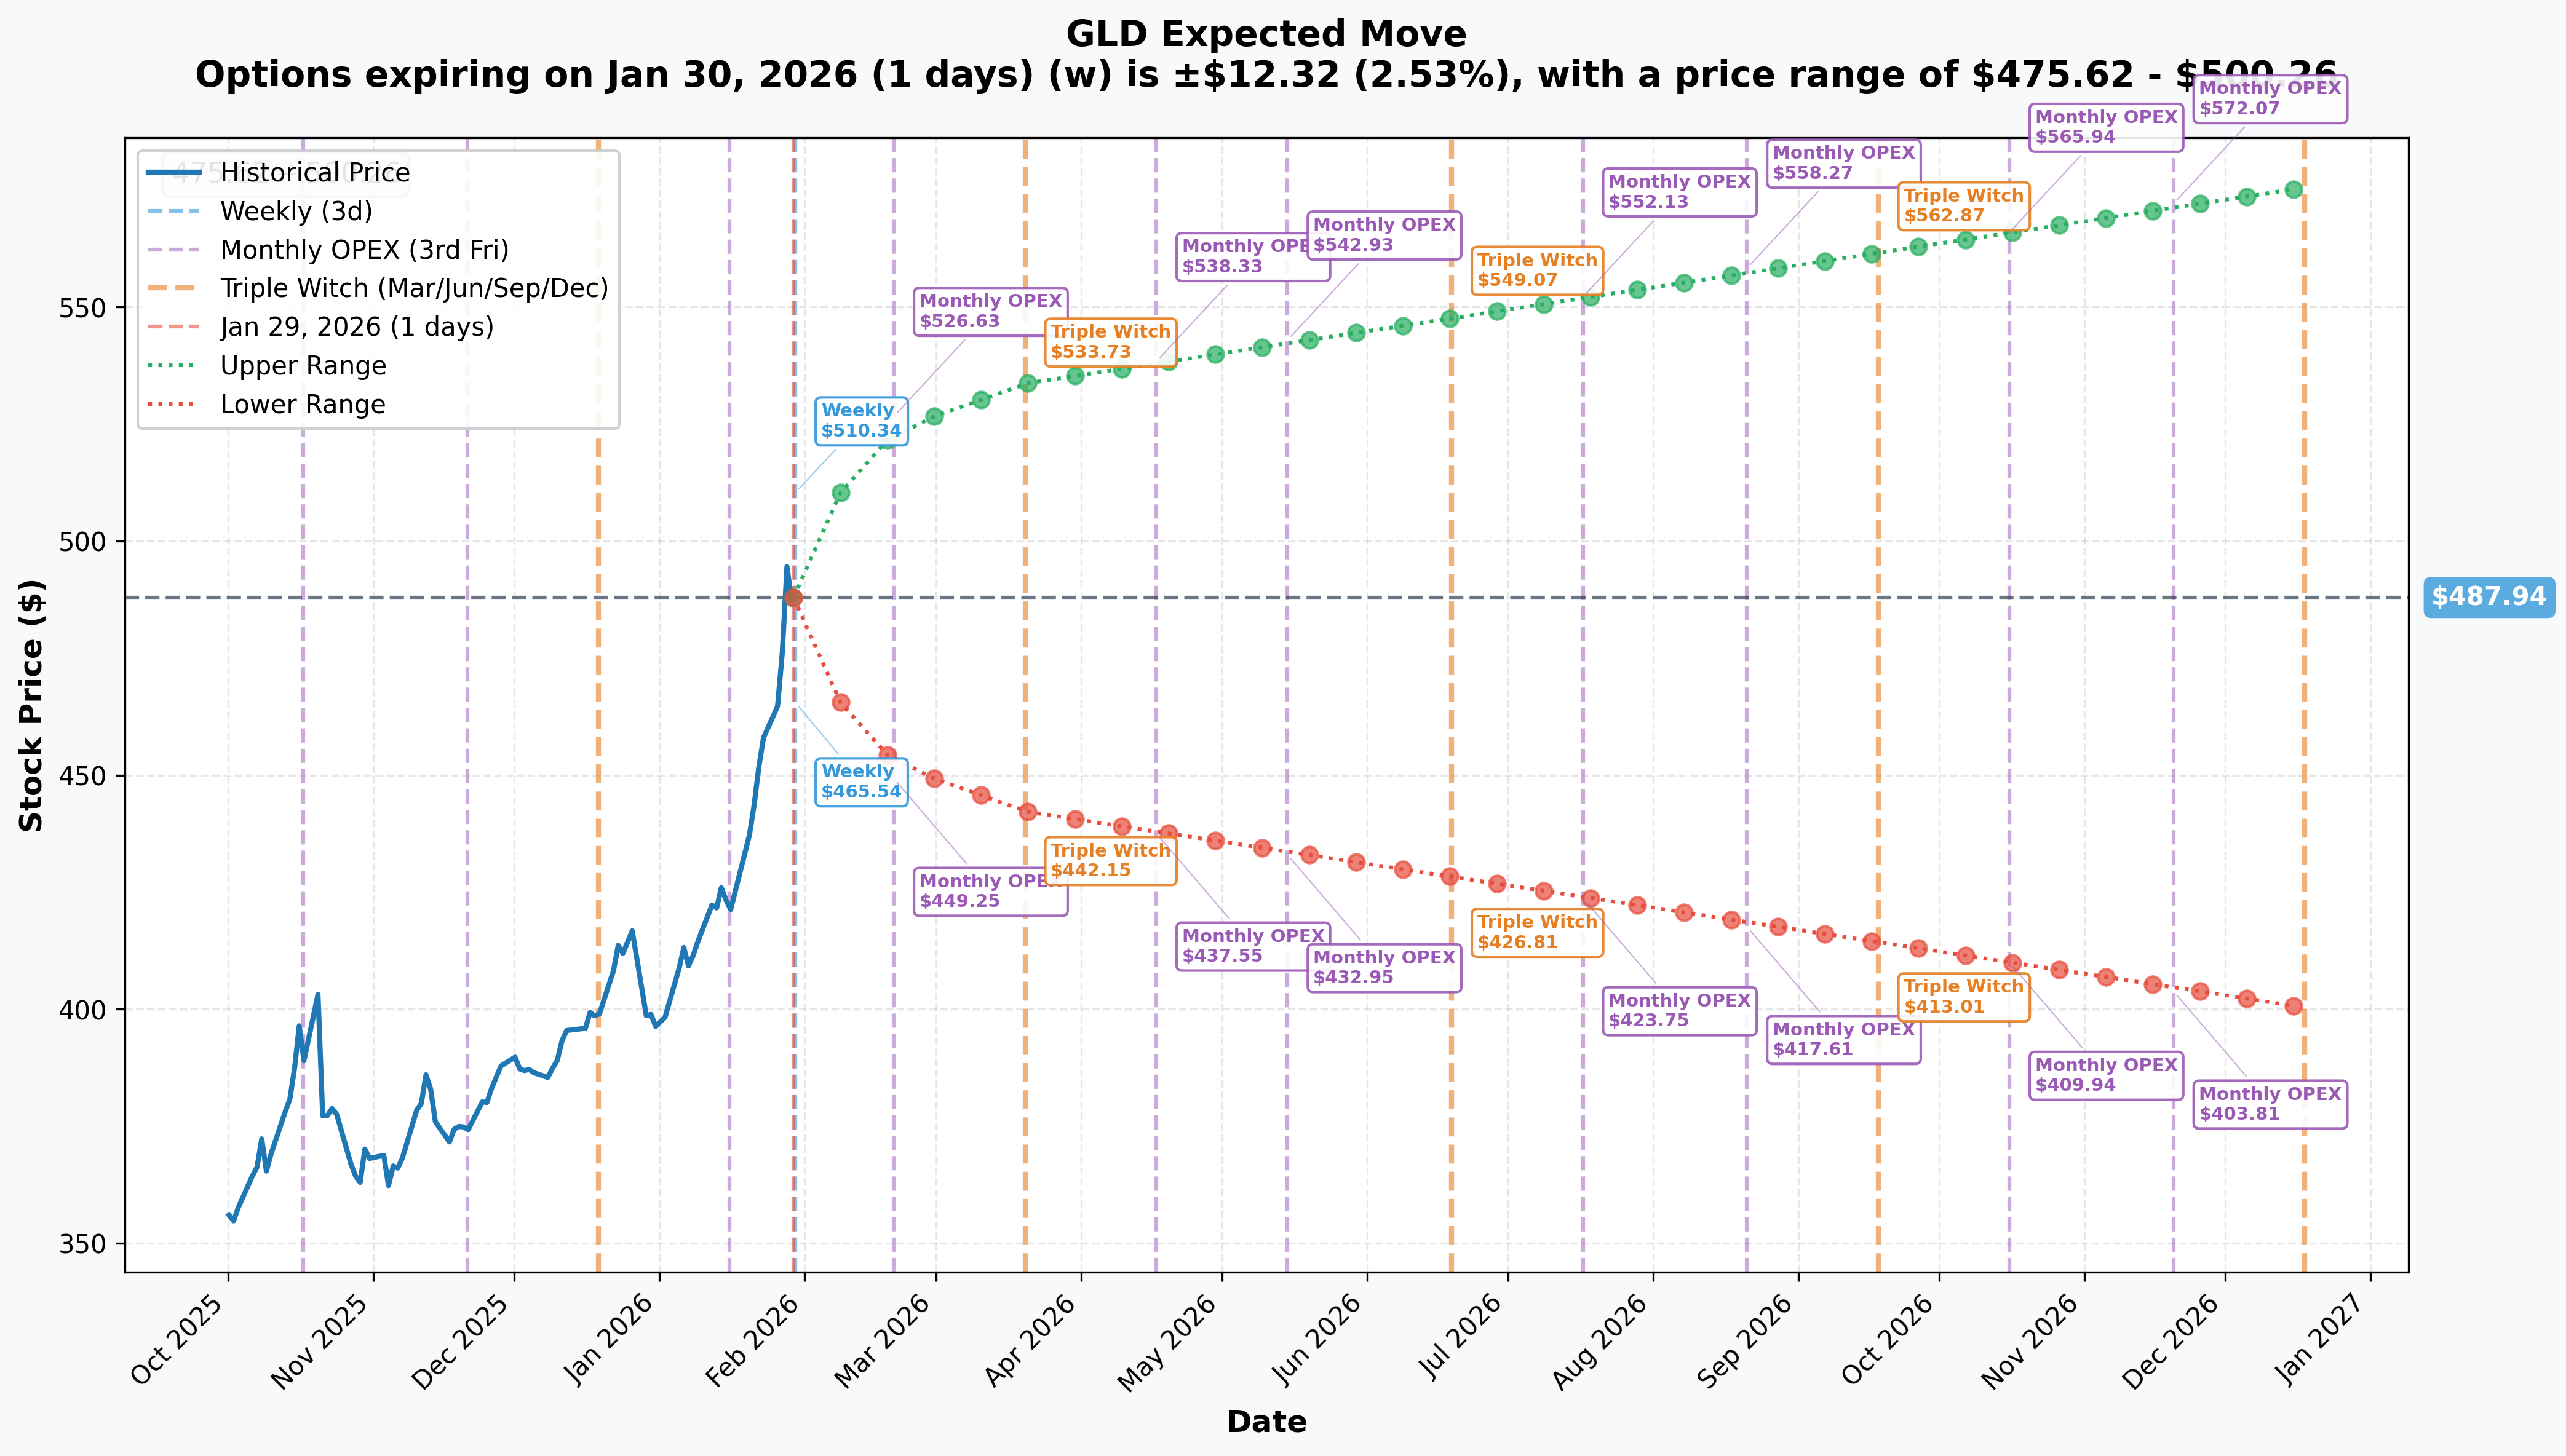
Options market pricing for upcoming expirations:
- Weekly (Jan 30 - 1 day): +/-2.5% (+/-$12.32) --> Range: $475.62-$500.26
- Monthly OPEX (Feb 20 - 22 days): +/-7.3% (+/-$35.85) --> Range: $452.09-$523.79
- Quarterly (Mar 20 - 50 days): +/-9.4% (+/-$45.79) --> Range: $442.15-$533.73
- Yearly LEAPs (Jan 2027): +/-18.0% (+/-$87.66) --> Range: $400.28-$575.60
Translation for regular folks: The options market is pricing in SIGNIFICANT moves for gold over the coming year. The +/-18% yearly implied move gives an upper range of $575.60 -- which is ABOVE the $560 call spread ceiling. This means the market itself considers GLD reaching $555-$560 within the realm of normal probability over the next 12 months.
The January 2027 LEAP expiration (when this $9.5M trade expires) has an upper range of $575.60 -- meaning the $555/$560 call spread targets are well within the options market's expected distribution. The spread buyer is not making an extreme bet; they are positioning within the consensus implied range.
Key insight: The monthly implied move of +/-7.3% and quarterly of +/-9.4% reflect elevated volatility expectations driven by FOMC decisions, geopolitical events, and the sheer momentum of the gold rally. The market is pricing in continued large moves in both directions, but the structural catalysts heavily favor the upside.
Catalysts
Immediate Catalysts (Next 7 Days)
FOMC Decision - January 28-29, 2026 (TODAY)
The Federal Reserve concludes its January meeting today. Market consensus expects rates held steady, but the tone of the statement and any updated dot plot guidance on future cuts will move gold:
- The market expects ~75 bps of additional cuts in 2026 (J.P. Morgan)
- Rate cuts lower the opportunity cost of holding gold (a non-yielding asset), which is structurally bullish
- Gold has historically risen ~6% in the 60 days following the start of a Fed cutting cycle
- Any hawkish surprise (fewer cuts) could trigger a near-term pullback; dovish lean fuels further rally
Gold Just Broke $5,500/oz - January 29, 2026
Gold surpassed $5,500/oz on January 29, just three days after breaking $5,000/oz for the first time on January 26. This parabolic acceleration has been driven by:
- Safe-haven demand amid escalating geopolitical tensions (CNBC)
- U.S. Dollar weakness (Dollar Index down 8.8% since end-2024) (Forex.com)
- Record ETF inflows ($1.09B into GLD in just 5 days as of January 15) (ETF.com)
- Central bank demand running at ~60 tonnes/month vs. pre-2022 average of 17 tonnes/month (World Gold Council)
Near-Term Catalysts (Q1-Q2 2026)
Central Bank Buying -- The Structural Pillar
Central banks have been buying gold at an unprecedented pace for three consecutive years, fundamentally reshaping the supply-demand balance:
- 2022: 1,082 tonnes purchased
- 2023: 1,037 tonnes purchased
- 2024: 1,045 tonnes purchased (third straight year above 1,000 tonnes)
- 2026 forecast: ~800 tonnes (equivalent to ~26% of annual mine output)
- Historic milestone: Gold has surpassed U.S. Treasuries in central bank reserves for the first time since 1996
- Central bank gold reserves now valued at close to $4 trillion
Key buyers to watch: Chinese PBOC, Indian RBI, Turkish TCMB, and Polish NBP remain the most active purchasers (World Gold Council).
Record ETF Inflows Continue
Global gold ETFs logged record inflows of nearly $89B in 2025, pushing holdings to all-time highs near 4,025 tonnes:
| Period | GLD Net Flows |
|---|---|
| 5-Day | $1.09B |
| 1-Month | $3.09B |
| 3-Month | $7.82B |
| 6-Month | $16.1B |
| 1-Year | $23.49B |
J.P. Morgan forecasts ~250 tonnes of additional ETF inflows in 2026, with bar and coin demand expected to surpass 1,200 tonnes annually (J.P. Morgan).
Federal Reserve Rate Cut Cycle
Each FOMC meeting is a potential catalyst for gold. The consensus path for 2026:
| FOMC Meeting Date | Market Expectation |
|---|---|
| January 28-29, 2026 | Hold (rates unchanged) |
| March 17-18, 2026 | Potential 25 bps cut |
| May 5-6, 2026 | Potential 25 bps cut |
| June 16-17, 2026 | Hold or cut |
| July 28-29, 2026 | Potential 25 bps cut |
U.S. Fiscal Deficits & De-dollarization
Ballooning U.S. national debt and deficit spending are eroding confidence in fiat currencies, driving structural allocation to gold. Emerging market central banks are actively diversifying reserves away from U.S. Treasuries into gold, representing a generational shift in global reserve management (State Street, World Gold Council).
J.P. Morgan has modeled a scenario where diversification of just 0.5% of foreign-held U.S. assets into gold could drive prices to $6,000/oz -- which would put GLD at ~$582, well above the $560 call strike.
Geopolitical Tensions
Multiple active conflicts and escalations support gold's safe-haven premium:
- U.S.-Iran tensions: Escalating military posture could trigger further safe-haven buying (CNBC)
- Russia-Ukraine conflict: Any escalation extends gold's risk premium
- Trade policy: Ongoing tariff disputes and protectionism support gold as a hedge
- U.S. fiscal policy: Debt ceiling debates and deficit expansion narratives
Major Bank Gold Price Forecasts (2026)
The institutional consensus heavily supports continued gold appreciation:
| Institution | 2026 Target | GLD Equivalent |
|---|---|---|
| Deutsche Bank | $6,000/oz | ~$582 |
| Goldman Sachs | $5,400/oz | ~$524 |
| J.P. Morgan | ~$5,000/oz (Q4 avg; $6,000 possible) | ~$485-$582 |
| HSBC | $5,000/oz | ~$485 |
| Citi | $5,000/oz | ~$485 |
| Bank of America | $5,000/oz avg | ~$485 |
| Morgan Stanley | $4,400-$4,800/oz | ~$427-$466 |
The $555/$560 call spread targets (GLD $555-$560 = gold ~$5,700-$5,800/oz) sit between the Goldman Sachs and Deutsche Bank forecasts -- right in the sweet spot of the bullish institutional consensus.
Risk Catalysts (Negative)
Rally Velocity & Mean Reversion Risk
Gold has moved from ~$4,500 to $5,500+ in under 3 weeks -- a 22% surge. Such parabolic moves often precede sharp pullbacks:
- 5-10% corrections are normal even in structural bull markets
- GLD traded down 3.36% on January 29 despite gold hitting new highs, suggesting profit-taking
- Speculative long positioning in gold futures is likely at extreme levels
- A flush of leveraged longs could trigger a sharp 10-15% correction
Federal Reserve Hawkish Surprise
If the Fed pauses or reverses rate cuts due to inflation resurgence, gold could sell off meaningfully:
- Much of the easing cycle may already be priced into gold at $5,500
- Bond yields remaining elevated reduces gold's relative attractiveness
- Any shift to a "higher for longer" narrative would be a headwind
U.S. Dollar Reversal
The Dollar Index is down 8.8% since end-2024 (Forex.com), which has been a tailwind for gold. If the dollar strengthens on risk-on sentiment or rate differentials, gold faces a headwind.
Central Bank Demand Fatigue
At $5,500/oz, central banks get fewer tonnes per dollar spent. The 2026 forecast of ~800 tonnes is below the 1,000+ tonne pace of 2022-2024 (World Gold Council). Any further deceleration would weaken a key pillar.
Geopolitical De-escalation
A Russia-Ukraine peace deal or Iran de-escalation could remove the geopolitical risk premium currently embedded in gold prices, leading to consolidation or pullback.
Price Targets & Probabilities
Using gamma levels, implied move data, bank forecasts, and the structural catalyst backdrop, here are the scenarios through January 15, 2027 expiration:
Bull Case (35% probability)
Target: GLD $555-$575+ (Gold $5,700-$5,900/oz)
How we get there:
- Federal Reserve delivers 75-100 bps of rate cuts through 2026, keeping the tailwind strong
- Central bank buying remains robust at or above 800 tonnes, maintaining structural demand
- De-dollarization accelerates -- J.P. Morgan's 0.5% foreign asset diversification scenario pushes gold toward $6,000/oz
- Geopolitical tensions escalate further (Iran, Russia-Ukraine, trade wars), maintaining safe-haven premium
- ETF inflows continue at $3B+/month pace, absorbing supply and pushing prices higher
- Goldman Sachs' $5,400 target proves conservative; Deutsche Bank's $6,000 target comes into play
- Gold consolidates after the recent parabolic move, then grinds higher through H2 2026
This is the call spread buyer's target scenario. If GLD hits $560+ by January 2027, the spread pays out its full $1.04M max profit on a ~$300K investment -- a 3.5x return.
Probability assessment: 35% reflects the strong structural tailwinds (central banks, rate cuts, de-dollarization) balanced against the already-parabolic rally. Multiple major banks have targets in this zone, and the LEAP implied move upper range of $575.60 encompasses this target.
Base Case (45% probability)
Target: GLD $480-$555 range (Gold $4,940-$5,700/oz)
Most likely scenario:
- Gold corrects 5-10% from the $5,500+ level after the parabolic January surge, then resumes its uptrend
- Fed delivers 50-75 bps of cuts in 2026 -- supportive but partially priced in
- Central bank buying continues at 700-800 tonnes -- solid but not accelerating
- GLD consolidates in the $480-$530 range through Q2-Q3, then grinds toward $540-$555 by year-end
- Geopolitical backdrop remains elevated but does not escalate dramatically
- The call spread expires near the lower strike ($555) -- either slightly in-the-money or just out
For the call spread buyer: In this scenario, the $555 strike is right at the boundary. If GLD finishes at $555, the spread is worth zero (both legs at-the-money). If GLD finishes at $557, the spread is worth $2 x 2,078 = $415K, slightly above breakeven. The trader needs GLD above $556.55 to profit.
Why 45% probability: This is the most likely path because it accounts for the near-term correction risk after a parabolic move while maintaining the structural bull thesis. Gold correcting to $5,000-$5,200 before resuming higher is the typical bull market pattern.
Bear Case (20% probability)
Target: GLD $400-$480 (Gold $4,100-$4,940/oz)
What could go wrong:
- Fed turns hawkish on sticky inflation -- fewer cuts than expected or rate hike fears re-emerge
- U.S. dollar strengthens significantly, creating a headwind for dollar-denominated gold
- Central bank buying decelerates sharply below 700 tonnes as price sensitivity kicks in
- Geopolitical de-escalation removes the risk premium (Russia-Ukraine peace deal, Iran diplomacy)
- Speculative long positioning unwinds violently -- leveraged longs get flushed in a 10-15% correction
- Risk-on rotation: equity markets rally strongly, pulling capital out of gold and into growth stocks
- Gold retreats to the $4,500-$5,000 range, giving back the January 2026 parabolic move
Critical support levels:
- $480: First gamma support; initial buy zone on pullbacks
- $475: Secondary support with strong gamma concentration
- $460: Major structural floor; 5.5% pullback from current levels
- $455: Extended support; breaking here suggests a deeper correction
For the call spread buyer: In this scenario, the spread expires worthless. The $300K net premium is lost entirely. However, this represents the maximum loss -- the defined-risk structure means there is no tail risk beyond the initial premium.
Probability assessment: 20% because the structural catalysts (central bank buying, de-dollarization, fiscal deficits) remain powerful even in a correction scenario. Gold would need MULTIPLE negative catalysts to align for a sustained retreat below $480. The long-term bull case remains intact even if near-term profit-taking occurs.
Spread P&L Scenarios at Expiration:
- GLD at $575: Max profit = $1,039,000 (spread fully in-the-money)
- GLD at $560: Max profit = $1,039,000
- GLD at $558: Profit = ($558-$555) x 100 x 2,078 - $300K = $323K
- GLD at $556.55: Breakeven ($0 profit/loss)
- GLD at $555 or below: Max loss = -$300K (premium paid)
Trading Ideas
Conservative: Buy GLD Shares on a Pullback
Play: Wait for a 5-8% pullback from current levels and buy GLD shares near $450-$465 gamma support
Why this works:
- Gold is in a structural bull market with central bank buying, rate cuts, and de-dollarization providing multi-year tailwinds
- The January parabolic move ($4,500 to $5,500+ in 3 weeks) is likely to correct -- giving a better entry
- GLD down 3.36% on January 29 already shows early profit-taking; more may follow
- Gamma support at $460-$475 provides a natural entry zone where dealers buy dips
- No expiration risk -- you own the ETF and can hold through any volatility
- Multiple major banks targeting $5,000-$6,000/oz by end-2026 supports the long thesis
Action plan:
- Set limit buy orders at $460-$470 (approximately 5-8% below current levels)
- Start with a half position if gold corrects to $5,000-$5,100/oz range
- Add the second half if gold pulls back to $4,800-$4,900/oz ($465-$475 GLD)
- Set a stop-loss at $430 (approximately 7% below entry) to manage risk
- Target: $530-$560 by Q4 2026 (aligning with Goldman Sachs and Deutsche Bank forecasts)
Risk level: Low-Moderate (ETF shares, no leverage, no expiration) | Skill level: Beginner-friendly
Expected outcome: If the structural bull thesis holds, buying GLD at $460-$470 targets a 15-20% return by year-end 2026. Worst case, the stop-loss limits downside to ~7%.
Balanced: Replicate the Institutional LEAP Call Spread (Smaller Size)
Play: Enter the same GLD $555/$560 call spread (January 2027 expiration) in smaller size
Structure: Buy GLD Jan 2027 $555 calls / Sell GLD Jan 2027 $560 calls
Why this works:
- Copying an institutional trade with a 3.5:1 risk/reward ratio at defined risk
- The $555/$560 targets align with the Goldman Sachs $5,400/oz forecast and sit within the LEAP implied move upper range of $575.60
- Net debit of ~$1.55 per spread ($155 per contract) makes this accessible for smaller accounts
- 11.5 months of time allows the structural catalysts to play out through multiple FOMC meetings, central bank data releases, and geopolitical developments
- Maximum loss is the net premium paid -- no margin calls, no tail risk
- If you believe gold is heading to $5,700+/oz by January 2027, this is the same bet the institution made
Estimated P&L (per 10 contracts):
- Cost: ~$1,550 (10 contracts x $155 net debit)
- Max profit: $5,000 (10 contracts x $500 max spread value) minus $1,550 cost = $3,450
- Breakeven: GLD at $556.55
- Max loss: -$1,550 if GLD below $555 at expiration
Entry timing:
- Consider entering on a pullback in GLD to improve cost basis (wait for a 3-5% dip)
- Alternatively, scale in: buy half now, half after any correction
- Do NOT enter if gold is in free-fall -- wait for stabilization first
Position sizing: Risk no more than 3-5% of portfolio. This is a directional bet with binary outcome (profitable above $556.55, total loss below $555).
Risk level: Moderate (defined risk, directional, long time horizon) | Skill level: Intermediate
Aggressive: Sell Cash-Secured Puts on GLD to Get Paid While Waiting
Play: Sell GLD puts at gamma support levels to collect premium while waiting for a pullback entry
Structure: Sell GLD March 2026 $460 puts (approximately 5.5% out-of-the-money)
Why this could work:
- Implied volatility is elevated after the parabolic rally -- puts are expensive, meaning you collect rich premium
- The $460 strike sits at a key gamma support level where dealers are likely to buy dips
- If GLD stays above $460 (which the bull case strongly supports), you keep the entire premium as profit
- If GLD drops to $460, you get assigned and own GLD at a 5.5% discount to current price -- an attractive entry for the long-term bull thesis
- Either way you win: premium income if gold stays elevated, or discounted entry if it corrects
- 50-day expiration keeps the trade manageable and allows reassessment
Why this could go wrong (RISKS):
- If gold corrects sharply (10-15%), you will own GLD at $460 while it trades at $420-$440 -- an immediate paper loss
- Parabolic moves can reverse violently -- the same momentum that pushed gold up can push it down
- Margin requirements for cash-secured puts are substantial (need ~$46,000 per contract in cash)
- If volatility explodes further (geopolitical shock), the put may move against you before expiration
Estimated P&L (per contract):
- Premium collected: ~$8-$12 per share ($800-$1,200 per contract) given elevated IV
- Max profit: Premium collected if GLD stays above $460
- Breakeven: ~$448-$452 (strike minus premium received)
- Max loss: Substantial if GLD drops significantly below $448 (you own shares at $460)
Position sizing: Only sell puts you can afford to be assigned on. Cash-secured means having $46,000 per contract in your account. This is NOT a strategy for margin accounts with insufficient capital.
Risk level: Moderate-High (undefined downside, capital-intensive) | Skill level: Advanced
Risk Factors
Do not ignore these potential landmines:
-
Parabolic rally velocity creates correction risk: Gold moved from ~$4,500 to $5,500+ in under 3 weeks -- a 22% surge. Such rapid appreciation almost always precedes a meaningful pullback. GLD already traded down 3.36% on January 29 despite gold hitting new highs, signaling early profit-taking. Speculative long positioning in gold futures is likely at extreme levels, and a flush of leveraged longs could trigger a sharp 10-15% correction. The call spread buyer's 11.5-month timeframe provides a buffer against near-term volatility, but anyone entering shorter-dated trades should expect choppiness.
-
Federal Reserve policy risk: The market has priced in ~75 bps of additional rate cuts in 2026. If inflation proves stickier than expected and the Fed pauses or reverses course, gold could sell off meaningfully. Rate cuts are a core pillar of the current bull thesis -- if that pillar weakens, gold could retreat to the $4,500-$5,000 range. The January 28-29 FOMC meeting today is the first test. (Forex.com)
-
U.S. Dollar reversal: The Dollar Index has fallen 8.8% since end-2024, providing a significant tailwind for gold (Forex.com). Dollar weakness is not guaranteed to continue -- any shift to risk-on sentiment, widening rate differentials, or flight-to-dollar dynamics could reverse this trend and create a headwind for gold.
-
Central bank buying may slow at elevated prices: The 2026 forecast of ~800 tonnes is already below the 1,000+ tonne pace of 2022-2024 (World Gold Council). At $5,500/oz, central banks get fewer tonnes per dollar spent. If purchases decelerate further, a key structural demand driver weakens.
-
Geopolitical de-escalation risk: A Russia-Ukraine peace deal, Iran diplomatic breakthrough, or trade war resolution would remove the geopolitical risk premium currently supporting gold prices. While not the most likely scenario, geopolitical events are inherently unpredictable and could shift rapidly.
-
Jewelry demand destruction: At $5,500/oz, consumer price sensitivity in India and China (the world's two largest physical gold markets) is significant. Jewelry demand -- historically the largest source of gold demand -- faces substantial headwinds at these prices. Investment and central bank demand has more than offset this weakness, but it represents a drag on total demand.
-
The call spread structure caps upside: The $555/$560 spread maxes out at $1.04M profit regardless of how high gold goes. If gold reaches $6,000/oz (Deutsche Bank target), the spread buyer leaves significant money on the table. This is the trade-off for the reduced $300K cost. For retail traders replicating this trade, understand that your upside is capped at $5 per share no matter what happens above $560.
-
Time decay risk for shorter-dated trades: While the LEAP call spread has 11.5 months of runway, shorter-dated options strategies will face aggressive theta decay. Gold's elevated implied volatility makes options expensive, and any vol crush would hurt long option positions. Time your entries carefully.
The Bottom Line
Real talk: An institutional player just deployed a $9.5M bull call spread betting GLD reaches $555-$560 (gold at $5,700-$5,800/oz) by January 2027. This is not a speculative gamble -- it is a calculated, defined-risk position that aligns with the consensus of every major Wall Street bank. Goldman Sachs says $5,400. Deutsche Bank says $6,000. J.P. Morgan says $5,000-$6,000. The spread buyer is positioning right in the middle.
What this trade tells us:
- The buyer has high conviction that gold's structural bull market continues through 2027 -- central bank buying, rate cuts, de-dollarization, and geopolitical tensions are not going away
- The defined-risk structure (max loss $300K on a $9.5M notional trade) shows disciplined risk management -- they are not swinging for the fences blindly
- The MID execution price (not sweeping the ask) indicates patient, institutional-quality execution
- The 11.5-month LEAP expiration gives plenty of runway for the thesis to play out through multiple FOMC meetings, central bank data releases, and geopolitical developments
- The 3.5:1 risk/reward ratio ($300K risk for $1.04M potential) is an attractive bet when the structural catalysts are this powerful
The big picture: Gold is in the midst of a historic bull market. Three consecutive years of 1,000+ tonne central bank buying, record ETF inflows of $89B in 2025, the Federal Reserve's rate-cutting cycle, ballooning U.S. fiscal deficits, and escalating geopolitical tensions have created a perfect storm for gold. The breakout above $5,000/oz on January 26 was a landmark moment -- and the speed of the follow-through to $5,500+ confirms enormous underlying demand.
If you are bullish on gold:
- The near-term risk is a correction after the parabolic January move -- do NOT chase at the highs
- Wait for a 5-8% pullback to the $450-$470 range for a better entry in GLD shares
- The LEAP call spread structure used by this institution is a smart, capital-efficient way to express the thesis
- Gold's structural tailwinds (central banks, de-dollarization, rate cuts) are multi-year in nature -- this is not a trade, it is a secular theme
If you are watching from the sidelines:
- Gold has nearly doubled YTD -- it is natural to feel like you missed the move
- The institutional consensus ($5,000-$6,000/oz by end-2026) suggests there is still meaningful upside from current levels
- Use any pullback as an opportunity to build a position gradually
- Consider allocating 5-10% of a diversified portfolio to gold as a hedge against fiscal and geopolitical uncertainty
If you are cautious:
- The parabolic rally velocity IS concerning -- 22% in 3 weeks is not sustainable
- A 5-10% correction is HEALTHY and likely before the next leg higher
- The FOMC decision today and upcoming data releases could create near-term volatility
- The call spread buyer's 11.5-month timeframe acknowledges that the path will not be straight up
Mark your calendar -- Key dates:
- January 29, 2026 (TODAY) - FOMC decision and gold at all-time highs above $5,500/oz
- March 17-18, 2026 - Next FOMC meeting (potential 25 bps cut)
- April 2026 - World Gold Council Q1 central bank purchase data release
- May 5-6, 2026 - FOMC meeting (potential 25 bps cut)
- July 2026 - World Gold Council Q2 central bank purchase data release
- January 15, 2027 - LEAP call spread expiration ($555/$560 settlement date)
Final verdict: The gold bull market is real, it is structural, and it has the backing of central banks, sovereign wealth funds, ETF investors, and now options market institutions. The $9.5M LEAP call spread targeting $555-$560 is a well-constructed bet that gold reaches $5,700/oz within 12 months -- a target supported by Goldman Sachs, J.P. Morgan, and Deutsche Bank. The 3.5:1 risk/reward profile makes this one of the more attractive institutional flow signals we have seen.
But do not chase the parabolic move. Let gold correct 5-8%, build your position at better levels, and let the structural catalysts do the work over the next 12 months. The gold bull market is not ending anytime soon -- you have time to be patient and disciplined.
Disclaimer: Options trading involves substantial risk of loss and is not suitable for all investors. This analysis is for educational purposes only and not financial advice. Past performance does not guarantee future results. Gold and GLD can experience significant drawdowns even in structural bull markets -- the 22% surge in January 2026 could reverse partially or fully. The institutional call spread buyer may have portfolio hedging needs or offsetting positions not visible in this data. Always do your own research and consider consulting a licensed financial advisor before trading. LEAP options tie up capital for extended periods and can lose 100% of premium if the underlying does not reach the strike price.
About SPDR Gold Trust: SPDR Gold Trust (GLD) is the largest physical gold ETF, providing investors direct exposure to gold price movements without holding physical bullion. Each share represents approximately 1/10th of an ounce of gold held in HSBC London vaults. GLD has $100B+ in assets under management and is categorized in the Commodity Contracts Brokers & Dealers sector.