🥇 GLD Options Analysis: $262M Calendar Roll Signals Gold Bull Isn't Done Yet
January 30, 2026 | Unusual Options Activity Alert
🏢 ETF Overview
SPDR Gold Shares (GLD) 💰 AUM: ~$177 Billion 🪙 Sector: Precious Metals / Commodity 📊 Expense Ratio: 0.40% 🏛️ Issuer: State Street Global Advisors / World Gold Council
GLD is the world's largest physically-backed gold ETF - each share represents roughly 1/10th of an ounce of gold bullion sitting in a vault. With $177 billion in assets and 1,085 tonnes of physical gold, this is THE institutional vehicle for gold exposure. It's been on an absolute rocket ship in 2025-2026, up nearly 95% over the past year as gold blasted through $5,500/oz for the first time ever. 🚀
| Key Stat | Value |
|---|---|
| Current Price | $496.85 |
| 52-Week Range | $256.45 - $514.02 |
| 1-Month Return | +22.76% |
| YTD Return (2026) | ~+18% |
| 1-Year Return | +94.81% |
| Gold Holdings | 1,085.67 tonnes |
| 1-Year Net Flows | +$23.49 billion |
🚨 Unusual Options Activity Detected
Alright, buckle up - this one is massive. At 11:23 AM today, someone executed a coordinated $262 MILLION options play across five legs on GLD. This isn't some retail trader YOLOing their savings - this is serious institutional money making a very deliberate move.
📋 Options Flow Detail (January 30, 2026)
| Time | Symbol | Side | Buy/Sell | Type | Expiration | Premium | Strike | Volume | OI | Size | Spot | Option Price | Option Symbol |
|---|---|---|---|---|---|---|---|---|---|---|---|---|---|
| 11:23:18 | GLD | MID | BUY | CALL | 2026-02-27 | $97M | $490 | 85,000 | 826 | 84,650 | $459.40 | $11.44 | GLD20260227C490 |
| 11:23:17 | GLD | MID | BUY | CALL | 2026-02-27 | $63M | $510 | 85,000 | 675 | 84,650 | $459.40 | $7.48 | GLD20260227C510 |
| 11:23:18 | GLD | MID | BUY | CALL | 2026-02-13 | $43M | $505 | 81,000 | 81,000 | 80,700 | $459.40 | $5.35 | GLD20260213C505 |
| 11:23:17 | GLD | MID | BUY | CALL | 2026-02-13 | $39M | $495 | 54,000 | 81,000 | 53,700 | $459.40 | $7.27 | GLD20260213C495 |
| 11:23:18 | GLD | MID | BUY | CALL | 2026-02-13 | $20M | $495 | 81,000 | 81,000 | 27,000 | $459.40 | $7.28 | GLD20260213C495 |
Total Premium: $262 Million 💰
🧠 What This Actually Means (The Calendar Roll)
OK, let's decode this trade because on the surface "$262M in call buying" sounds wildly bullish - and it IS bullish, but the story is more nuanced than that.
This is a calendar roll - a classic institutional move where you close out near-term positions and re-establish them at a later date. Here's what's happening:
Closing (Buy-to-Close) - Feb 13 Expiration:
- Rows 3-5 are BTC (buy-to-close) orders on existing Feb 13 calls at the $495 and $505 strikes
- Combined premium: $102M to close these positions
- These were existing positions being unwound before the Feb 13 expiration
Opening (Buy-to-Open) - Feb 27 Expiration:
- Rows 1-2 are BTO (buy-to-open) orders for NEW Feb 27 calls at the $490 and $510 strikes
- Combined premium: $160M in fresh bullish bets
- The Feb 27 legs showed extremely unusual z-scores 🔥🔥🔥
In Plain English: This trader had big bullish bets on gold expiring Feb 13. Instead of letting them expire or cashing out, they ROLLED them forward to Feb 27 AND moved to slightly different strikes. Translation: They still think gold is going higher - they just want more time for the move to play out.
The fact that they're spending $160M on fresh calls with nearly a month of runway tells you they're not looking for a quick flip. They expect GLD to push toward $490-$510 by late February. With GLD at $459 right now, that implies they're expecting another 6.7% to 11% upside in the next 28 days.
Unusual Score: 9.5/10 🔥🔥🔥
📈 Technical Setup
Year-to-Date Performance
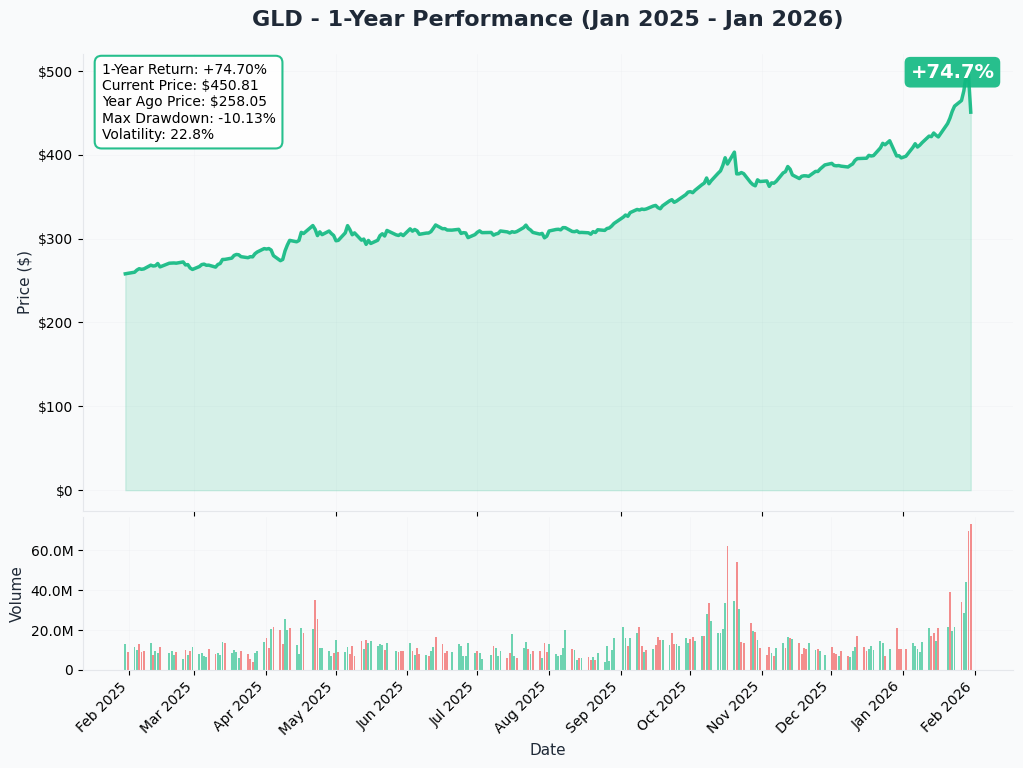
GLD has been one of the best-performing assets of the past 12 months, and it's not even close:
- 1-Year Return: +94.81% - nearly doubled
- YTD 2026: +18% already (and it's only January!)
- 1-Month: +22.76% - an incredible January surge
- 52-Week High: $514.02 (just hit days ago)
- Gold Price: Spot gold hit $5,520/oz on January 29
The rally has been relentless, driven by the perfect storm of geopolitical chaos, central bank buying, and safe-haven demand. But the chart also shows we're WAY above any reasonable moving average, which means pullbacks can be sharp when they come.
🎯 Gamma Levels & Key Support/Resistance
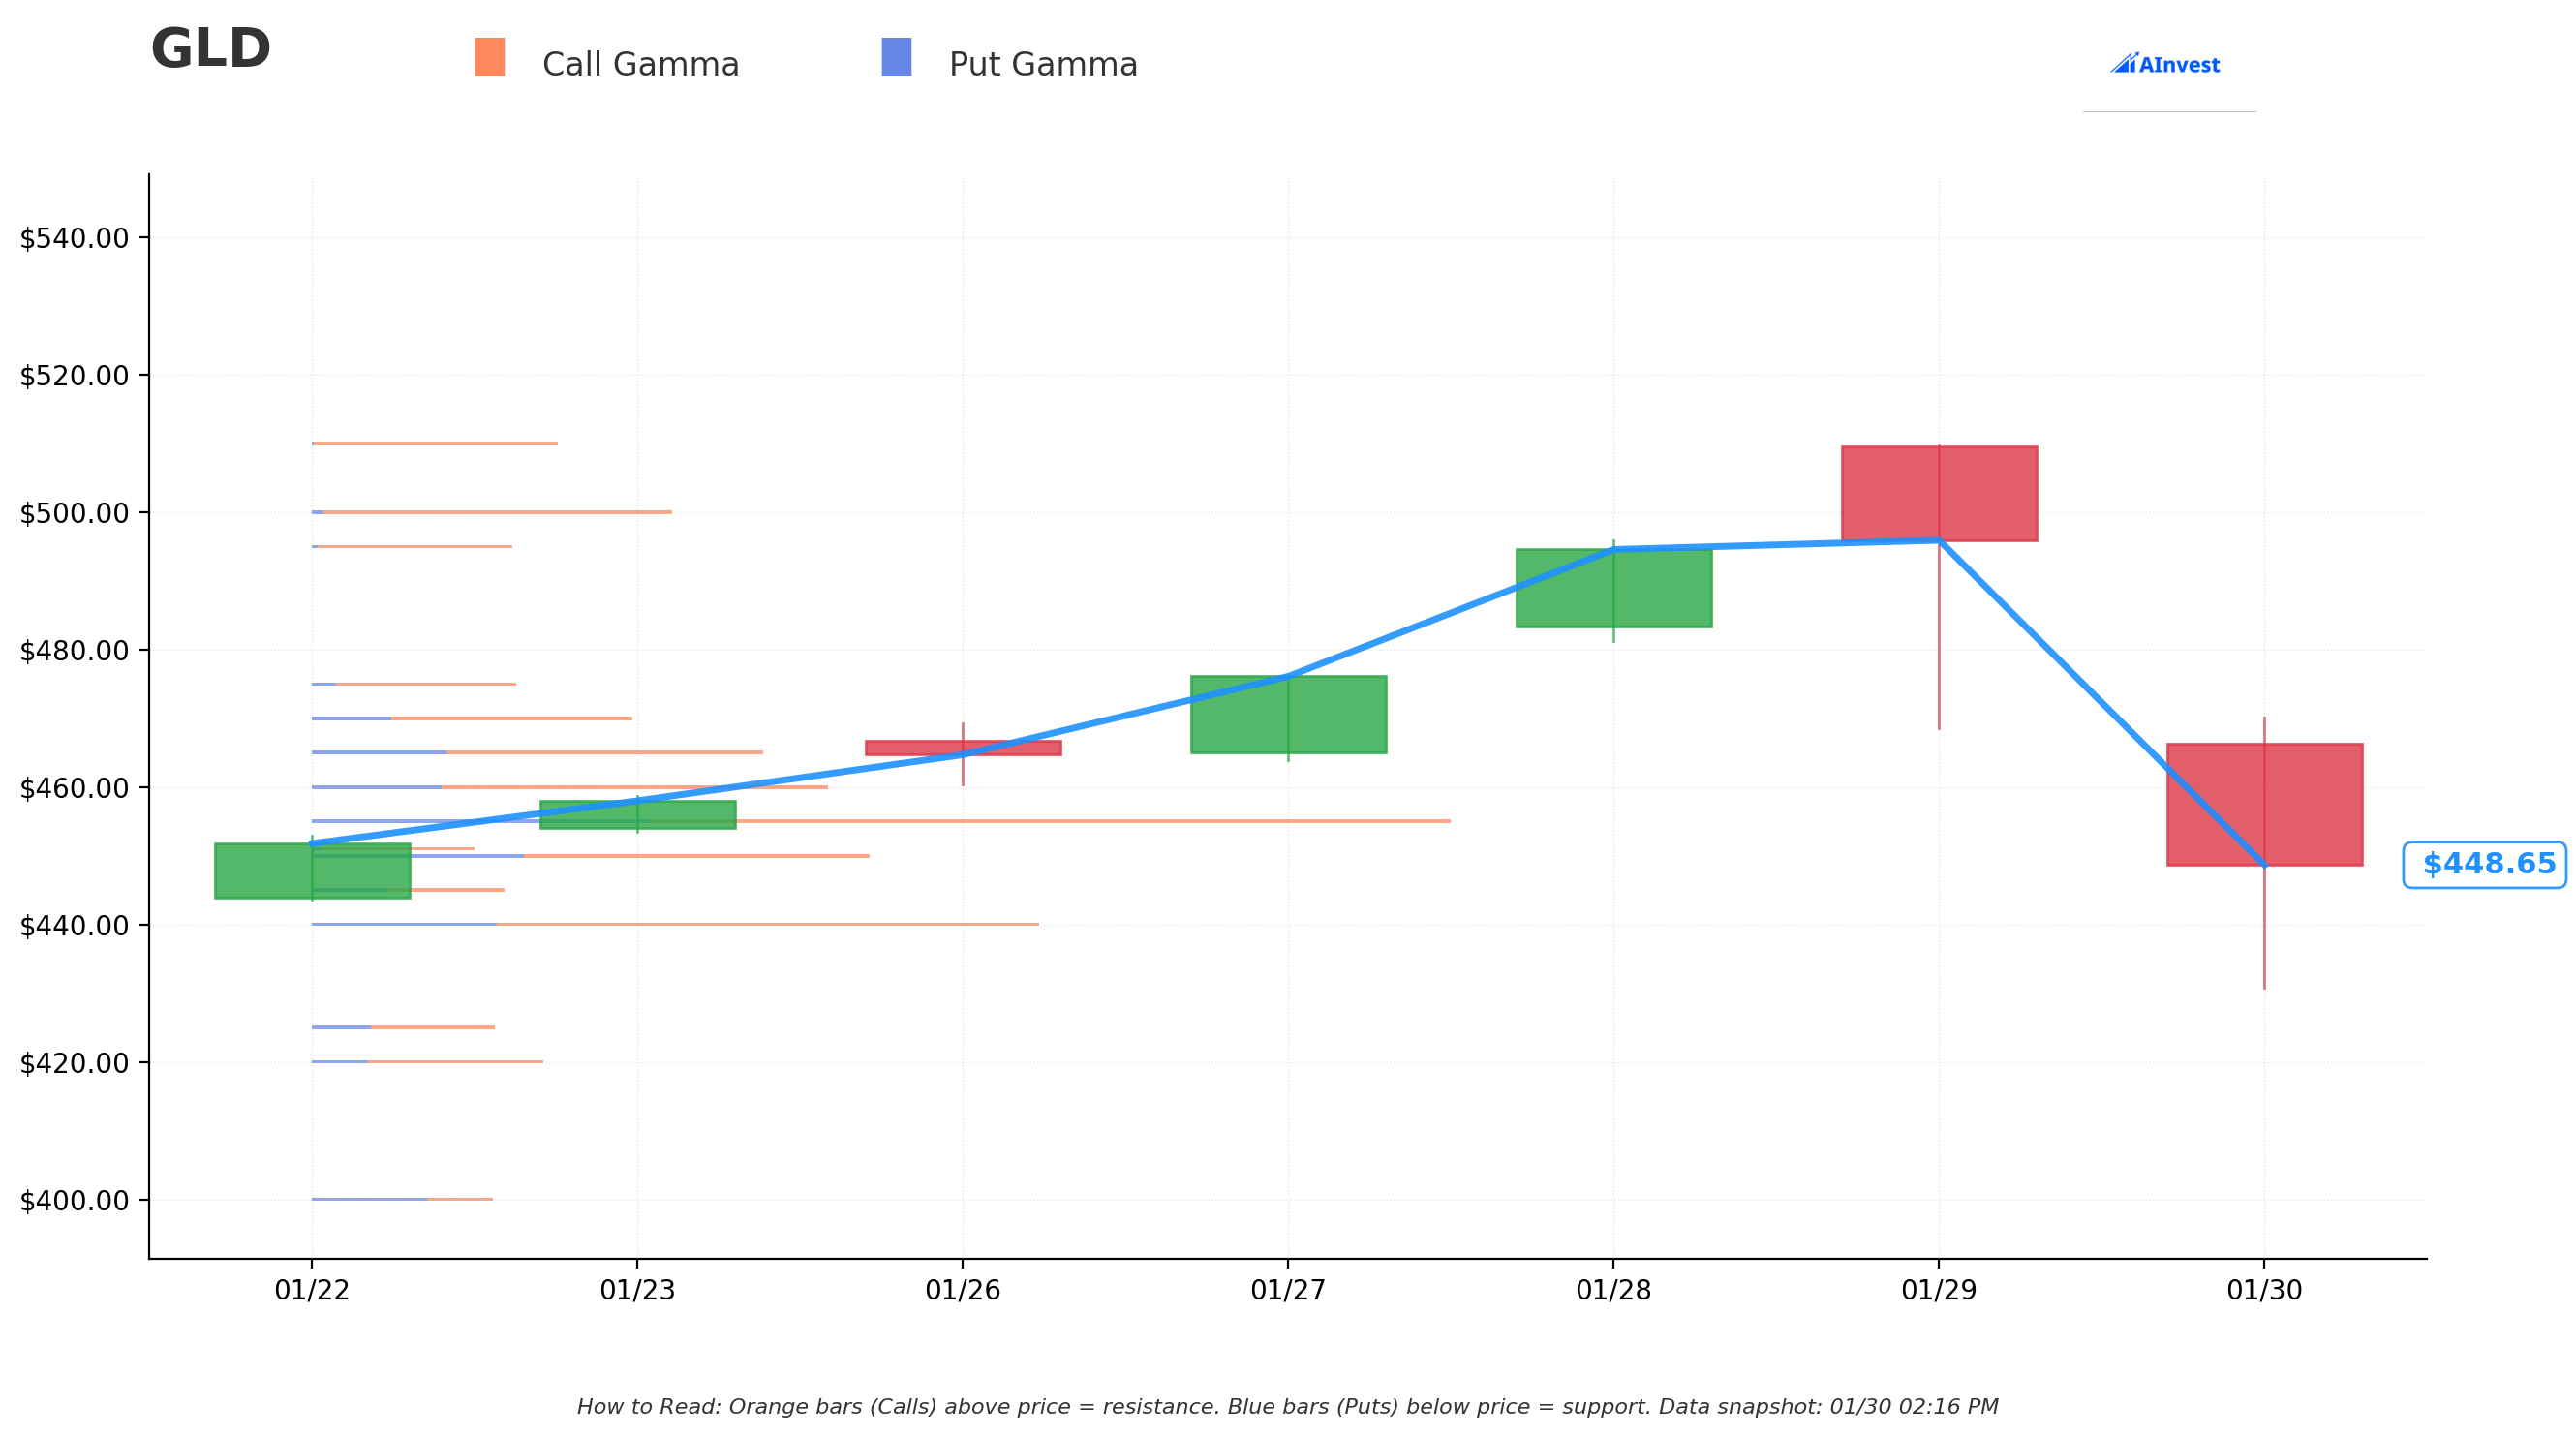
Here's where things get tactically interesting. The gamma exposure (GEX) data shows us where the market maker "walls" are - think of these as invisible price magnets:
Key Support Levels (Where buyers step in): 🛡️
- $440 - Strongest gamma support (gamma: 158) - this is the big floor
- $425 - Secondary support (gamma: 39)
- $420 - Deep support (gamma: 45)
Key Resistance Levels (Where sellers build up): 🧱
- $450 - Near-term resistance (gamma: 103)
- $455 - Strongest resistance level (gamma: 196) - the big wall
- $460 - Important level (gamma: 85)
- $465 - Continuation resistance (gamma: 66)
- $470 - Extended resistance (gamma: 57)
Net GEX Bias: Bullish 📈
The gamma profile tells an important story: there's strong support at $440, which gives a solid floor about 3.5% below the current price. The resistance at $455 is the first hurdle, but if GLD can punch through that, the next stops are $460-$470. Given the current momentum, the $262M calendar roll trader is clearly betting on a push through these resistance levels.
📐 Implied Move Data
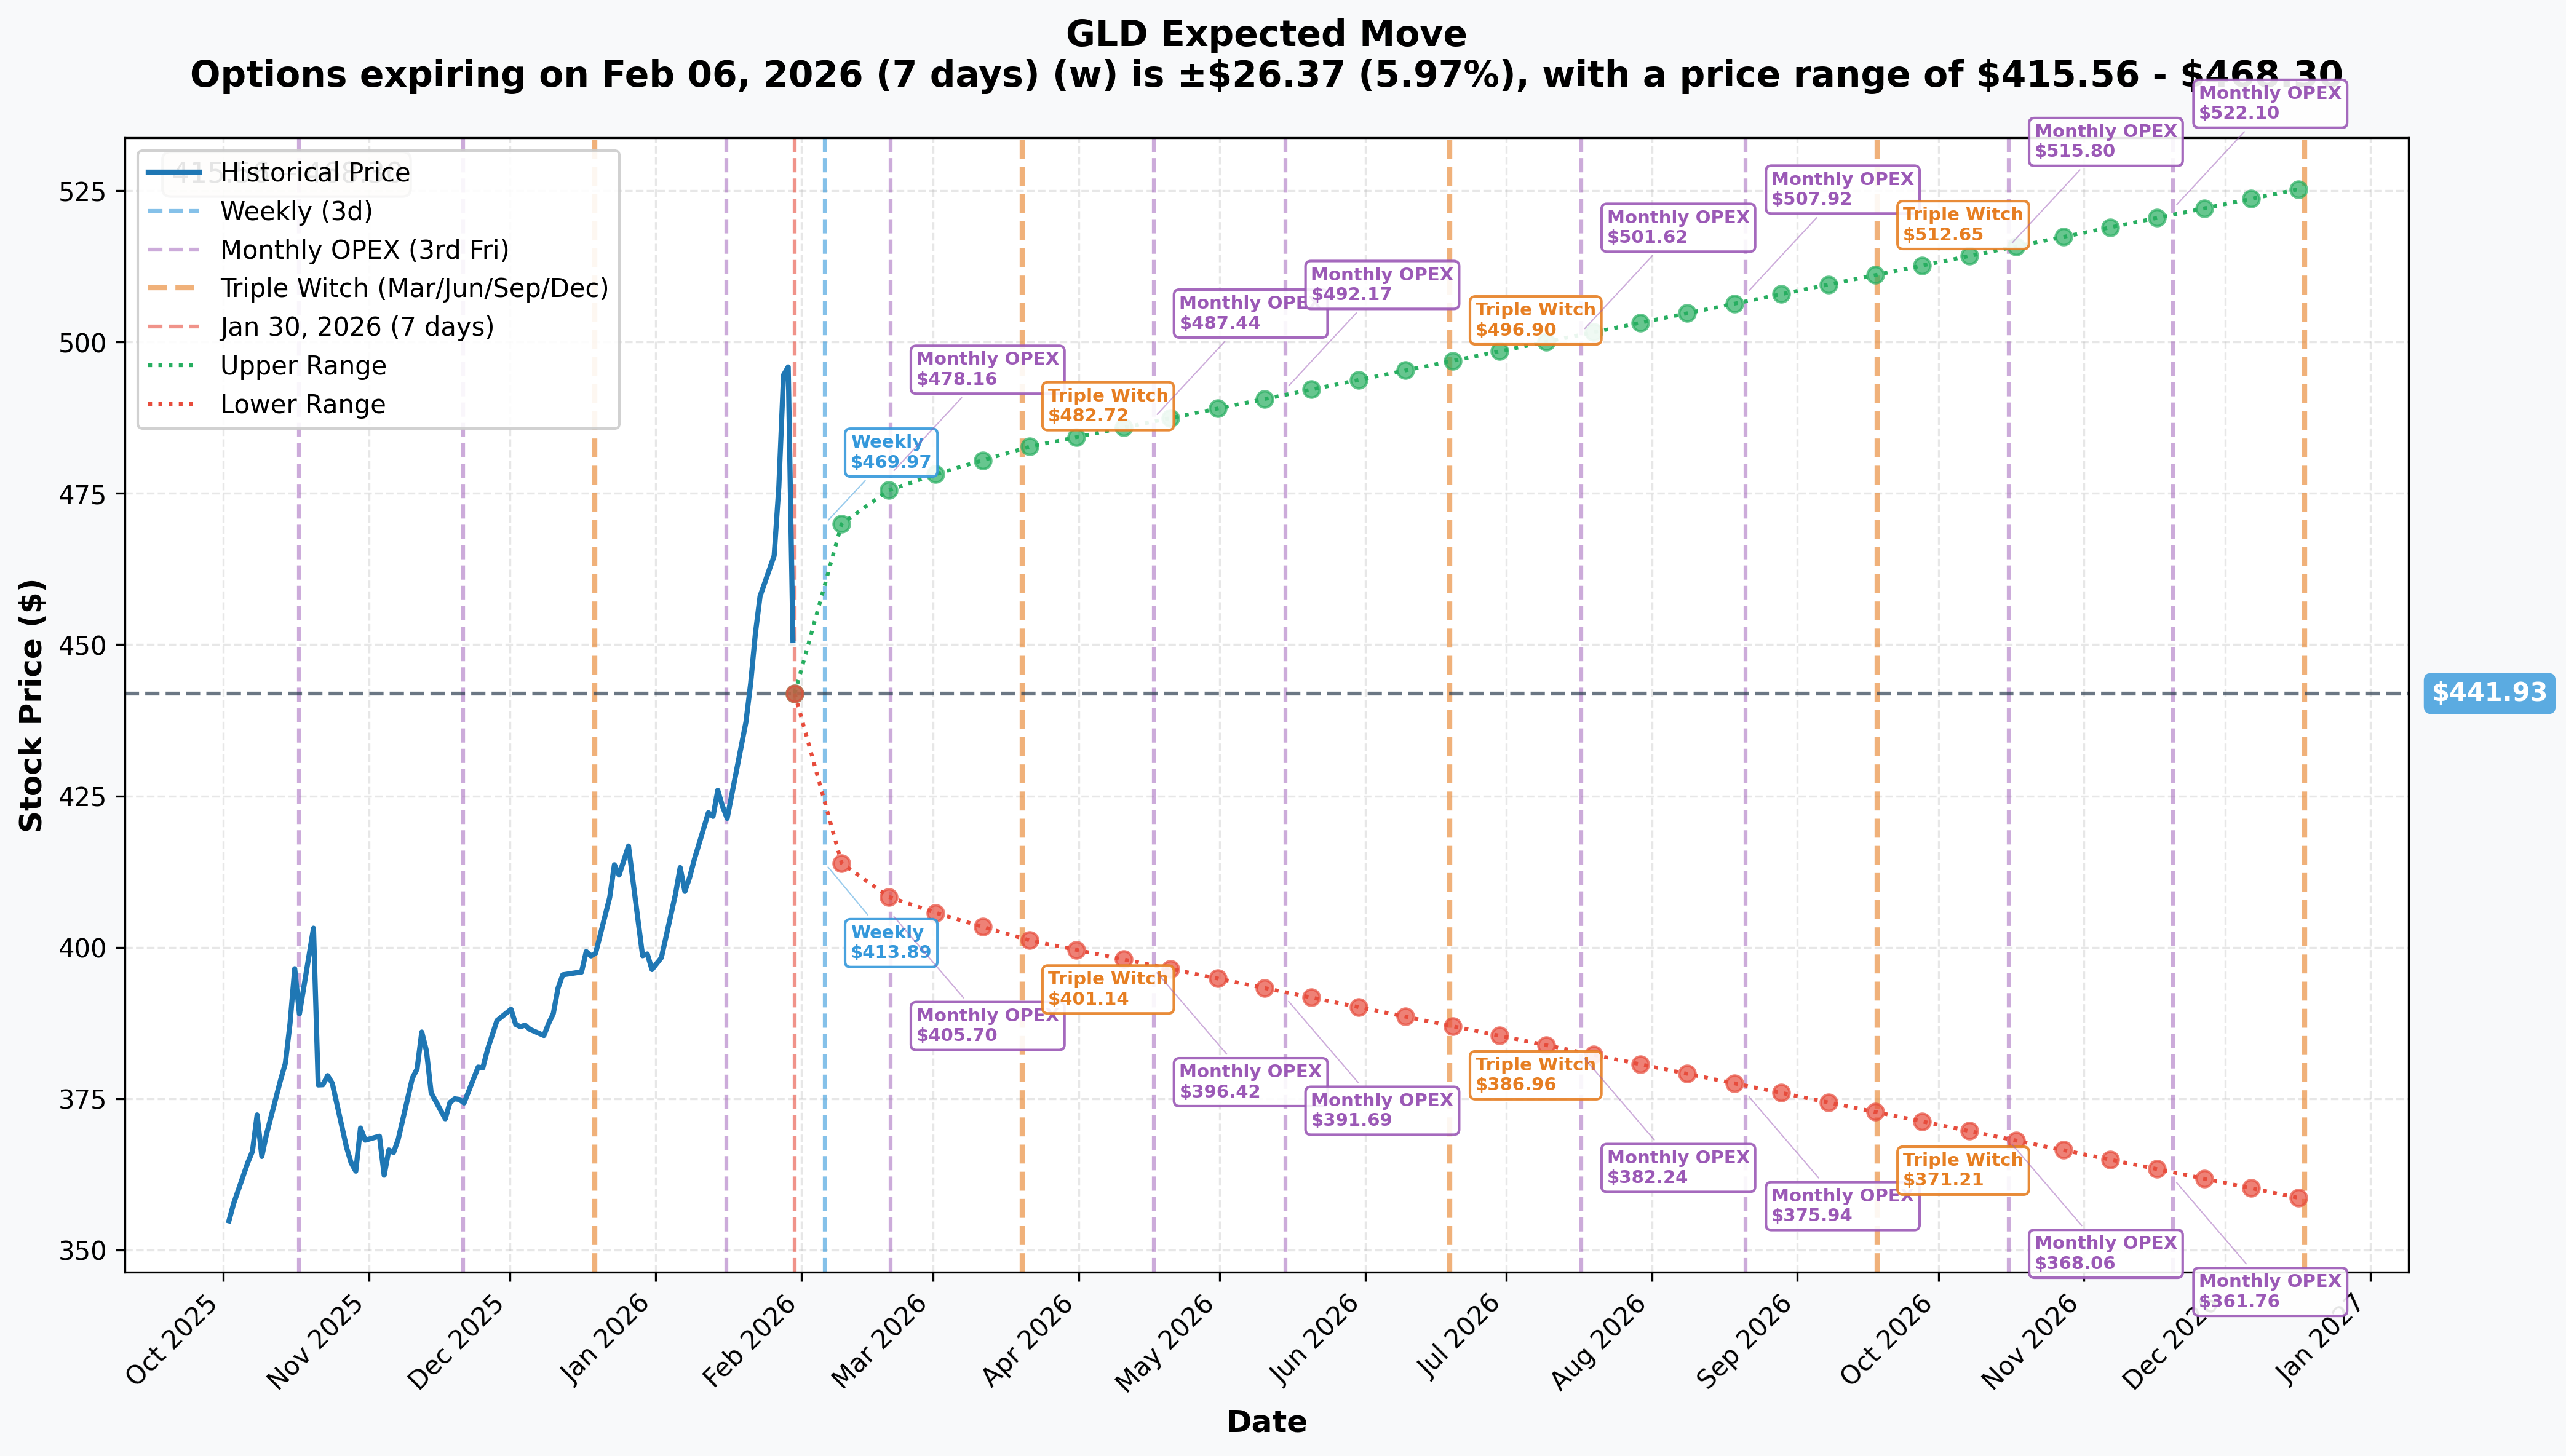
The options market is pricing in some serious movement for GLD. Here's what the implied volatility is telling us:
| Timeframe | Implied Move | Range |
|---|---|---|
| Weekly (Feb 6) | +/-$26.37 (6.0%) | $415.56 - $468.30 |
| Monthly OPEX (Feb 20) | +/-$34.15 (7.7%) | $407.78 - $476.08 |
| Quarterly Triple Witch (Mar 20) | +/-$40.63 (9.2%) | $401.30 - $482.56 |
| Yearly LEAPS (Dec 18) | +/-$83.64 (18.9%) | $358.29 - $525.57 |
A few things jump out:
- The weekly implied move of 6% is significant for an ETF - that tells you volatility is elevated
- The Feb 27 calls that our whale bought ($490-$510 strikes) fall right at the upper end of the monthly implied range ($476) to slightly beyond it - they're betting on a tail move
- The yearly LEAPS range tops out at $525.57, which lines up with many Wall Street year-end gold targets
- This is a gold ETF moving like a growth stock - wild times
📰 Catalysts: Why Gold Can't Stop, Won't Stop
🔥 What's Driving Gold Right Now
The catalyst backdrop for gold is about as dense as it gets. Here's the rundown:
Geopolitical Chaos (Primary Driver):
- U.S.-EU trade war escalating over Greenland - 10% tariffs on 8 European nations, rising to 25% by June
- Trump threatened 200% tariffs on French wine and 100% on Canadian imports
- U.S. military intervention in Venezuela adding to global instability
- VIX surged ~27% in the final week of January
Federal Reserve (January 28):
- Fed held rates steady at 3.50-3.75% after three 25bp cuts in late 2025
- Two dissenters voted for a cut - dovish undercurrent building
- Markets pricing at most two cuts in 2026
- Powell's term ends May 2026 - successor Kevin Hassett favors lower rates
Central Bank Buying (Structural):
- 863 tonnes purchased in 2025 - still well above historical averages
- 43% of central banks plan to increase gold holdings in 2026 - highest in 8 years of surveys
- Poland added 102 tonnes in 2025, targeting 700 tonnes for "national security"
Record ETF Inflows:
- December 2025 saw $10 billion in global gold ETF inflows - seventh straight month of positive flows
- GLD's 1-year net flows: +$23.49 billion
- Gold ETF AUM more than doubled in 2025
Dollar Weakness:
- DXY fell ~2% in January - worst monthly performance since June
- Trump expressing little concern over dollar weakness
- Strong inverse gold-DXY correlation in play
📅 Upcoming Catalysts
| Date | Event | Impact |
|---|---|---|
| Feb 11, 2026 | January CPI Release | Hot print = more gold demand |
| Mar 17-18, 2026 | FOMC + Dot Plot | Key for rate path clarity |
| May 2026 | Powell's term ends | Dovish successor = bullish gold |
| June 2026 | EU tariffs rise to 25% | Escalation or resolution - big either way |
| Jun 16-17, 2026 | FOMC + Dot Plot | Under potential new Fed chair |
🎯 Wall Street Gold Price Targets
The sell-side is basically tripping over each other to raise their gold forecasts:
| Institution | Year-End 2026 Target | Source |
|---|---|---|
| J.P. Morgan (base) | $5,055/oz (Q4 avg) | |
| J.P. Morgan (upside) | $8,000-$8,500/oz | |
| Goldman Sachs | $5,400/oz | |
| Bank of America | $5,000/oz | |
| Deutsche Bank | $4,950-$6,000/oz | |
| Yardeni Research | $6,000/oz | |
| ICBC Standard Bank | $7,150/oz (upside) |
Here's the catch: gold is already at $5,520/oz as of January 29 - that's above most of these year-end targets. Either analysts need to raise their targets (again), or we're due for a breather. The calendar roll trader seems to be betting on the "keep going higher" camp, at least through February.
🎲 Price Targets & Probabilities
🐂 Bull Case: $490-$510 (GLD) - 35% probability
- Gold pushes toward $6,000/oz on continued geopolitical escalation
- February CPI comes in hot, boosting inflation hedge demand
- Central bank buying accelerates
- This is what the $262M calendar roll is betting on
- Timeline: Next 4 weeks
📊 Base Case: $455-$475 (GLD) - 45% probability
- Gold consolidates between $5,000-$5,300/oz
- Volatility remains elevated but momentum slows
- GLD grinds along near the $455 gamma resistance
- Healthy after a 22% January
- Timeline: Next 2-4 weeks
🐻 Bear Case: $420-$440 (GLD) - 20% probability
- Geopolitical de-escalation (Ukraine peace deal, tariff resolution)
- Dollar rebounds sharply
- Gold corrects 5-20% as WGC warned
- Profit-taking cascades after the parabolic January move
- Gold is 25% above its 200-DMA - overbought territory
- Timeline: If $440 support breaks
💡 Trading Ideas
🛡️ Conservative: "Ride the Roll"
Buy GLD Feb 27 $470 Call @ ~$8.00
- Follows the institutional flow into the Feb 27 expiration
- Less aggressive strike than the whale's $490/$510
- Break-even around $478
- Risk: $800 per contract
- Target: $490+ for 150%+ return
⚖️ Balanced: "Bull Call Spread"
Buy GLD Feb 27 $465 Call Sell GLD Feb 27 $490 Call
- Defined risk spread that profits if GLD pushes through resistance
- Lower cost than outright calls
- Max profit at $490 (matches the whale's lower strike)
- Good risk/reward if you think the gamma wall at $455 gets cleared
🔥 Aggressive: "Follow the Whale"
Buy GLD Feb 27 $490 Call @ ~$11.44
- Same strike as the biggest single leg ($97M premium)
- You're literally shadowing a $160M institutional bet
- Needs GLD at $501+ to profit at expiration
- High risk, high reward - this is 6.7% OTM
- Only for traders with strong conviction on gold continuation
🛡️ Hedged: "Gold Pullback Buy"
Sell GLD Feb 27 $440 Put @ ~$3.50
- Collect premium while agreeing to buy GLD at $440 (strongest gamma support)
- Break-even at $436.50 - well below the gamma floor
- If gold pulls back, you own GLD at a discount at a key support level
- If gold keeps ripping, you pocket the premium
⚠️ Risk Factors
Let's keep it real - gold has been a freight train, but there are risks:
- 📈 Extreme Overbought: Gold is 25%+ above its 200-DMA - historically a level that precedes corrections
- 🎯 Above Consensus Targets: At $5,520/oz, gold has already blown past most year-end 2026 targets - a lot of good news is priced in
- 🕊️ Geopolitical De-escalation: Any diplomatic breakthroughs on Ukraine, Greenland, or trade disputes would pull the rug on safe-haven flows
- 💵 Dollar Reversal: The weak DXY has been a tailwind - if it reverses, gold gets headwinds
- 📉 Central Bank Fatigue: At $5,500/oz, central banks need fewer tonnes to hit portfolio targets - buying may slow
- 💸 Expense Ratio: GLD's 0.40% fee is 4x that of GLDM (0.10%) - long-term holders may prefer cheaper alternatives
- 🚀 Parabolic Moves End Badly: The steeper the rally, the sharper the eventual correction - this is just math
🎬 The Bottom Line
Here's the deal: A major institutional player just executed a $262 million calendar roll on GLD, closing out near-term February 13 calls and opening fresh positions in February 27 calls at the $490 and $510 strikes. This is NOT someone taking profits - this is someone EXTENDING their bullish bet and giving themselves more time for gold to run.
With gold already up 95% over the past year and 18% in January alone, you might think all the easy money is made. But this trader is putting $160M of fresh capital to work saying "there's more upside ahead." The catalyst deck supports them: trade wars escalating, the Fed on hold, a potentially dovish new Fed chair coming in May, and central banks still buying gold hand over fist.
The key question: Can gold keep this pace, or is a breather coming?
My read: The structural bull case for gold is rock solid - de-dollarization, geopolitical uncertainty, and central bank diversification aren't going away anytime soon. But the PACE of the January rally (+22% in one month!) is unsustainable. I'd expect some consolidation before the next leg higher.
What to do:
- If you're already long gold - stay the course, but consider tightening stops to the $440 gamma support
- If you want in - the Feb 27 bull call spread gives you defined-risk upside exposure
- If you think gold needs a breather - cash-secured puts at $440 let you collect premium at the strongest support level
- If you're a momentum trader - follow the whale into the Feb 27 $490 calls, but size appropriately (this is a high-conviction, high-risk trade)
The $262M calendar roll tells us the smart money isn't done with gold yet. Whether you follow them or fade them, at least now you know what they're doing. 💪
Disclaimer: This analysis is for educational purposes only and not investment advice. Options trading involves substantial risk of loss. Always do your own research and manage your risk.
Data Sources:
- Options flow data from tape analysis
- Gamma levels from GEX calculations
- Price data from market feeds
- Catalyst research from cited sources
- ETF data from ETF Database and State Street Global Advisors