🥇 GLD: $184 MILLION Gold Rush - Whales Build Massive Butterfly Before CPI!
📅 February 9, 2026 | 🔥 Unusual Activity Detected
🎯 The Quick Take
Someone just deployed $184 MILLION in GLD options in a single coordinated trade at 2:37 PM - this is one of the largest gold ETF option trades of 2026! The structure suggests a modified call butterfly targeting the $475 strike by February 20 OPEX, betting gold continues its rally but caps out before $490. With January CPI dropping in 4 days and gold sitting at all-time highs near $5,000/oz, this whale is positioning for a very specific price outcome.
💰 The Option Flow Breakdown
📊 What Just Happened
| Time | Direction | Strike | Expiration | Volume | OI | Premium | Vol/OI |
|---|---|---|---|---|---|---|---|
| 14:37:02 | 🟢 BUY | $475 | 2026-02-20 | 140,000 | 61,000 | $88M | 2.30x |
| 14:37:02 | 🔴 SELL | $460 | 2026-02-20 | 45,000 | 65,000 | $58M | 0.69x |
| 14:37:02 | 🔴 SELL | $490 | 2026-02-20 | 84,000 | 12,000 | $20M | 7.00x |
| 14:37:02 | 🟢 BUY | $460 | 2026-02-20 | 58,000 | 65,000 | $18M | 0.89x |
💰 Total Premium Deployed: $184,000,000
🧩 Strategy Detection: Modified Call Butterfly
Breaking down the net position:
- 📈 460 Strike: Net Long 13,000 contracts (Buy 58K - Sell 45K)
- 📈 475 Strike: Long 140,000 contracts (the "body" of the butterfly)
- 📉 490 Strike: Short 84,000 contracts (the upper wing)
Translation for us regular folks:
This is a bullish call butterfly structure - the whale is betting GLD lands near $475 at February 20 expiration. Here's what makes this interesting:
- 🎯 Maximum profit zone: $475 (if GLD closes exactly here, massive payday)
- 🛡️ Downside protection: The 460 longs provide a cushion if gold pulls back
- 🚧 Capped upside: The 490 shorts cap gains if gold rockets above $490
- 💡 Net debit: This trade cost serious premium to enter, indicating strong conviction
The Vol/OI ratio of 7.0x at the 490 strike is particularly notable - that's 7x more volume than existing open interest, meaning fresh positions being established. These aren't retail traders - this is institutional money with a very specific thesis.
📈 Technical Setup / Chart Check-Up
📊 YTD Performance
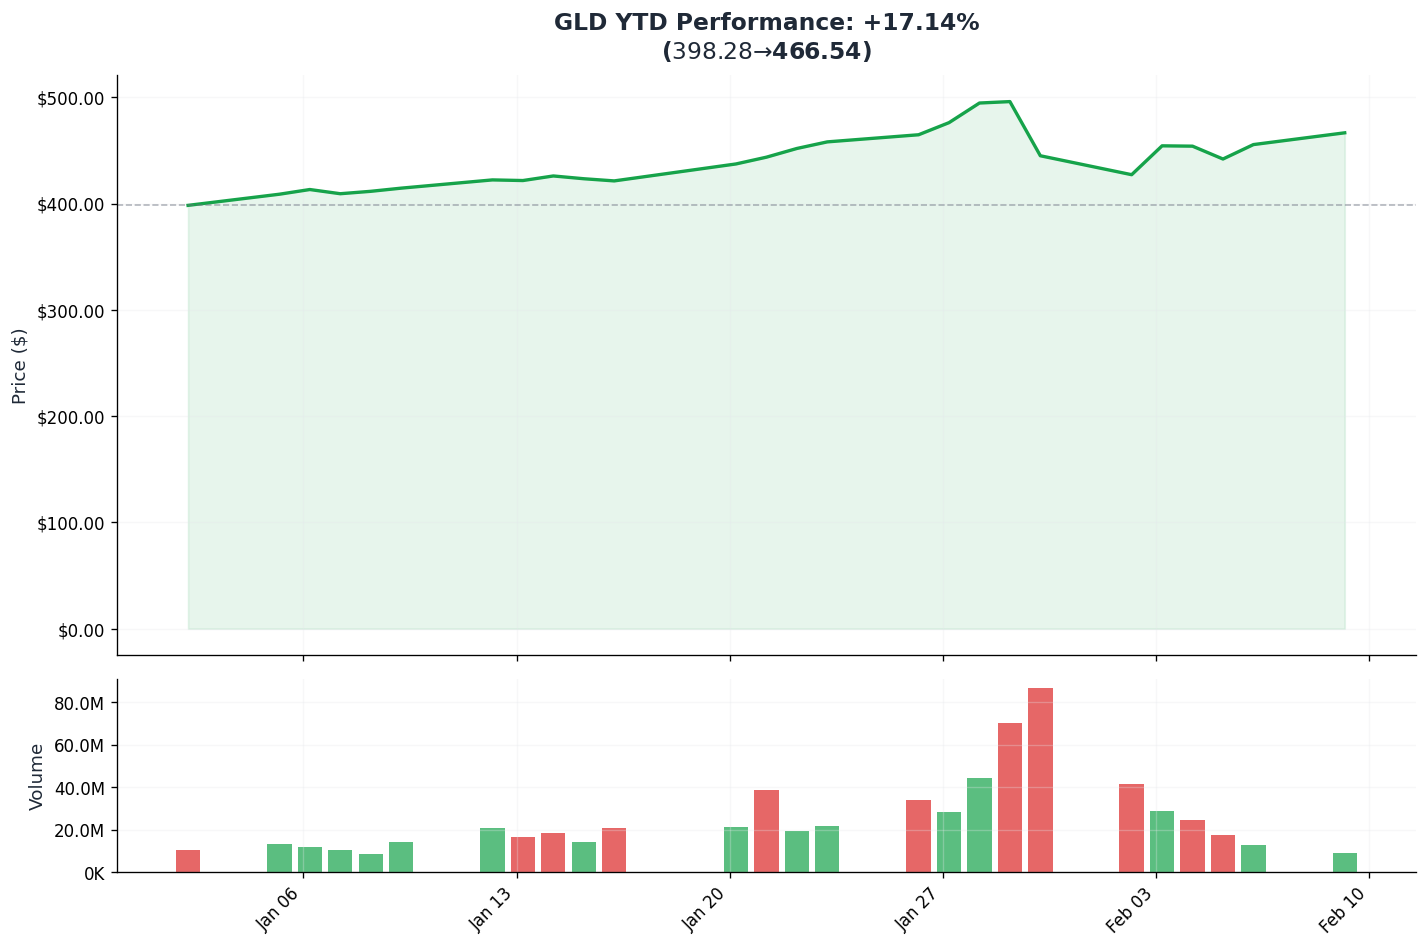
GLD has been on an absolute tear in 2026! The SPDR Gold Shares ETF tracks physical gold bullion, and with spot gold hitting all-time highs above $5,000/oz, the ETF is up over 71% year-over-year. The recent "Warsh Shock" caused an 11% correction from the January 30 peak of $5,608, but gold has rebounded strongly to $5,031 as of February 9.
Key ETF Metrics:
- 💰 AUM: $167.66 billion (largest physically-backed gold ETF)
- 📊 Expense Ratio: 0.40%
- 📈 52-Week Range: $261.25 - $509.70
- 🔥 1-Month Return: +11.46%
🔵🟠 Gamma-Based Support & Resistance Analysis
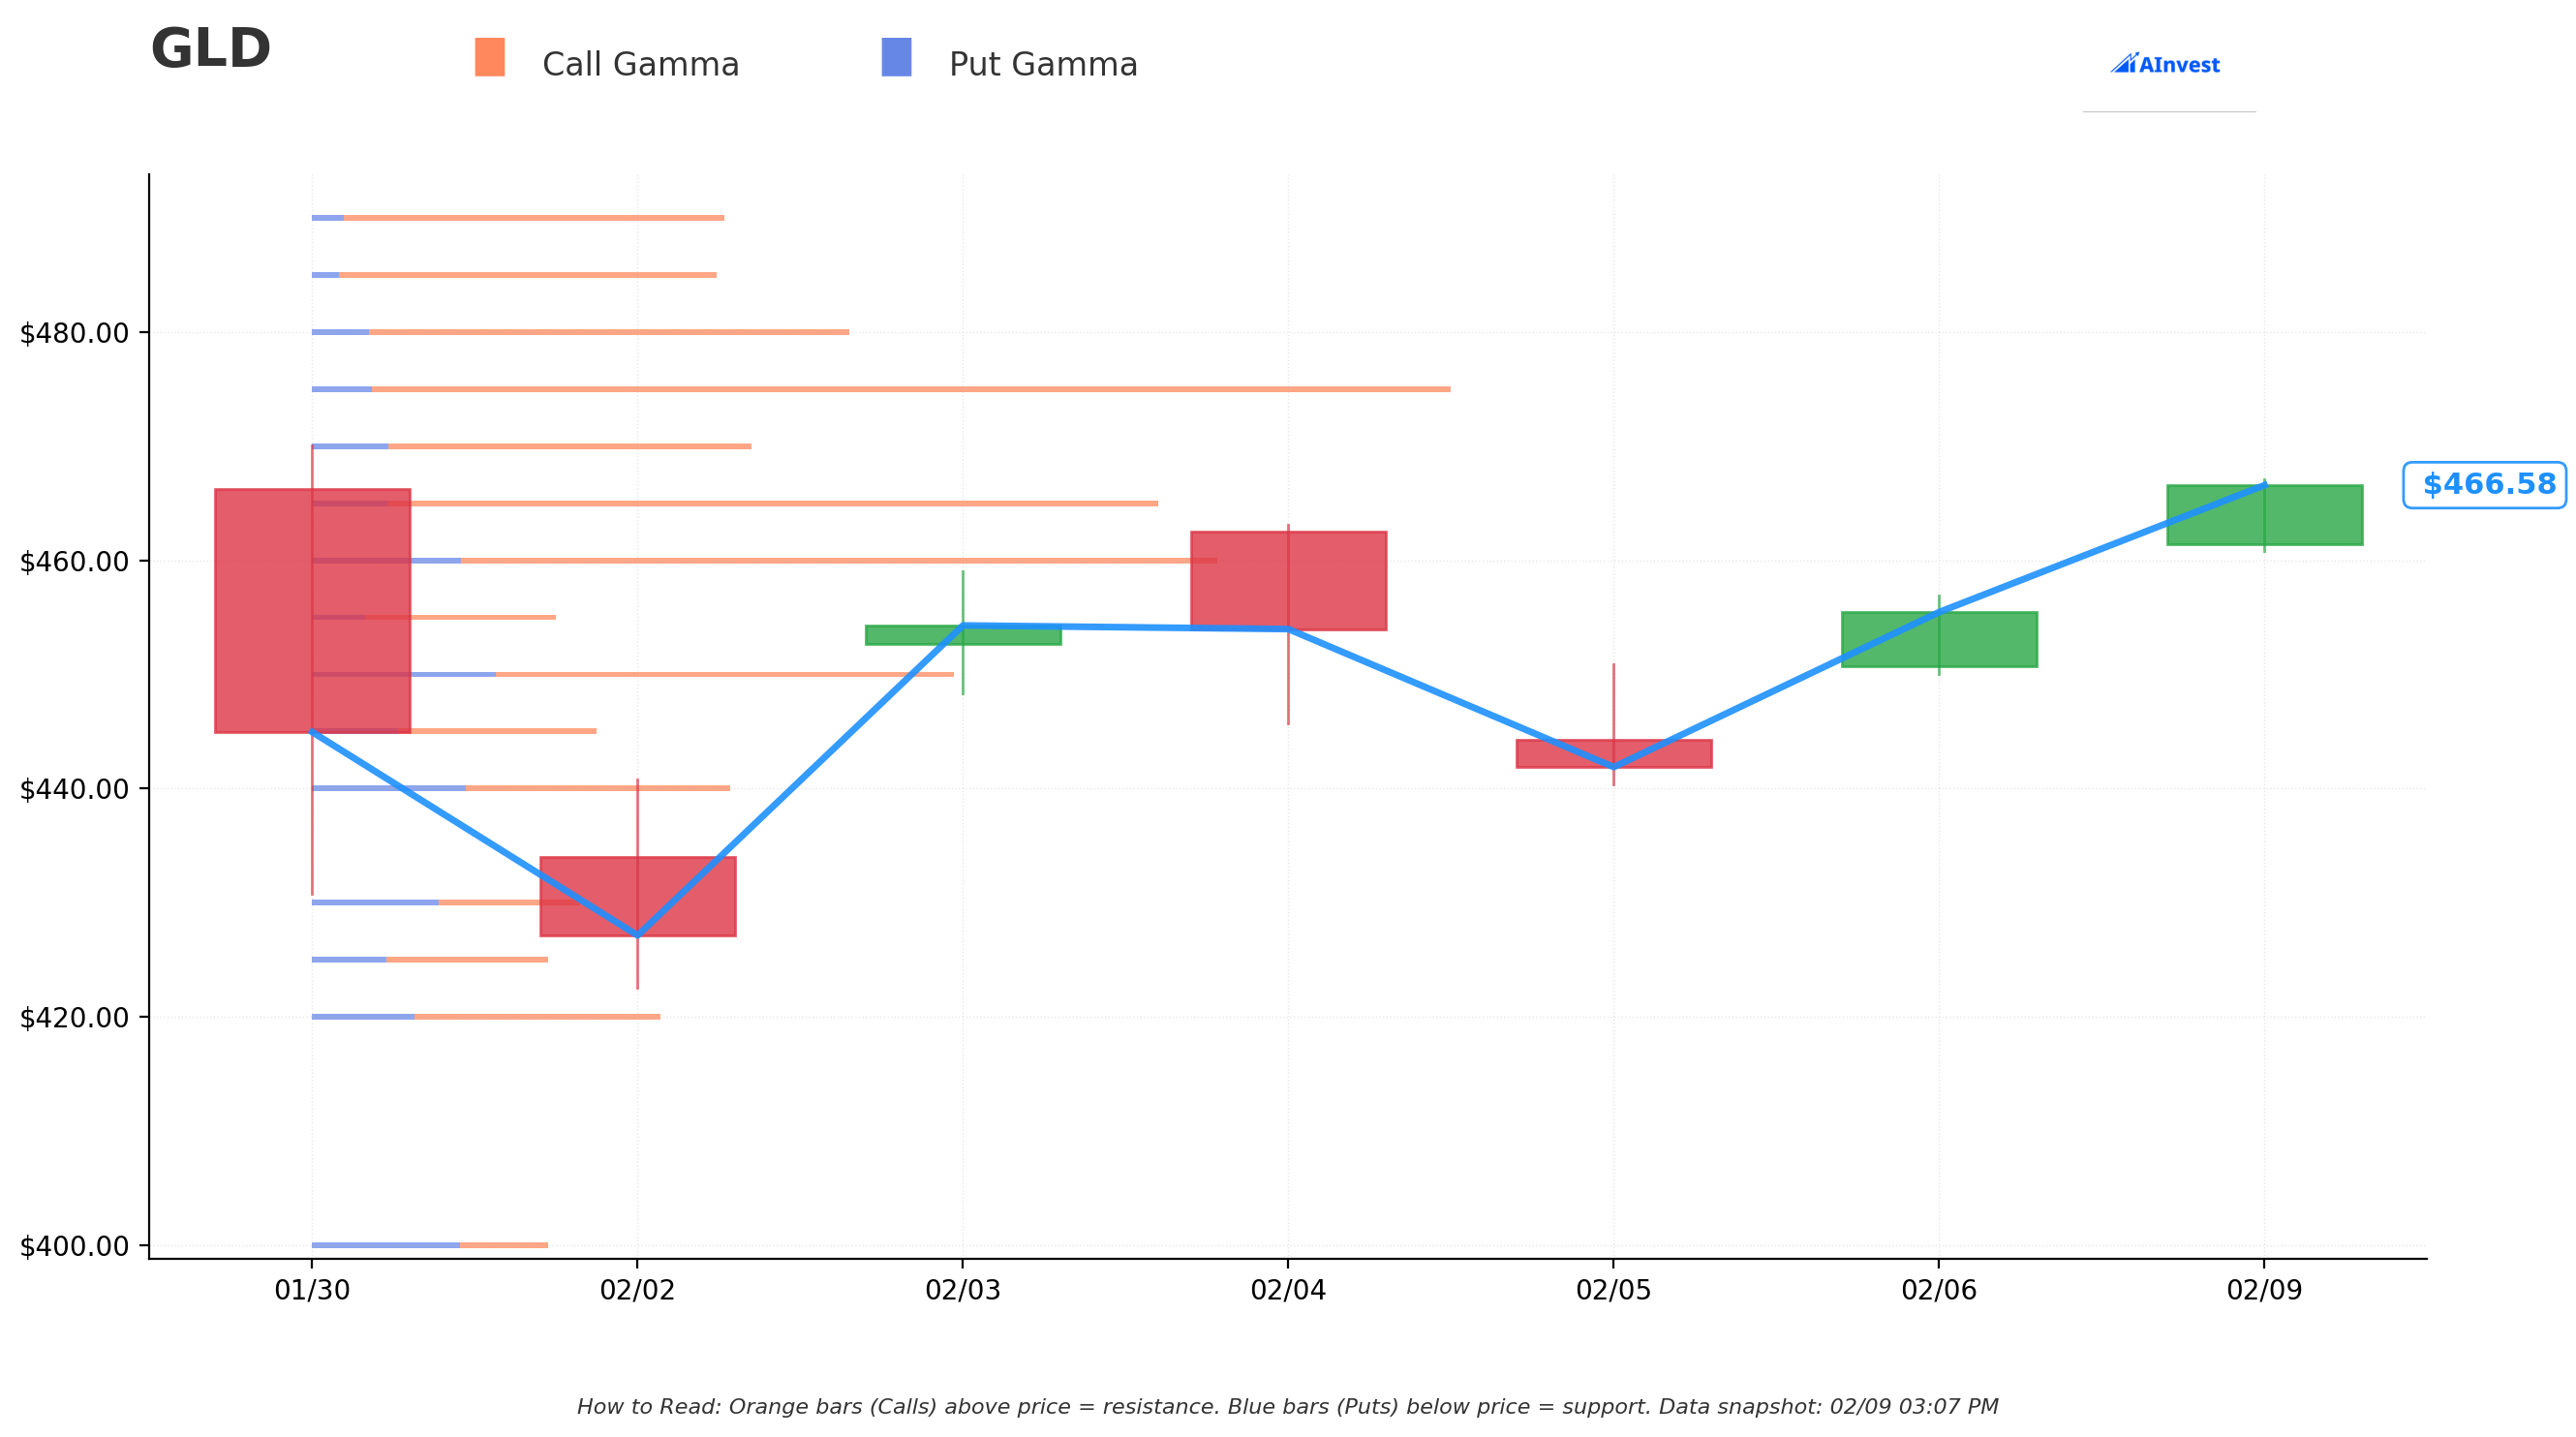
Current Price: $466.41
The gamma exposure (GEX) data reveals where market makers have significant hedging obligations. These levels act as magnets and barriers for price action.
🛡️ Support Levels (Put Gamma - Where Buyers Step In):
| Strike | Net GEX | Distance | Strength |
|---|---|---|---|
| $465 | 68.91 | 0.3% | 🟢🟢🟢🟢 Strongest |
| $460 | 58.81 | 1.4% | 🟢🟢🟢 Strong |
| $450 | 27.43 | 3.5% | 🟢🟢 Moderate |
| $440 | 10.74 | 5.7% | 🟢 Light |
🚧 Resistance Levels (Call Gamma - Where Selling Pressure Builds):
| Strike | Net GEX | Distance | Strength |
|---|---|---|---|
| $470 | 27.28 | 0.8% | 🟠🟠 Moderate |
| $475 | 97.46 | 1.8% | 🟠🟠🟠🟠🟠 MASSIVE |
| $480 | 40.59 | 2.9% | 🟠🟠🟠 Strong |
| $490 | 33.39 | 5.1% | 🟠🟠 Moderate |
| $500 | 57.38 | 7.2% | 🟠🟠🟠🟠 Strong |
📊 GEX Bias: Bullish (Total Call GEX: 1,022 vs Put GEX: 293)
Real talk: The $475 strike has massive gamma concentration with a net GEX of 97.46 - the highest of any strike! This explains exactly why the whale chose this as the butterfly body. Market makers will be delta-hedging heavily around this level, creating a natural magnet effect. The $465 strike provides immediate support just 0.3% below current price.
📉 Implied Move Analysis
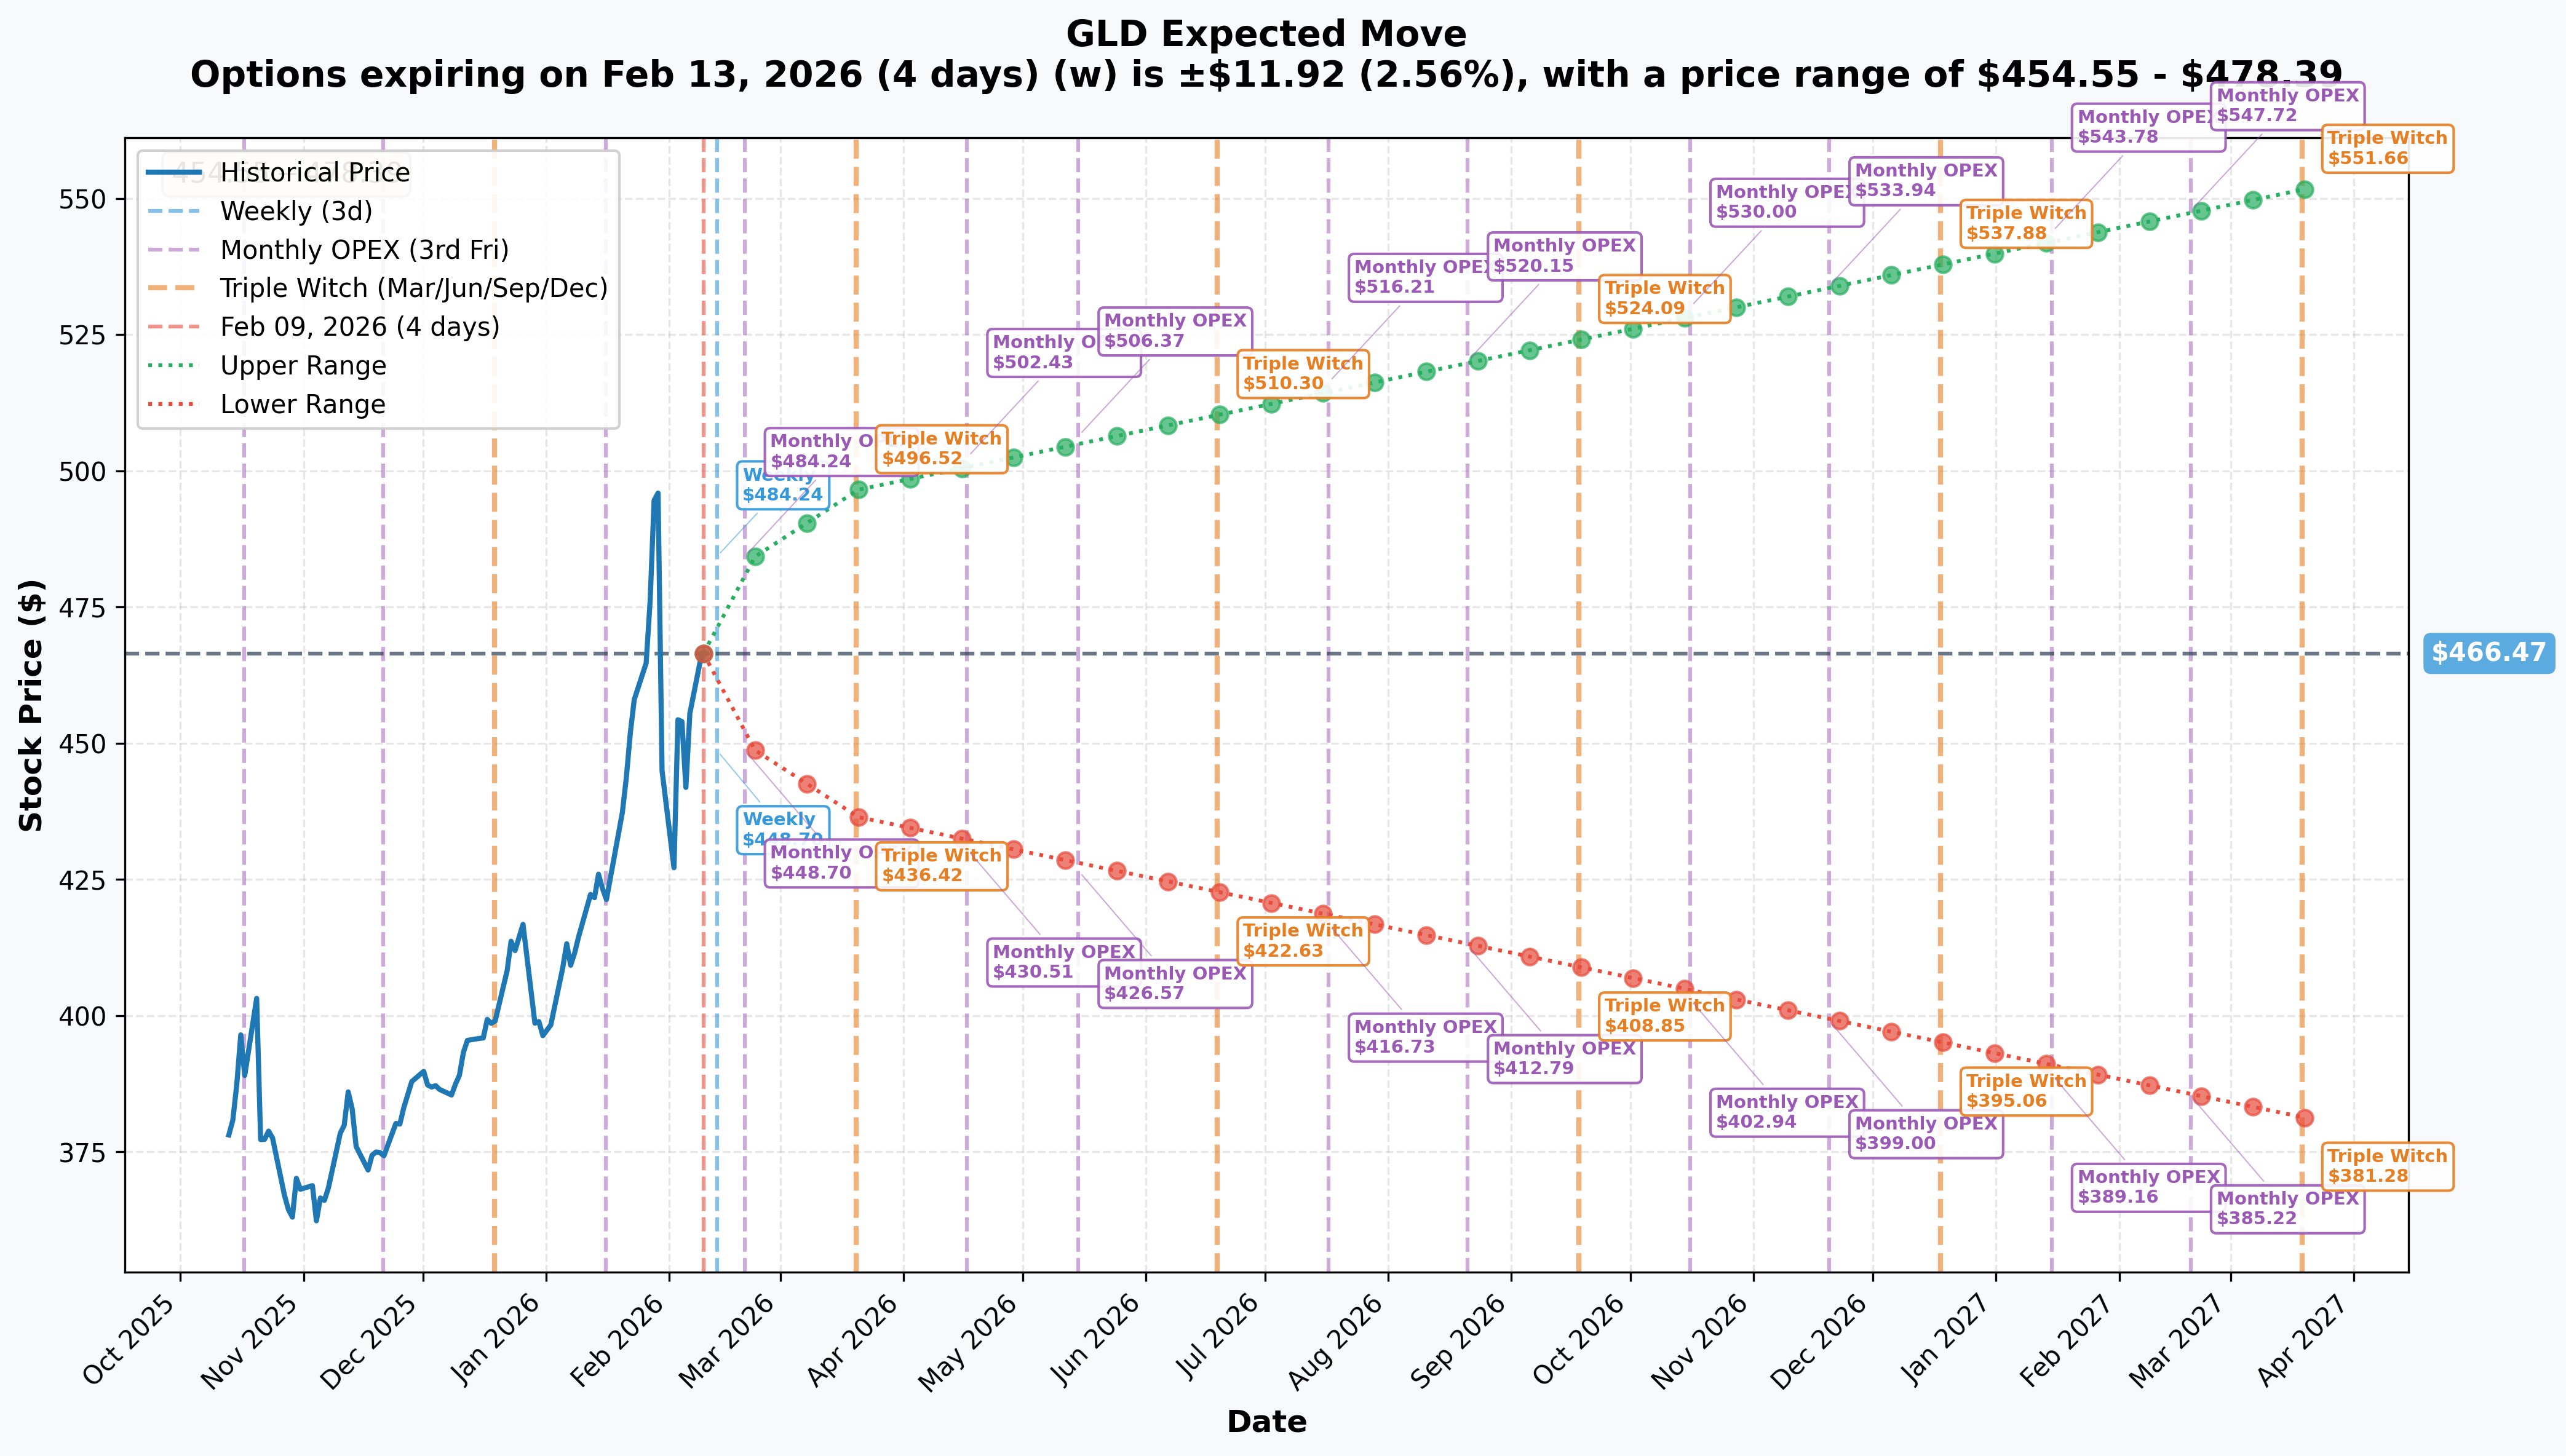
The options market is pricing in the following expected moves:
| Timeframe | Expiry | Implied Move | Range |
|---|---|---|---|
| Weekly | Feb 13 (CPI Day!) | ±2.56% | $454.55 - $478.39 |
| Monthly OPEX | Feb 20 | ±3.61% | $449.64 - $483.30 |
| Triple Witch | Mar 20 | ±6.44% | $436.42 - $496.52 |
| LEAPS | Mar 2027 | ±18.26% | $381.28 - $551.66 |
Key Insight: The butterfly's $475 target sits right at the upper bound of the weekly implied move ($478.39). The trader expects GLD to rally toward the top of the expected range but not break through. The $490 short cap is well above the monthly implied move upper bound ($483.30), providing room for error.
🎪 Catalysts
🔮 Upcoming Catalysts (Mark Your Calendar!)
| Date | Event | Expected Impact |
|---|---|---|
| Feb 13, 2026 | January CPI Release | 🔥🔥🔥 VERY HIGH |
| Feb 20, 2026 | Monthly OPEX (Trade Expiration!) | 🔥🔥🔥 |
| Mar 17-18, 2026 | FOMC Meeting + SEP | 🔥🔥🔥 VERY HIGH |
| May 2026 | Powell Term Ends, Warsh Confirmation | 🔥🔥🔥 VERY HIGH |
📰 Recent Catalysts (What Got Us Here)
🔥 DOJ Investigation into Fed Chair Powell (January 2026) The Department of Justice served the Fed with subpoenas related to Powell's testimony. Gold surged 6% as investors fled to safe havens. According to ETF Stream, the criminal probe is expected to spur continued gold ETF demand.
🏦 Kevin Warsh Nomination (January 30, 2026) Trump nominated Kevin Warsh to succeed Powell as Fed Chair. The "Warsh Shock" triggered an 11% gold correction from $5,608 to $4,900 - but gold has since recovered to $5,031.
💰 Record ETF Inflows (January 2026) Global gold ETFs attracted $19 billion in January 2026 - the strongest month on record. Asia accounted for 51% of flows, with China alone contributing $6 billion.
📊 January FOMC Meeting The Fed held rates steady at 3.50-3.75% with a "hawkish hold" stance. The December 2025 SEP signaled only one 25bp cut for 2026.
🎲 Price Targets & Probabilities
Based on gamma levels, implied move data, and the butterfly structure:
🐂 Bull Case: $483-$490 (February 20)
Probability: 25%
- Requires: Hot CPI print driving gold higher + continued safe-haven flows
- Target aligns with monthly implied move upper bound ($483.30)
- Gamma resistance at $490 may cap upside
- UBS targets $6,200/oz gold by September 2026
📊 Base Case: $470-$480 (February 20)
Probability: 50%
- The butterfly's maximum profit zone ($475)
- Strong gamma concentration creates magnet effect
- Inline with CPI consensus and steady Fed policy
- Current price at $466 needs only 2% move higher
🐻 Bear Case: $450-$460 (February 20)
Probability: 25%
- Requires: Cooler CPI + Warsh confirmation removes uncertainty
- Strong support at $465 and $460 gamma levels
- World Gold Council warns of 15-20% correction risk from current levels
- Dollar strength could pressure gold prices
💡 Trading Ideas
🛡️ Conservative: "Gold Standard Play"
Strategy: Buy GLD shares with stop loss
- 📈 Entry: Buy GLD at current price (~$466)
- 🛑 Stop Loss: $454 (below weekly implied move lower bound)
- 🎯 Target: $483 (monthly implied move upper)
- 💰 Risk/Reward: 1:1.4
Why this works: Follows institutional money direction without the complexity of options. The butterfly whale is bullish on gold reaching $475+, and you can ride the same wave with defined risk. If CPI comes in hot, gold could pop.
⚖️ Balanced: "Butterfly Lite"
Strategy: Simplified 460/475 bull call spread
- 📈 Buy: GLD Feb 20 $460 Call @ ~$13.50
- 📉 Sell: GLD Feb 20 $475 Call @ ~$6.30
- 💵 Net Debit: ~$7.20 per spread ($720 per contract)
- 🎯 Max Profit: $7.80 per spread at $475 (108% return)
- 💔 Max Loss: $7.20 debit (if GLD below $460)
- 🔀 Breakeven: $467.20
Why this works: This captures the same directional thesis as the whale but with simpler execution. You're betting GLD moves from $466 to $475 by February 20 - a 2% move that's well within the implied range. The February 13 CPI is your catalyst.
🚀 Aggressive: "Ride the Whale"
Strategy: Mimic the butterfly structure
- 📈 Buy 1x: GLD Feb 20 $460 Call @ ~$13.50
- 📈 Buy 2x: GLD Feb 20 $475 Call @ ~$6.30 ($12.60 total)
- 📉 Sell 2x: GLD Feb 20 $490 Call @ ~$2.40 ($4.80 credit)
- 💵 Net Debit: ~$21.30 per butterfly ($2,130 for 1 lot)
- 🎯 Max Profit: At $475 = substantial gain
- 💔 Max Loss: $21.30 debit
Why this works: You're copying institutional flow! The whale deployed $184M into this exact structure because they have a specific thesis about gold settling near $475 by OPEX. With CPI in 4 days and massive gamma at $475, this strike could act as a magnet. High risk, high reward.
⚠️ Risk Factors
🚨 Near-Term Risks
- 📉 Cooler CPI Print: If January CPI comes in below 2.9%, gold could sell off as inflation fears ease
- 💵 Dollar Strength: DXY forecast to average 100.73 in February - a stronger dollar pressures gold
- 🏛️ Warsh Confirmation: If Senate confirms Warsh quickly, his hawkish stance could strengthen the dollar and weigh on gold
- 📊 Overbought RSI: Technical indicators show RSI at 80 with bearish divergence forming
⚡ Structural Risks
- 🎢 Flash Crash Precedent: The January 30 correction showed gold can drop 11% rapidly
- 🐋 Crowded Trade: Record ETF inflows = crowded positioning = correction risk
- 💔 Physical Demand Weakness: Record prices are crushing jewelry demand in India and China
🔥 Execution Risks (for options trades)
- ⏰ Time Decay: Only 11 days to expiration - theta burns fast
- 📈 Pin Risk: Heavy gamma at $475 could cause erratic price action at OPEX
- 💧 Liquidity: GLD options are liquid, but spreads may widen during volatility
🎯 The Bottom Line
Real talk: A $184 million butterfly trade targeting $475 by February 20 is not something you see every day. This is institutional money with a very specific thesis: gold rallies into CPI, potentially spikes on a hot print, but doesn't break $490.
Here's the deal:
🟢 If you're bullish on gold: The butterfly structure suggests the whale expects $475, not a moonshot to $500+. Consider the bull call spread (Balanced strategy) to capture 2-4% upside with defined risk. The February 13 CPI is your key catalyst.
🟡 If you're watching from the sidelines: The gamma concentration at $475 is massive. Watch how GLD trades around this level - if it gets pulled toward $475 into OPEX, the whale's thesis is playing out.
🔴 If you're bearish: The $465 and $460 supports are strong gamma floors. If CPI disappoints or Warsh gets confirmed, $454 (weekly implied move lower) is your target. Consider put spreads below $460.
Mark your calendar: February 13 CPI release is the make-or-break moment. The butterfly expires February 20, giving just 7 trading days after CPI to reach the $475 target.
📊 Institutional Price Targets for Gold:
| Firm | Target | Timeframe |
|---|---|---|
| UBS | $6,200/oz | Sep 2026 |
| J.P. Morgan | $6,300/oz | End 2026 |
| Wells Fargo | $6,100-$6,300/oz | End 2026 |
At current gold prices of ~$5,031/oz, these targets imply 21-25% upside for the year. The whale's near-term butterfly is just capturing a piece of this potential move.
⚠️ Disclaimer: This analysis is for informational purposes only and does not constitute investment advice. Options trading involves significant risk including the potential loss of principal. Past performance does not guarantee future results. Always conduct your own research and consider your risk tolerance before trading.
🔗 Quick Links: