🐋 GLD $209M Covered Call Fortress -- The Biggest Option Trade of the Day as Gold's Mega-Bull Gets Leashed!
📅 February 26, 2026 | 🔥 Unusual Activity Detected
🎯 The Quick Take
Someone controlling an estimated $11.3 BILLION in gold exposure just collected $209 MILLION in premium by selling calls across three massive blocks on GLD -- the biggest single-name option trade of the entire day. This is a tiered covered call program spanning $440 to $570 strikes through March and May, telling us a massive institutional gold holder is taking chips off the table and capping their upside. With gold up +69% over the past year and geopolitical catalysts stacking up like firewood, this whale is saying: "I love gold, but I'll take $209M in cash right now, thanks."
📊 ETF Overview
SPDR Gold Shares (GLD) is the world's largest physically-backed gold ETF:
- 🥇 What it tracks: Physical gold bullion held in London vaults
- 💰 AUM: $180.08B (managed by State Street Global Advisors)
- 🏢 Sector: Commodity Contracts Brokers & Dealers
- 📈 Exchange: NYSE Arca
- 📊 Current Price: ~$475
- 📊 Spot Gold: ~$5,169-$5,210/oz
- 📊 52-Week Range: $261.25 - $509.70
- 📊 52-Week Return: +69.29%
- 📊 YTD Return: +15.64%
- 📊 2025 Full-Year Return: +64% (best since 1979)
- 📊 Holdings: 1,094.19 tonnes of physical gold
- 🔥 Key Story: Gold recovering from January's 12% flash crash, tariff-driven safe-haven demand surging, and a massive institutional holder just locked in $209M of income by selling call premium
💰 The Option Flow Breakdown
📊 The Tape -- Three Blocks of Pure Institutional Power
| Time | Symbol | Side | Buy/Sell | Type | Expiration | Premium | Strike | Volume | OI | Size | Spot | Option Price |
|---|---|---|---|---|---|---|---|---|---|---|---|---|
| 10:37:50 | GLD | ASK | SELL | CALL $440 | 2026-03-20 | $103M | $440 | 53K | 36K | 26,650 | $474.35 | $38.60 |
| 10:44:51 | GLD | ASK | SELL | CALL $495 | 2026-03-20 | $85M | $495 | 92K | 1.5K | 45,950 | $475.43 | $18.45 |
| 10:50:55 | GLD | ASK | SELL | CALL $570 | 2026-05-15 | $21M | $570 | 92K | 320 | 45,950 | $476.33 | $4.60 |
Combined Total: $209M in premium collected across 237,000 contracts
Notional Exposure: ~$11.3B in GLD shares (23.7 million shares)
🤓 What This Actually Means
Let me break this down -- because $209 million in a single morning is not something you see every day. This is the largest option flow event of the entire session, and it screams "institutional covered call program" at an absolutely massive scale.
Block 1 -- The Deep ITM Covered Call ($440 Strike, $103M) 💸
- 🎯 With GLD at $474.35 and a $440 strike, this call is $34.35 in the money
- 💰 The $38.60 premium breaks down to roughly $34.35 intrinsic + $4.25 time value
- 📊 Translation: the seller is essentially committing to sell shares at an effective price of $478.60 ($440 + $38.60) -- roughly where GLD is trading right now
- 🤔 This is almost a synthetic stock sale disguised as a covered call. The seller gets cash now and caps upside at basically the current price
- 📊 26,650 contracts per block = 2.665M shares per block, times two blocks = 5.33M shares committed
- ⚠️ Volume of 53K vs OI of 36K means this position dwarfs everything that existed before
Block 2 -- The Slightly OTM Cap ($495 Strike, $85M) 🛡️
- 🎯 $495 is about 4.1% above current price -- this caps upside to a modest rally
- 💰 $18.45 per contract in pure extrinsic (time) value -- that's fat premium from elevated IV
- 📊 If GLD stays below $495 by March 20, the seller keeps the entire $85M. Every penny.
- 🤔 This is the "I'll let gold run a little bit higher, but $495 is my ceiling" trade
- ⚠️ Volume of 92K vs OI of just 1.5K -- that is roughly 61x the existing open interest. This is not normal activity -- this is a whale rewriting the options landscape at this strike
Block 3 -- The Far OTM Tail Seller ($570 Strike, $21M) 🎰
- 🎯 $570 is about 20% above current price with a May 15 expiration
- 💰 At $4.60 per contract, this is pure premium harvesting against a return to the all-time high zone
- 📊 The $570 level roughly corresponds to where GLD traded during the January 29 parabolic spike before the Warsh-induced crash
- 🤔 The seller is betting gold does NOT revisit its January highs within 78 days -- collecting $21M for that view
- ⚠️ Volume of 92K vs OI of 320. That is 287x the existing open interest. This is someone painting an entirely new position on a nearly blank canvas
The Big Picture:
All three blocks were executed within 13 minutes (10:37 to 10:50), sold on the ASK side, and classified as Short Call (STO). This was a pre-planned, systematic covered call program. The entity behind this almost certainly owns tens of millions of GLD shares (or the equivalent in physical gold / gold futures) and is:
- ✅ Harvesting elevated implied volatility -- gold IV is around the 66th percentile right now, making call selling attractive
- ✅ Generating massive income -- $209M collected in a single morning
- ✅ Capping their upside -- willing to give up gains above $495 (March) and $570 (May)
- ✅ NOT dumping gold -- this is bullish-neutral, not bearish. They still own the underlying.
This is consistent with a sovereign wealth fund, major commodity fund, or large asset manager (think: GLD's top institutional holders who control billions in gold exposure) running a systematic overwrite program.
📈 Technical Setup / Chart Check-Up
YTD Performance
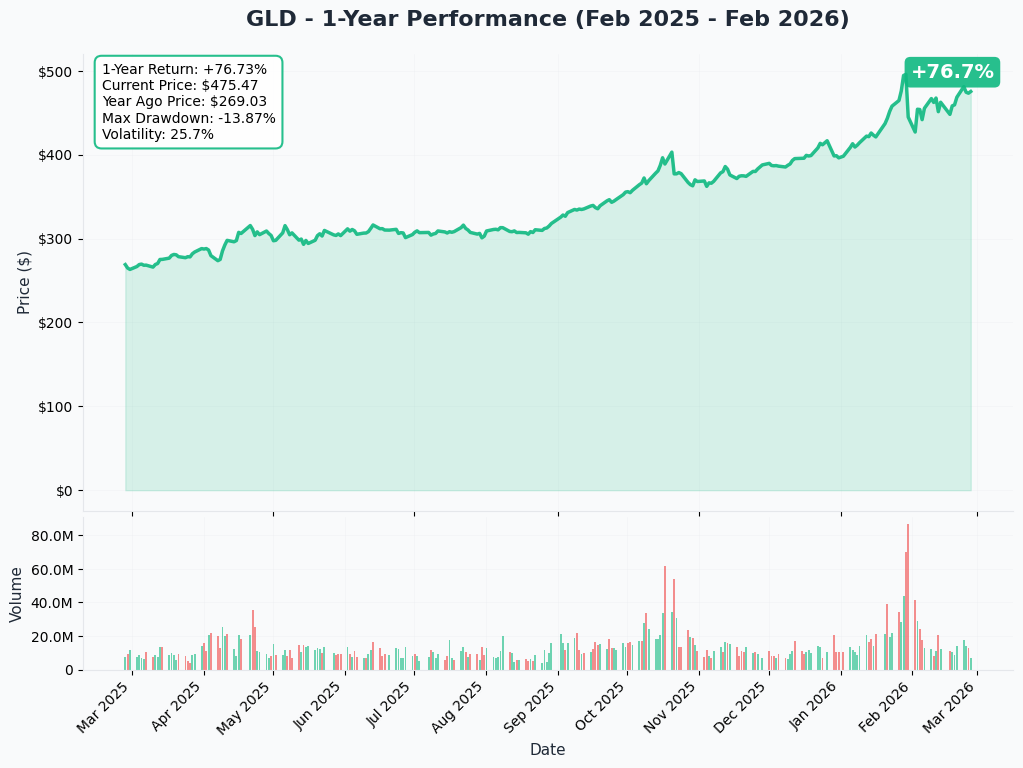
GLD has been on an absolute tear -- up +15.64% YTD after a monster +64% gain in 2025 (the best year for gold since 1979). But the chart tells a more nuanced story:
- 🚀 January parabolic spike to an all-time high of $509.70 (gold at $5,594.82/oz) on January 29
- 💥 The Warsh Crash on January 30 -- gold plunged 12%+ in a single day when Trump nominated Kevin Warsh as Fed Chair, the worst drop since the early 1980s
- 📈 Steady recovery through February, reclaiming $475 as tariff fears and Iran tensions reignited safe-haven buying
- 📊 Still ~7% below the ATH -- the recovery is strong but incomplete
- 💸 $19B in global gold ETF inflows in January -- a monthly record. $9.4B more in February. Money keeps pouring in.
Key takeaway: GLD has recovered impressively from a flash crash that could have ended the rally. The fact that it bounced back to $475 within a month tells you the structural demand is real. But the whale is saying: "The easy money has been made -- time to monetize this position."
Gamma-Based Support & Resistance Analysis
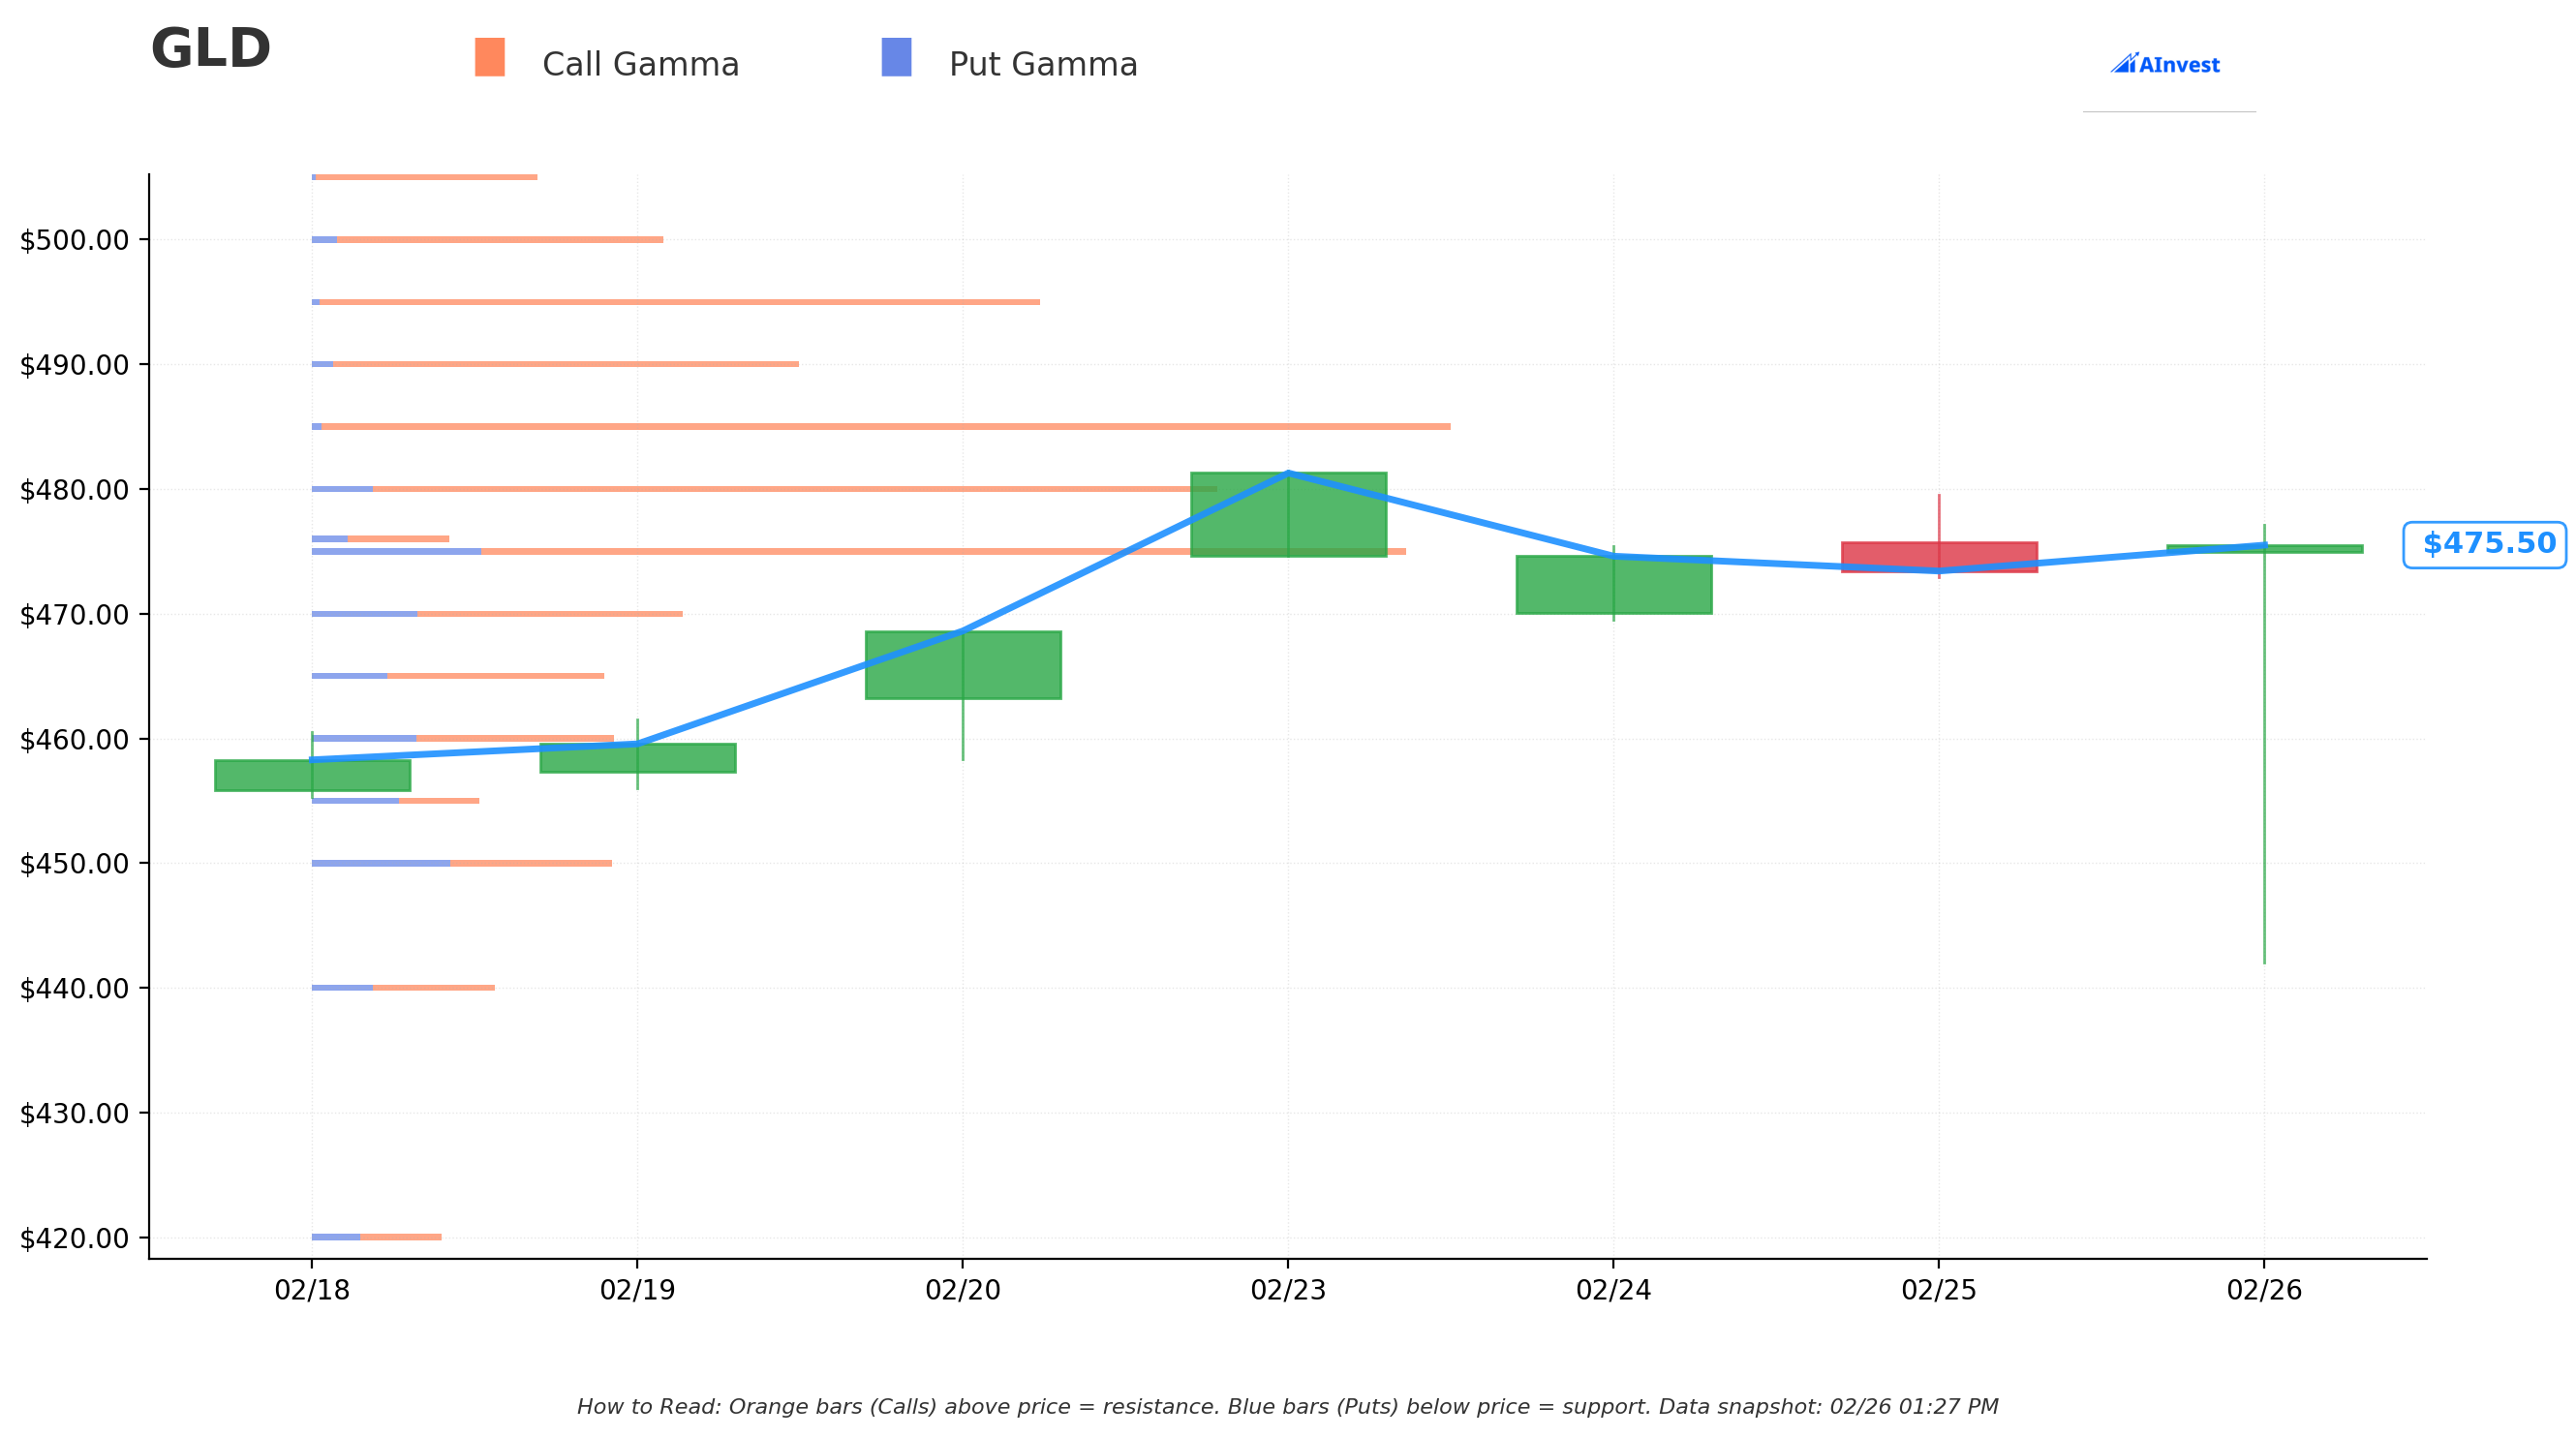
Current Price: $475.72
The gamma exposure map shows where options dealers are concentrated -- these strikes create natural magnets and barriers for price action.
🔵 Support Levels (Put Gamma Below Price):
- $475 -- MASSIVE immediate support with 167.8B total gamma (just 0.15% below current price -- the floor is RIGHT HERE)
- $470 -- Secondary support at 56.6B total gamma (1.2% below)
- $460 -- Structural floor at 45.9B total gamma (3.3% below)
- $450 -- Extended support at 45.8B total gamma (5.4% below -- near-equal to $460, creating a deep support shelf)
🟠 Resistance Levels (Call Gamma Above Price):
- $480 -- First resistance at 138B total gamma (0.9% above -- very close)
- $485 -- THE STRONGEST LEVEL on the entire board at 175B total gamma (1.95% above). This is the wall.
- $490 -- Additional resistance at 74.9B total gamma (3.0% above)
- $495 -- Major resistance at 111.9B total gamma (4.1% above) -- notably, this is EXACTLY where Block 2 was sold. The whale and the gamma agree: $495 is the ceiling.
- $500 -- Psychological round number at 53.8B total gamma (5.1% above)
- $510 -- Extended resistance at 79.4B total gamma (7.2% above)
What this means for traders:
GLD is sitting right on its strongest gamma support at $475 with a wall of call gamma overhead from $480 to $510. The $485 strike has the most concentrated resistance of any level -- it is going to be very hard for GLD to push through that zone without a major catalyst. The fact that the whale sold the $495 calls right at one of the densest gamma resistance levels tells you they've done their homework.
Net GEX Bias: Bullish (1,314B call gamma vs 318B put gamma) -- but the irony here is that all that call gamma ABOVE price creates a resistance ceiling. Market makers are short these calls and will sell GLD shares to hedge as price rises, creating natural overhead supply. This is why the whale is comfortable selling calls -- the gamma structure supports the view that upside is limited near-term.
Implied Move Analysis
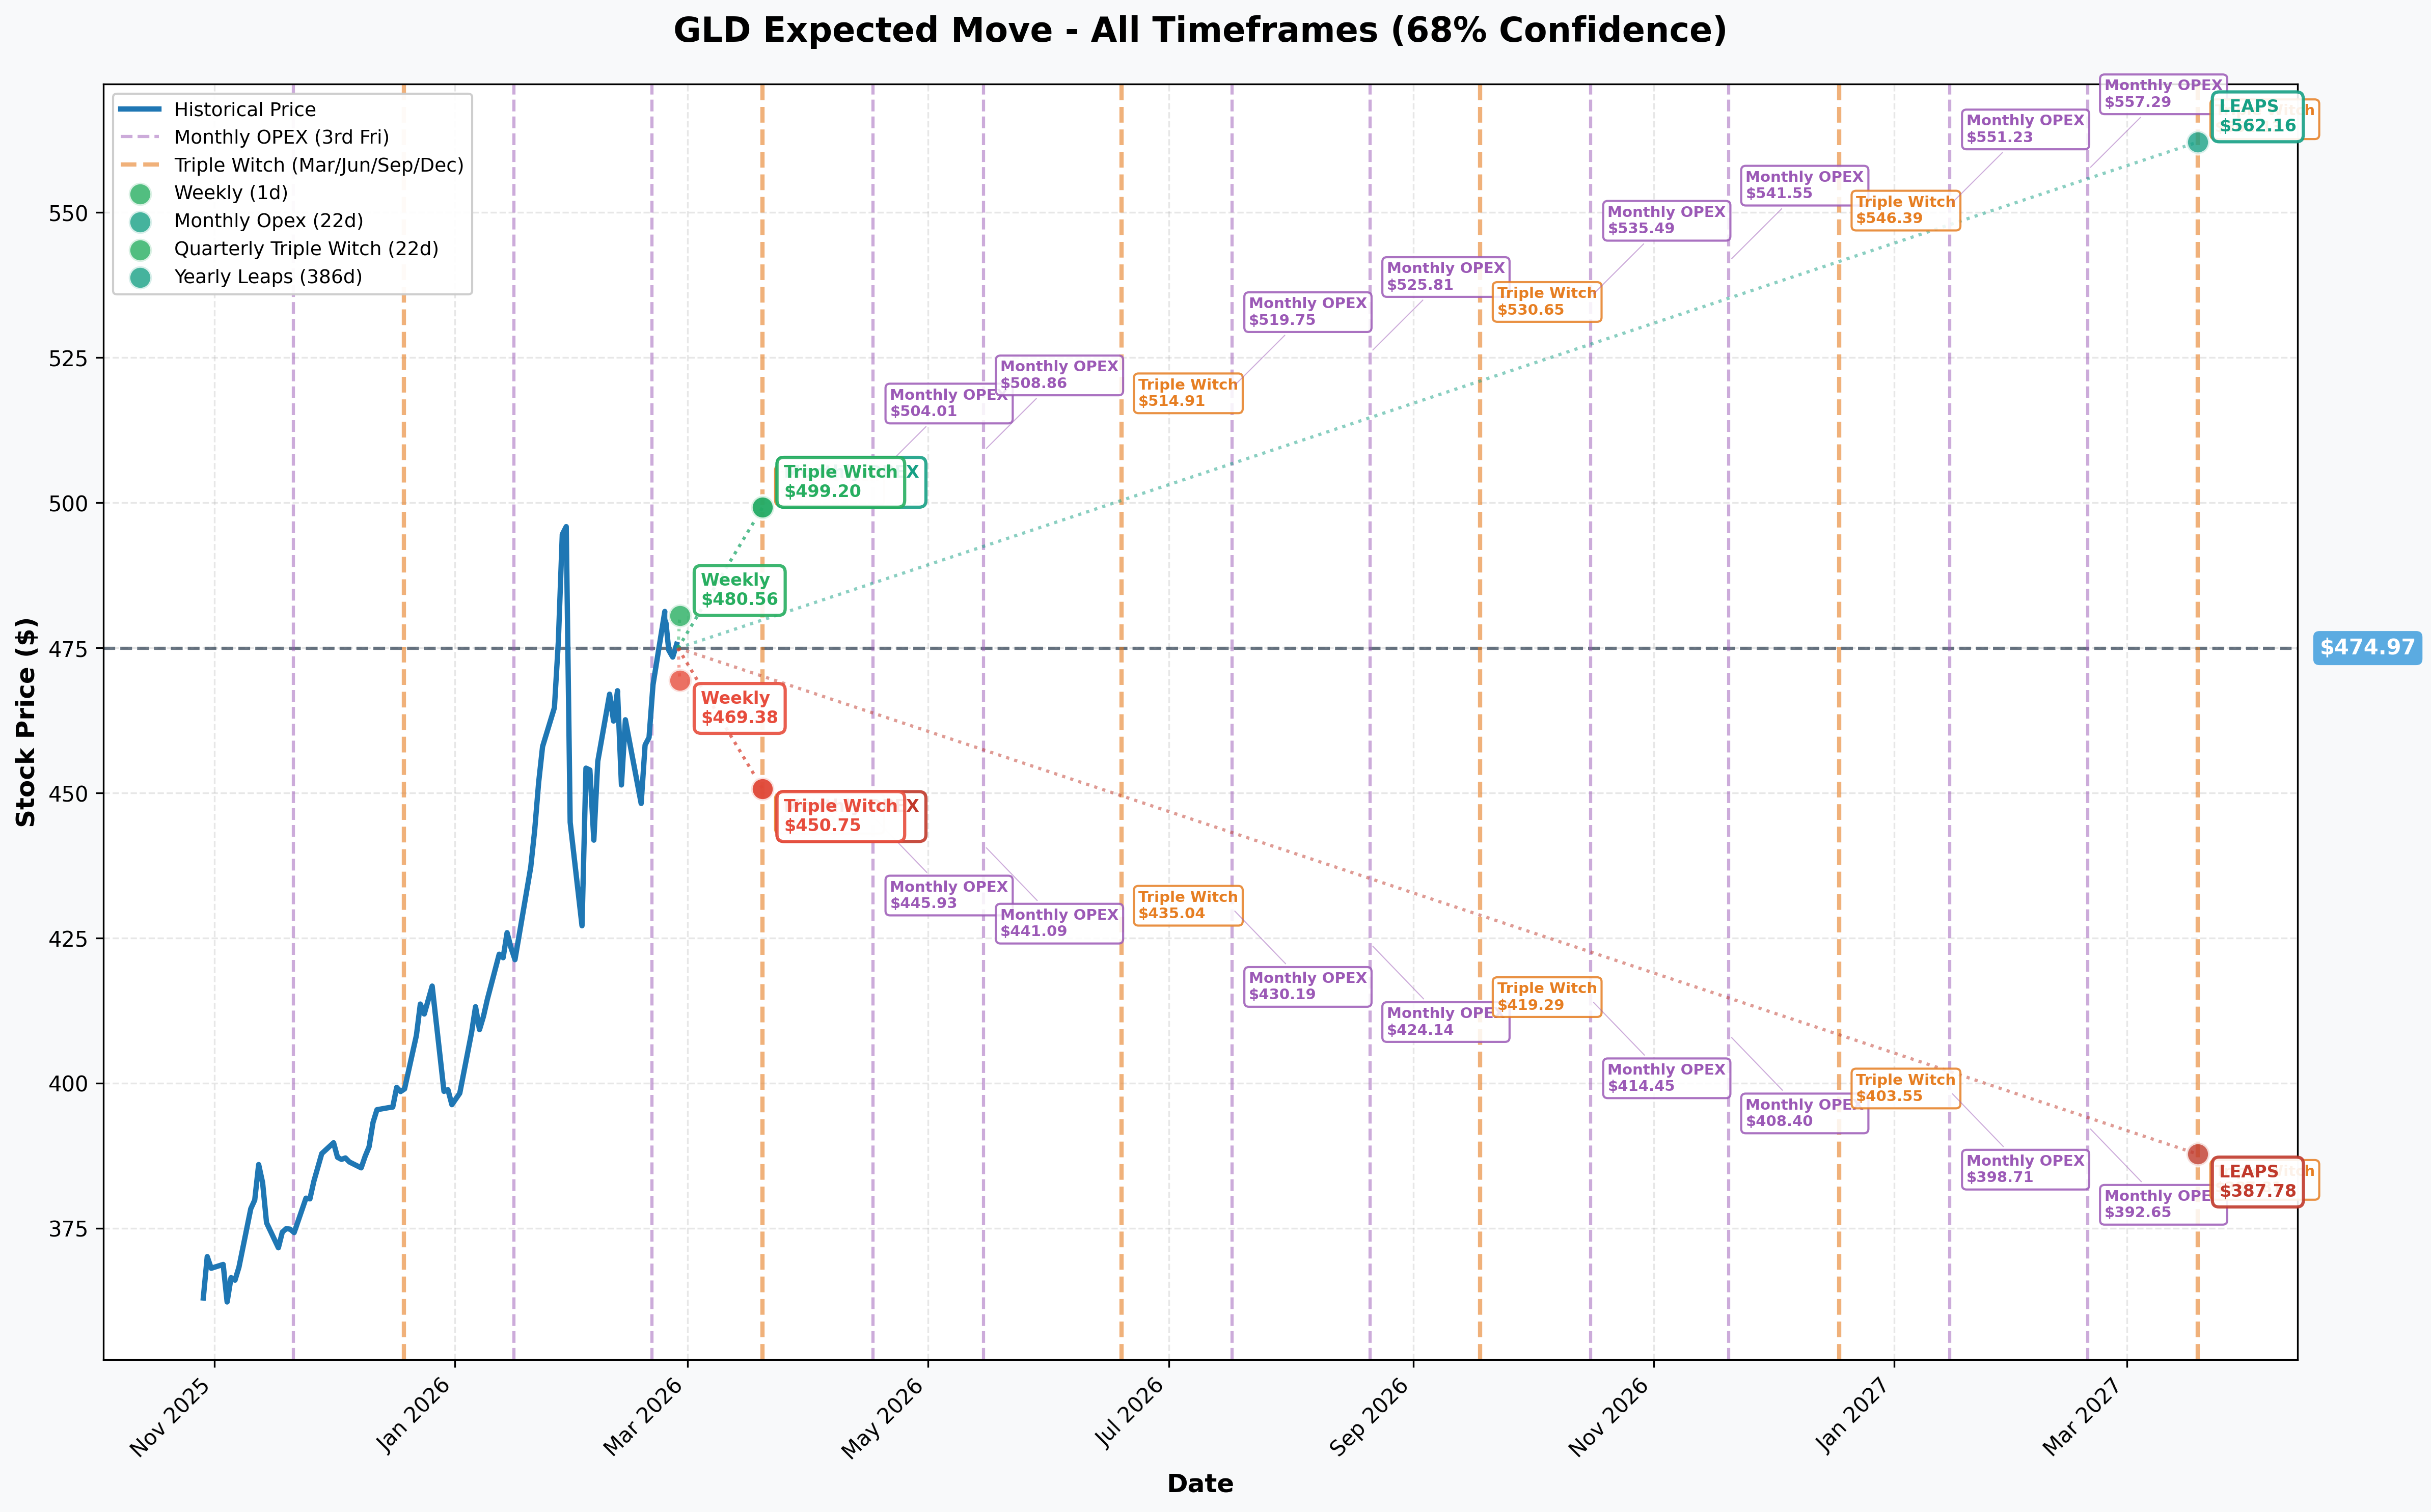
Options market pricing for upcoming expirations:
- 📅 Weekly (Feb 27 -- 1 day): ±$5.59 (±1.18%) --> Range: $469.38 - $480.56
- 📅 March OPEX / Triple Witch (Mar 20 -- 22 days): ±$24.22 (±5.1%) --> Range: $450.75 - $499.20
- 📅 May OPEX (May 15 -- 78 days): Range: $441.09 - $508.86
- 📅 LEAPs (Mar 2027): ±$87.19 (±18.4%) --> Range: $387.78 - $562.16
Translation -- How the trades line up with implied moves:
- 📊 Block 1 ($440 call, Mar 20): Strike is $10.75 BELOW the implied lower bound ($450.75). This deep ITM call will almost certainly be exercised -- the seller is committed to delivering shares.
- 📊 Block 2 ($495 call, Mar 20): Strike is $4.20 below the implied upper bound ($499.20). The market gives roughly a 30-35% chance of GLD reaching $495 by March 20. The seller is collecting $85M to bet against that.
- 📊 Block 3 ($570 call, May 15): Strike is $61 ABOVE the implied upper range ($508.86). The market prices maybe a 3-5% probability of GLD reaching $570 by May 15. The seller is collecting $21M for a bet that gold does NOT return to its January highs in the next 11 weeks.
The whale's view in a nutshell: GLD stays below $495 through March 20 (likely outcome) and below $570 through May 15 (very likely outcome), and they pocket $209M for that view while still holding their gold position.
🎪 Catalysts
🔥 Upcoming Catalysts
US-Iran Nuclear Talks -- Round 3 (February 26 - TODAY) 🌍
The third round of indirect nuclear talks is underway in Geneva RIGHT NOW. This is binary for gold:
- ✅ Failure or escalation = gold surges on safe-haven demand. The US has deployed F-22 fighter jets to Israel for the first time and has a military buildup in the Middle East at levels not seen since the 2003 Iraq invasion
- ❌ Breakthrough = gold drops as the geopolitical risk premium deflates
FOMC Meeting -- March 17-18, 2026 🏦
The Fed is expected to hold at 3.50-3.75%. The dot plot and tone matter more than the rate decision itself. A dovish surprise would be rocket fuel for gold; hawkish Warsh-era rhetoric would pressure it.
Trump Tariff Escalation Window -- Ongoing ⚖️
The 10% global tariff under Section 122 took effect February 24. Trump has threatened to raise it to 15%. Every escalation headline is a bid for gold as markets price in higher inflation and slower growth.
Kevin Warsh Senate Confirmation -- Coming Weeks 🏛️
Warsh's nomination as Fed Chair triggered the biggest gold crash in decades. His confirmation process and policy statements will shape gold's medium-term trajectory. Any hawkish commentary = headwind for gold.
Central Bank Buying -- Ongoing 🏦
755 tonnes of central bank purchases expected in 2026. The PBOC has added gold for 15 consecutive months as part of a broader de-dollarization strategy. This is the structural floor under gold.
World Gold Council Q1 2026 Demand Report -- Late April/Early May 📊
Will quantify whether January's record inflows and central bank buying are sustainable at current prices.
✅ Recent Catalysts (Already Happened)
Trump 10% Global Tariff Effective -- February 24, 2026 ⚖️
The 10% universal import tariff under Section 122 immediately boosted gold as markets priced in higher inflation. Gold hit a three-week high on February 23 in anticipation.
January 30 Flash Crash -- The "Warsh Effect" 💥
Trump's nomination of Kevin Warsh as Fed Chair triggered gold's worst day since the 1980s -- a 12%+ intraday plunge from ~$5,600 to below $5,000. Silver plunged 30% simultaneously -- its worst day since 1980.
January Parabolic Rally -- Gold Surges 27% 🚀
Gold surged 27% in January alone, hitting an all-time high of $5,594.82/oz on January 29. Fueled by Chinese speculative buying, safe-haven demand, and central bank accumulation.
Record Gold ETF Inflows -- January 2026 💰
$19B in global gold ETF inflows in January -- the strongest month ever recorded. AUM hit a record $669B. $1.3B flowed into GLD alone on February 25.
FOMC Hold at 3.50-3.75% -- January 28, 2026 🏦
The Fed held rates steady following three rate cuts in 2025, adopting a wait-and-see approach. The December dot plot projected only one 25bp cut for all of 2026.
🎲 Price Targets & Probabilities
Using gamma levels, implied move data, Wall Street gold forecasts, and the catalyst calendar, here are the scenarios through the key expirations:
📈 Bull Case (30% probability)
Target: $495-$510 by March 20 / $520-$540 by May 15
How we get there:
- 🌍 US-Iran talks collapse, military escalation accelerates -- gold spikes on safe-haven panic
- ⚖️ Trump raises tariffs to 15% and/or expands to sector-specific levies -- inflation expectations jump
- 🏦 March FOMC surprises dovish -- signals multiple 2026 rate cuts instead of one
- 📊 Central bank buying accelerates beyond 755t projection -- PBOC and Poland continue loading up
- 💰 Gold breaks above $5,400 (Goldman's year-end target) -- GLD pushes through $495 gamma resistance
- 🔥 Gold ETF inflows sustain the January-February pace -- another $10B+ in March
What happens to the trades:
- Block 2 ($495 calls) goes in the money -- seller loses upside above $495 but still profits from premium + underlying gains
- Block 3 ($570 calls) approaches risk zone if gold retests the ATH
- Seller still made the right bet on Block 1 (effective $478 sale price vs holding)
🎯 Base Case (50% probability)
Target: $465-$490 (Range-Bound Consolidation)
Most likely scenario:
- ✅ US-Iran talks produce incremental progress but no breakthrough -- status quo maintained
- 📊 FOMC holds in March, maintains cautious tone -- no surprises
- ⚖️ Tariffs stay at 10%, no escalation -- inflation fears moderate somewhat
- 🏦 Central bank buying continues at steady pace -- no acceleration or deceleration
- 📈 GLD oscillates between $475 support and $485-$490 resistance, with the gamma structure keeping it range-bound
- 📊 Implied move range of $450.75 - $499.20 holds for March OPEX
What happens to the trades:
- All three blocks expire with maximum profit for the seller
- Block 2 ($495) and Block 3 ($570) expire worthless -- seller pockets $106M in time value
- Block 1 ($440) gets exercised but seller nets ~$4.25/share in time value premium beyond intrinsic
- This is the outcome the whale is betting on -- and it is the most likely one
📉 Bear Case (20% probability)
Target: $440-$465
What could go wrong for gold:
- 🕊️ US-Iran breakthrough -- diplomatic resolution removes major safe-haven bid
- 🏦 Warsh signals hawkish Fed pivot during confirmation -- dollar rallies, gold drops
- ⚖️ Tariffs rolled back or reduced -- inflation premium deflates
- 📉 Central bank buying slows faster than the projected decline to 755t -- price elasticity kicks in at these levels
- 💥 Replay of the January 30 crash dynamics -- Chinese speculative unwind triggers cascading selling
- 📊 GLD breaks below $475 gamma support, targeting $460 and possibly $450
What happens to the trades:
- Even better for the whale -- all calls expire worthless AND the premium cushions the decline in their underlying position
- The $209M in premium collected provides a ~$8.82/share buffer against any downside move (spread across 23.7M shares)
💡 Trading Ideas
🛡️ Conservative: "The Premium Harvester" -- Selling What the Whale is Selling
Play: Sell GLD March 20 $490 covered calls against existing GLD shares
Why this works:
- 📊 $490 is 3% above current price and sits at a strong gamma resistance level (74.9B total gamma)
- 💰 Collect approximately $6-8 per contract in premium (~1.3-1.7% return in 22 days)
- 🛡️ You're doing exactly what the whale is doing -- monetizing elevated IV while staying long gold
- 📊 The gamma structure shows $485-$495 as a dense resistance zone -- GLD would need a major catalyst to blast through
- 🎯 If GLD stays below $490 by March 20, you keep the premium AND your shares
- ⏰ 22 days of time decay working in your favor
Position sizing: For every 100 GLD shares you own (~$47,500 at current prices), sell 1 contract. Collect ~$600-800 per contract. Max loss: opportunity cost if GLD rips above $490.
Risk level: LOW (you already own the shares) | Skill level: Beginner-Intermediate
⚖️ Balanced: "The Gold Range Trader" -- Iron Condor
Play: Sell GLD March 20 $460/$465 put spread and sell GLD March 20 $495/$500 call spread
Why this works:
- 🦋 $460 and $495 are both key gamma levels -- support below and resistance above
- 💰 Collect premium on both sides by betting GLD stays in the $460-$495 range through March 20
- 📊 The implied move range ($450.75-$499.20) and the gamma structure both support this range
- 🛡️ Defined risk: max loss is the $5 spread width minus premium collected per side
- 📊 The whale's $209M bet is essentially the same thesis -- GLD stays range-bound
- 🎯 Net credit of approximately $1.50-$2.50 per iron condor, risking $2.50-$3.50 per side
Position sizing: 10-25 iron condors = $1,500-$6,250 in premium collected, risking $2,500-$8,750 max per side. Keep position size to 2-3% of portfolio.
Risk level: MODERATE (defined risk, but can lose on either side) | Skill level: Intermediate
🚀 Aggressive: "The Gold Bull Breakout" -- Call Debit Spread
Play: Buy GLD May 15 $480 calls, sell GLD May 15 $510 calls
Why this works (and why it is risky):
- 🚀 If you disagree with the whale and think gold has more room to run, this plays the breakout
- 💰 Goldman Sachs targets $5,400/oz, JP Morgan targets $6,300, UBS targets $6,200 -- all above current levels
- 📊 May 15 expiration gives 78 days for the tariff story, Iran crisis, and FOMC to play out
- 🎯 Max profit if GLD reaches $510+ (~$34.28 above current price, or ~7.2% move)
- 🛡️ Defined risk: you only lose the net debit paid (approximately $10-12 per spread, or $1,000-$1,200)
- 📊 The implied move upper range for May is $508.86 -- the $510 target is right at the edge of expectations
Why it could blow up:
- 💸 The whale -- someone with $11.3B in gold exposure and arguably better information than you -- is selling calls at these levels
- 📉 A Warsh-induced dollar rally or Iran peace deal could crush gold quickly
- ⏰ $485 gamma resistance is going to make every dollar of upside a grind
Position sizing: 5-10 spreads at ~$11 each = $5,500-$11,000 at risk for up to $15,000-$19,000 max profit. Risk no more than 2-3% of your portfolio.
Risk level: HIGH (fighting the whale) | Skill level: Advanced
⚠️ Risk Factors
Don't ignore these:
-
💥 The January 30 flash crash proved gold can lose 12%+ in hours. After gold's worst single-day crash since the 1980s, triggered by a single personnel announcement, you cannot assume gold only goes up. Chinese speculative accounts were identified as a major driver of both the rally AND the crash. Overcrowded positioning is real.
-
🏛️ Kevin Warsh is a genuine headwind for gold. The incoming Fed Chair is expected to be more hawkish than Powell. Higher real yields and a stronger dollar are kryptonite for gold. His confirmation process and policy statements could trigger another selloff.
-
🕊️ A diplomatic breakthrough with Iran removes a major safe-haven bid. The Geneva talks happening TODAY are a binary event. If tensions de-escalate, gold loses one of its key support pillars.
-
📉 Gold is stretched. Up +64% in 2025 and +16% YTD, gold has already exceeded many analysts' year-end 2026 targets by February. The World Gold Council's own outlook warns of a 5-20% correction risk under a bullish economic scenario. Even Commerzbank targets just $4,400/oz -- well below current levels.
-
📊 $209M in institutional call selling is a signal worth respecting. When someone managing $11.3B in gold decides to cap their upside at 4%, they are telling you something about near-term expectations. Retail traders should think twice before being more bullish than the biggest players in the room.
-
⚖️ Tariff rollback or de-escalation would remove the inflation bid. The current 10% tariff is scheduled to expire after 150 days. If it is not renewed or is reduced, the inflation premium embedded in gold deflates.
-
🏦 Central bank buying is expected to slow. The projected 755 tonnes in 2026 is still elevated, but down from 1,000+ tonnes in each of the prior three years. Price elasticity at $5,000+/oz may moderate official purchases further.
🎯 The Bottom Line
Real talk: This is the trade of the day -- $209 million in premium collected by a single entity in 13 minutes. Someone with roughly $11.3 billion in gold exposure just told the entire market: "I love gold, I'm keeping my gold, but I'm taking $209M in cash off the table and I don't think gold is running away to the upside anytime soon."
What this trade tells us:
- 🎯 A massive gold holder views $495 as the near-term ceiling (22 days) and $570 as extremely unlikely within 78 days
- 💰 They are monetizing elevated implied volatility -- gold IV at the 66th percentile makes call selling juicy
- 🏦 This is not a bearish call -- covered call writing is a bullish-neutral strategy. They are keeping their gold. They are just harvesting income.
- 📊 The tiered structure ($440 / $495 / $570) shows decreasing conviction about upside at each level -- very willing to cap at $495, moderately willing at $570
- ⚠️ The sheer size -- 237K contracts, $11.3B notional -- means this is sovereign-wealth-fund or mega-fund level positioning
If you own GLD or gold:
- ✅ Consider selling covered calls at $490-$495 (March) to generate income like the whale
- 📊 Watch $475 as the critical gamma support floor -- a close below $475 opens the door to $460
- 🎯 The $485 gamma wall is your near-term target -- if GLD can push through that, $495 is the next test
- 💰 Gold's structural story (tariffs, Iran, central banks, de-dollarization) remains intact -- this is a monetization trade, not an exit signal
If you are watching gold from the sidelines:
- 👀 The wall of institutional selling at $495 creates a potential entry opportunity if GLD pulls back to $460-$470
- 📊 Goldman's $5,400 target (
$497 GLD) and JP Morgan's $6,300 target ($580 GLD) suggest meaningful upside on a 6-12 month horizon - 🎯 Best entry: on a pullback to $460-$465 gamma support, or on a confirmed breakout above $495
If you are bearish on gold:
- 📊 The whale's position actually supports your view that upside is limited near-term
- ⚖️ Watch for the Warsh confirmation process and any diplomatic progress on Iran as catalysts for a pullback
- 🛡️ Bear put spreads at the $470/$455 level offer good risk/reward if you think the recovery stalls
Key dates to mark:
- 📅 February 26 (TODAY) -- US-Iran Round 3 nuclear talks in Geneva -- binary event for gold
- 📅 March 17-18 -- FOMC meeting -- rate decision and dot plot
- 📅 March 20 -- Block 1 & 2 expire -- Triple Witch / Monthly OPEX (implied range: $450.75 - $499.20)
- 📅 May 15 -- Block 3 expires -- Monthly OPEX (implied range: $441.09 - $508.86)
- 📅 ~Late July -- Section 122 tariff 150-day expiration -- renewal decision could swing gold
Final thought: When the biggest player in the gold market collects $209M in a single morning by selling calls, they are not panicking. They are farming. They see gold staying in a range, they see elevated volatility as an income opportunity, and they are perfectly happy to let someone else chase the all-time high. For the rest of us, the message is clear: gold's structural bull case is alive and well, but the next leg higher might take longer than the hype suggests. The whale is patient. Be patient too.
$209M in one morning. That's not a trade -- that's a business. 💪
Disclaimer: Options trading involves substantial risk of loss and is not suitable for all investors. This analysis is for educational purposes only and not financial advice. Past performance does not guarantee future results. The trades described involve institutional-scale positions (237,000+ contracts representing $11.3B in notional exposure) that are not replicable by retail traders. Gold and gold ETFs can experience extreme volatility -- the January 30, 2026 flash crash demonstrated that gold can lose 12%+ in a single session. Covered call strategies limit upside potential while providing only limited downside protection through the premium collected. Always do your own research and consider consulting a licensed financial advisor before trading.
About SPDR Gold Shares (GLD): The world's largest physically-backed gold ETF with $180B in AUM, holding 1,094 tonnes of physical gold in London vaults. Managed by State Street Global Advisors. GLD is the benchmark vehicle for institutional gold exposure and the most liquid gold options market in the world.