🥇 GLD $62M Bear Call Spread - Massive Short-Dated Bet Gold Stalls at $485!
📅 March 2, 2026 | 🔥 Unusual Activity Detected
🎯 The Quick Take
Someone just put on a $62M bear call spread on GLD using 44,586 contracts -- selling the $485 calls and buying the $495 calls expiring in just 4 days (March 6). The net credit is roughly $18M, meaning this trader is betting that gold stays at or below $485.54 by Friday. With the US-Israel-Iran conflict driving gold up 6% in three days and GLD up 84% over the past year, this is either a big hedge on an existing long gold position or someone calling the top of this geopolitical fear spike.
📊 ETF Overview
SPDR Gold Shares (GLD) is the world's largest physically-backed gold ETF, tracking the price of gold bullion:
- 🏦 AUM: ~$182.9B (Morningstar)
- 💰 Gold Holdings: 1,101 tonnes (as of February 27, 2026) (MacroMicro)
- 💸 Expense Ratio: 0.40% (ETFdb)
- 📈 Current Price: $485.54 (spot at time of trade); $490.73 (close)
- 📊 52-Week Range: $265.07 - $509.70 (Yahoo Finance)
- 🥇 Gold Spot: ~$5,355/oz (Fortune)
- 📈 1-Year Return: +84% (Investing.com)
GLD is the go-to vehicle for institutions looking to trade gold exposure. Its deep options market and massive AUM make it the preferred choice for hedging and large block trades -- exactly the kind of activity we're seeing today.
💰 The Option Flow Breakdown
📊 The Tape (March 2, 2026 @ 11:08:46)
| Time | Symbol | Side | Buy/Sell | Type | Expiration | Premium | Strike | Volume | OI | Size | Spot | Option Price |
|---|---|---|---|---|---|---|---|---|---|---|---|---|
| 11:08:46 | GLD | MID | BUY | CALL | 2026-03-06 | $22M | $495 | 113K | 113K | 44,586 | $485.54 | $4.96 |
| 11:08:46 | GLD | MID | SELL | CALL | 2026-03-06 | $40M | $485 | 56K | 156K | 44,586 | $485.54 | $8.98 |
🤓 What This Actually Means
This is a two-legged trade executed simultaneously -- a bear call spread (call credit spread). Here is what went down:
- 💸 Sold $485 calls at $8.98 each (collecting $40M) -- these are slightly in-the-money with GLD at $485.54
- 🛡️ Bought $495 calls at $4.96 each (paying $22M) -- these are $10 out-of-the-money, acting as protection
- 💰 Net credit collected: $4.02 per contract x 44,586 contracts = ~$17.9M
- ⏰ Expiration: March 6, 2026 -- just 4 trading days away
- 📏 Spread width: $10 (max risk = $10 - $4.02 credit = $5.98 per contract)
- 📊 Max risk: ~$26.7M if GLD closes above $495 at expiration
- 🐋 Contract size: 44,586 contracts = exposure on 4,458,600 shares (~$2.2B notional)
Translation for regular folks:
This trader is collecting $18M upfront and betting that GLD stays at or below $485 by Friday. If gold cooperates and GLD closes below $485, they keep the full $18M. If GLD rips above $495, they lose a maximum of ~$27M (net ~$9M loss after credit). It is a defined-risk, short-term income play -- but on a massive scale.
Why $485 and $495? The $485 strike is right at the money (GLD was $485.54 when the trade hit). By selling the at-the-money call and buying $10 higher for protection, the trader maximizes credit while capping risk. With only 4 days until expiration, time decay (theta) works heavily in their favor.
Unusual Score: 🔥 The $495 call leg registered a Z-score of 4.95 (EXTREMELY UNUSUAL) -- volume hitting 113K against 113K open interest means the entire open interest turned over in a single session. The $485 call leg had a Z-score of 2.06 (HIGHLY UNUSUAL). A combined $62M in notional premium across both legs on a single ETF in a single timestamp is something you see only a handful of times per year.
📈 Technical Setup / Chart Check-Up
1-Year Performance Chart
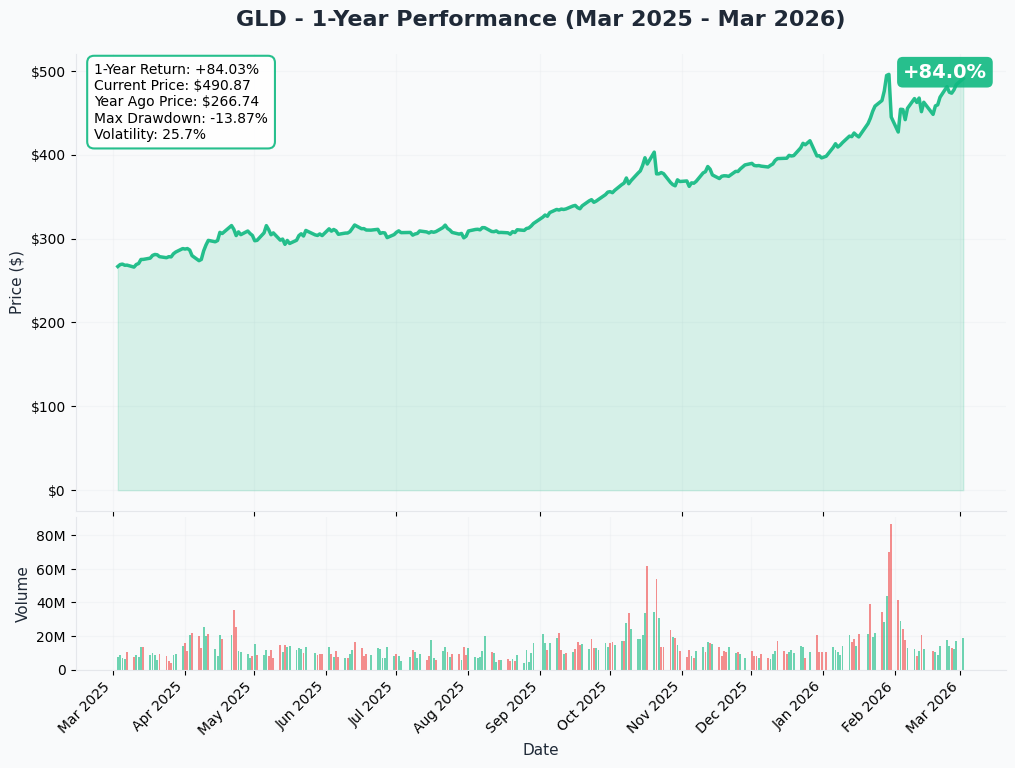
GLD is up a remarkable +84% over the past year, climbing from ~$267 in March 2025 to $490.87 today. This is one of the strongest 12-month runs in gold ETF history, driven by a perfect storm of geopolitical fear, central bank buying, and dollar weakness.
Key observations:
- 📈 Parabolic move since January 2026: GLD went from ~$420 to nearly $510 in under two months
- 🎢 Volatility: 25.7% annualized -- elevated for a gold ETF, reflecting the geopolitical risk premium
- 📉 Max drawdown: Only -13.87% over the trailing year -- gold has been a remarkably smooth ride up
- 📊 Volume spike: Massive volume bars in late February coincide with the Iran conflict escalation
Gamma-Based Support & Resistance Analysis
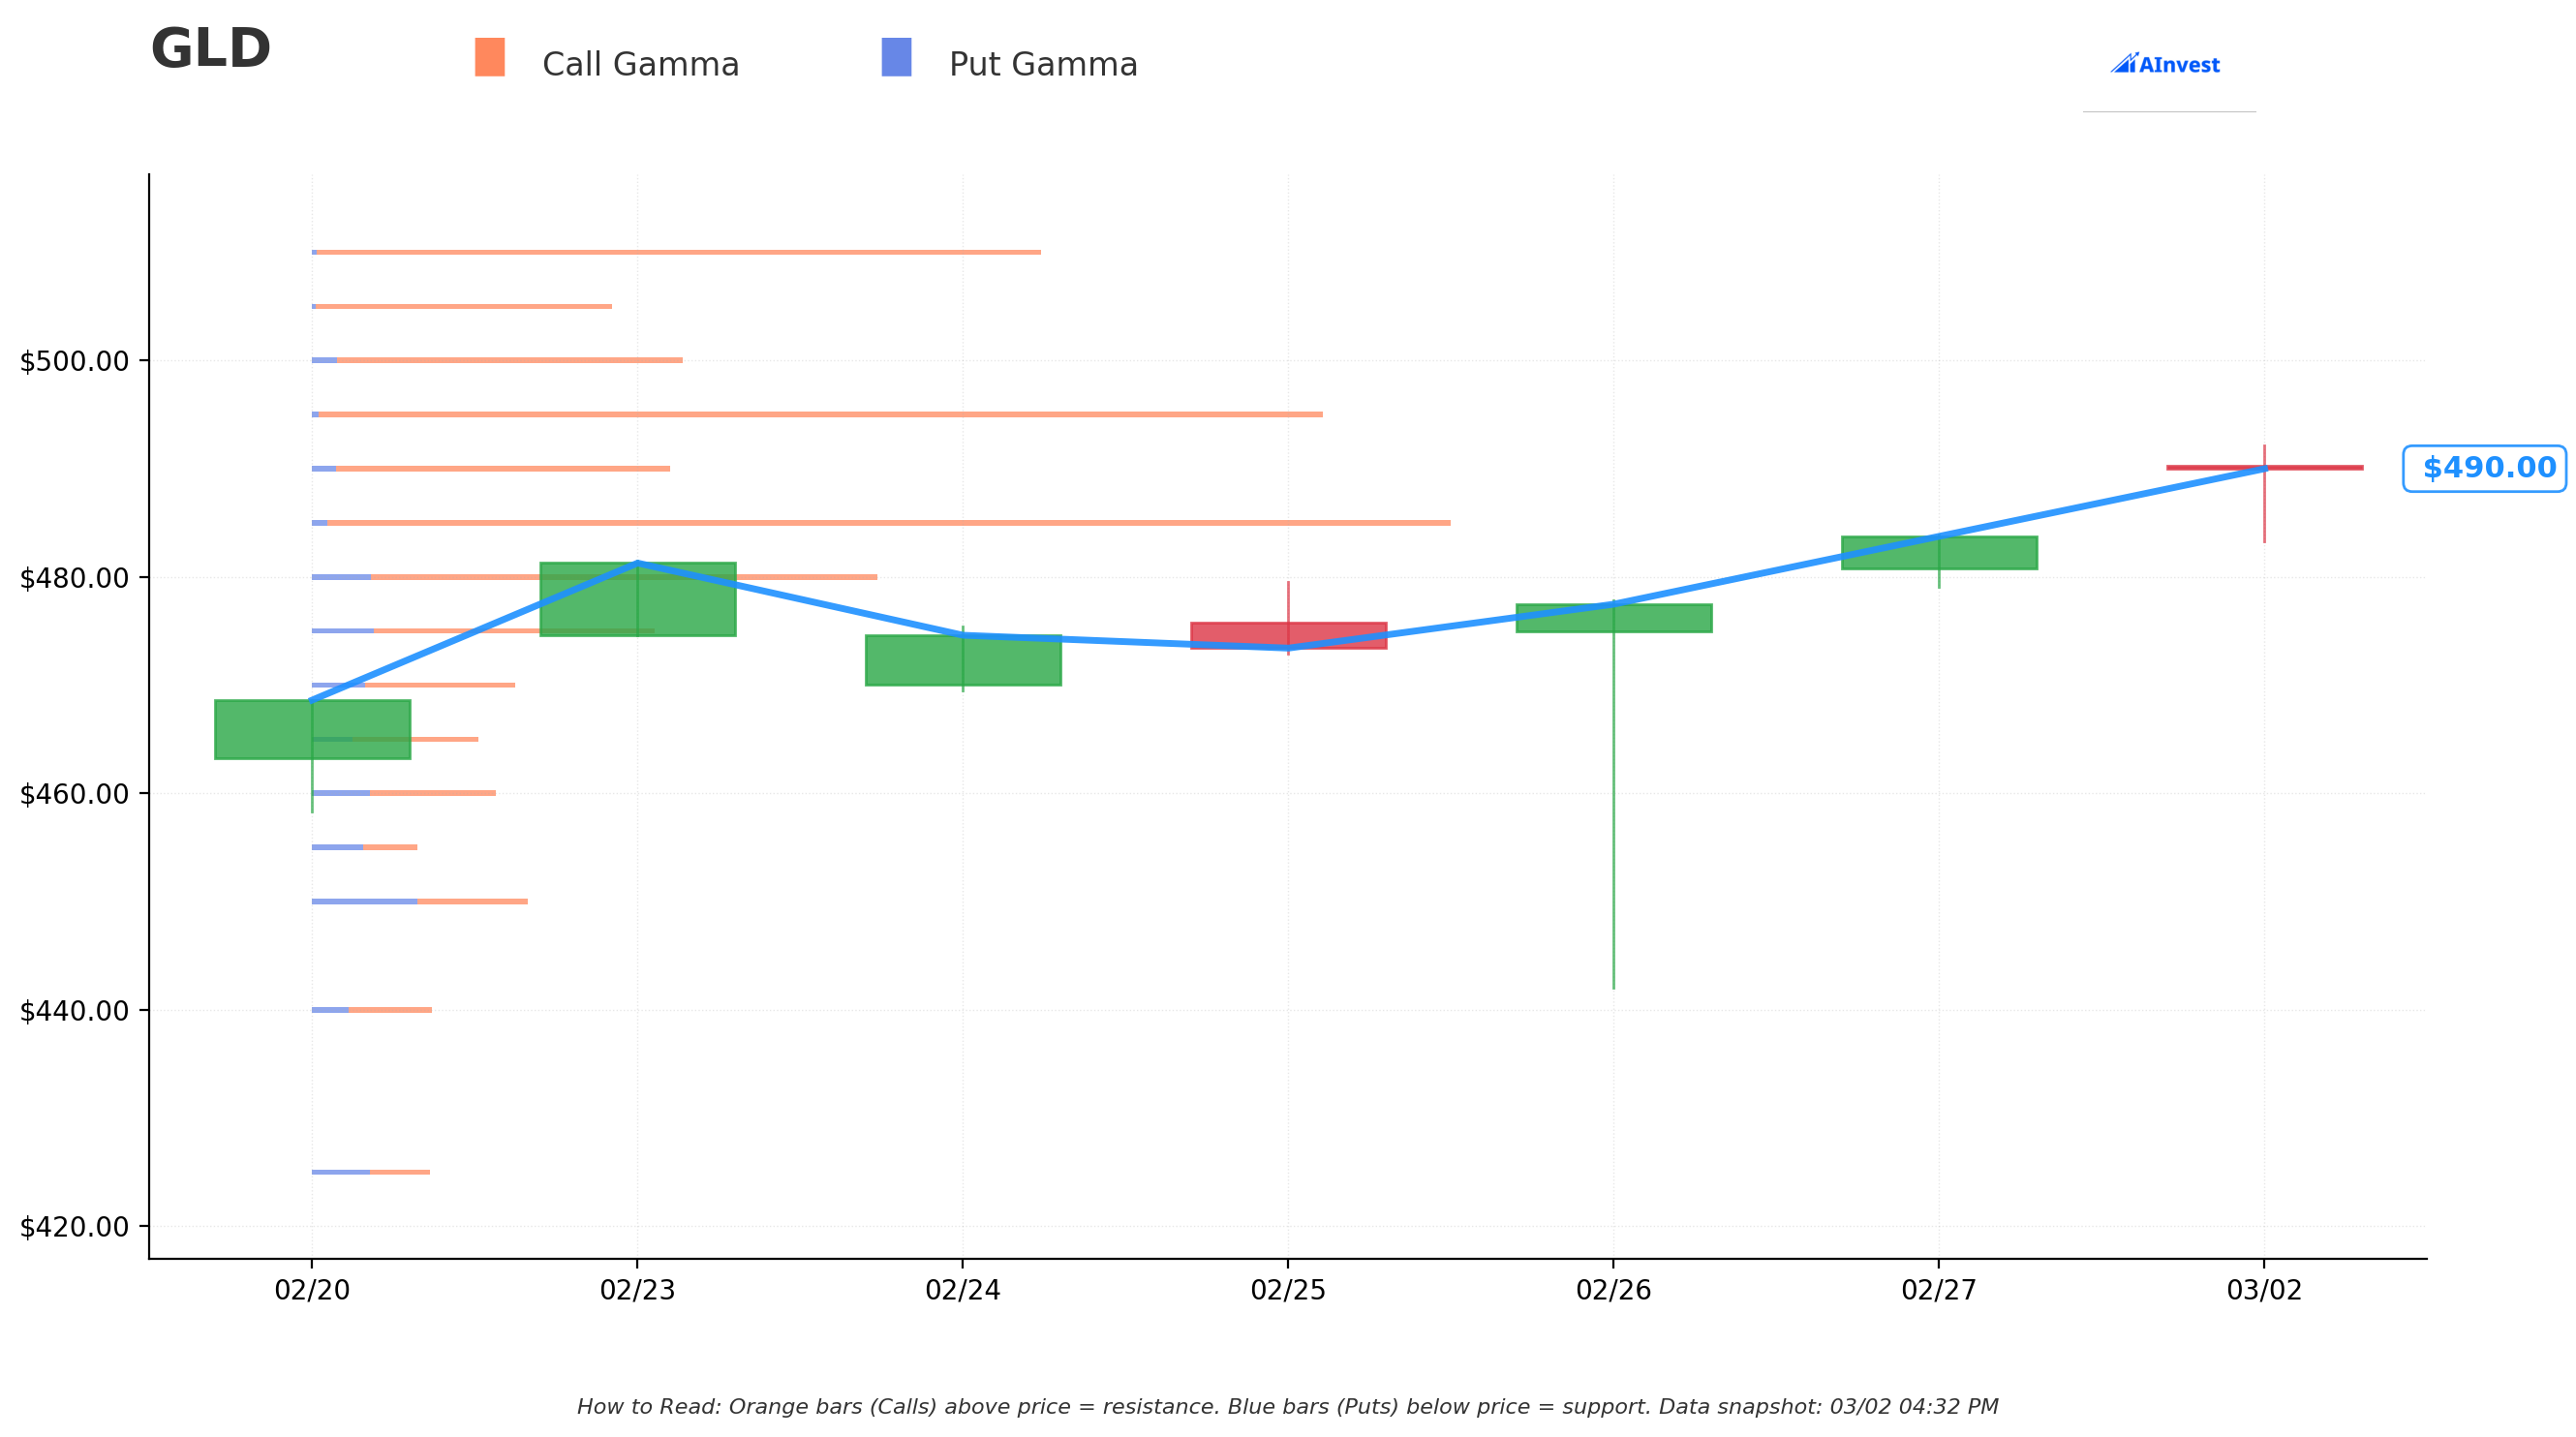
Current Price: $490.00
The gamma exposure chart shows where options market makers have concentrated positioning, which creates natural magnets and barriers for price:
🟠 Resistance Levels (Call Gamma Above Price):
- $495-$500 -- Heavy call gamma cluster visible as orange bars. This is the first major ceiling above current price and aligns perfectly with the $495 strike of our spread
- $505-$510 -- Extended resistance band near recent highs ($509.70 was the 52-week high)
- $485 -- Notable call gamma right at the money, which is where the spread's short strike sits
🔵 Support Levels (Put Gamma Below Price):
- $475-$480 -- Strongest put gamma concentration; dealers will buy dips here, creating a floor
- $465-$470 -- Secondary support layer visible in recent trading
- $455-$460 -- Deep support from earlier February positioning
What this means for traders: The gamma landscape suggests GLD is running into stiff resistance right in the $490-$500 zone. The bear call spread seller is positioned right at this resistance band -- they are betting that call gamma overhead will cap the rally. Meanwhile, put gamma below provides a cushion around $475-$480 if things reverse. This is a tactical play exploiting the gamma wall above.
Implied Move Analysis
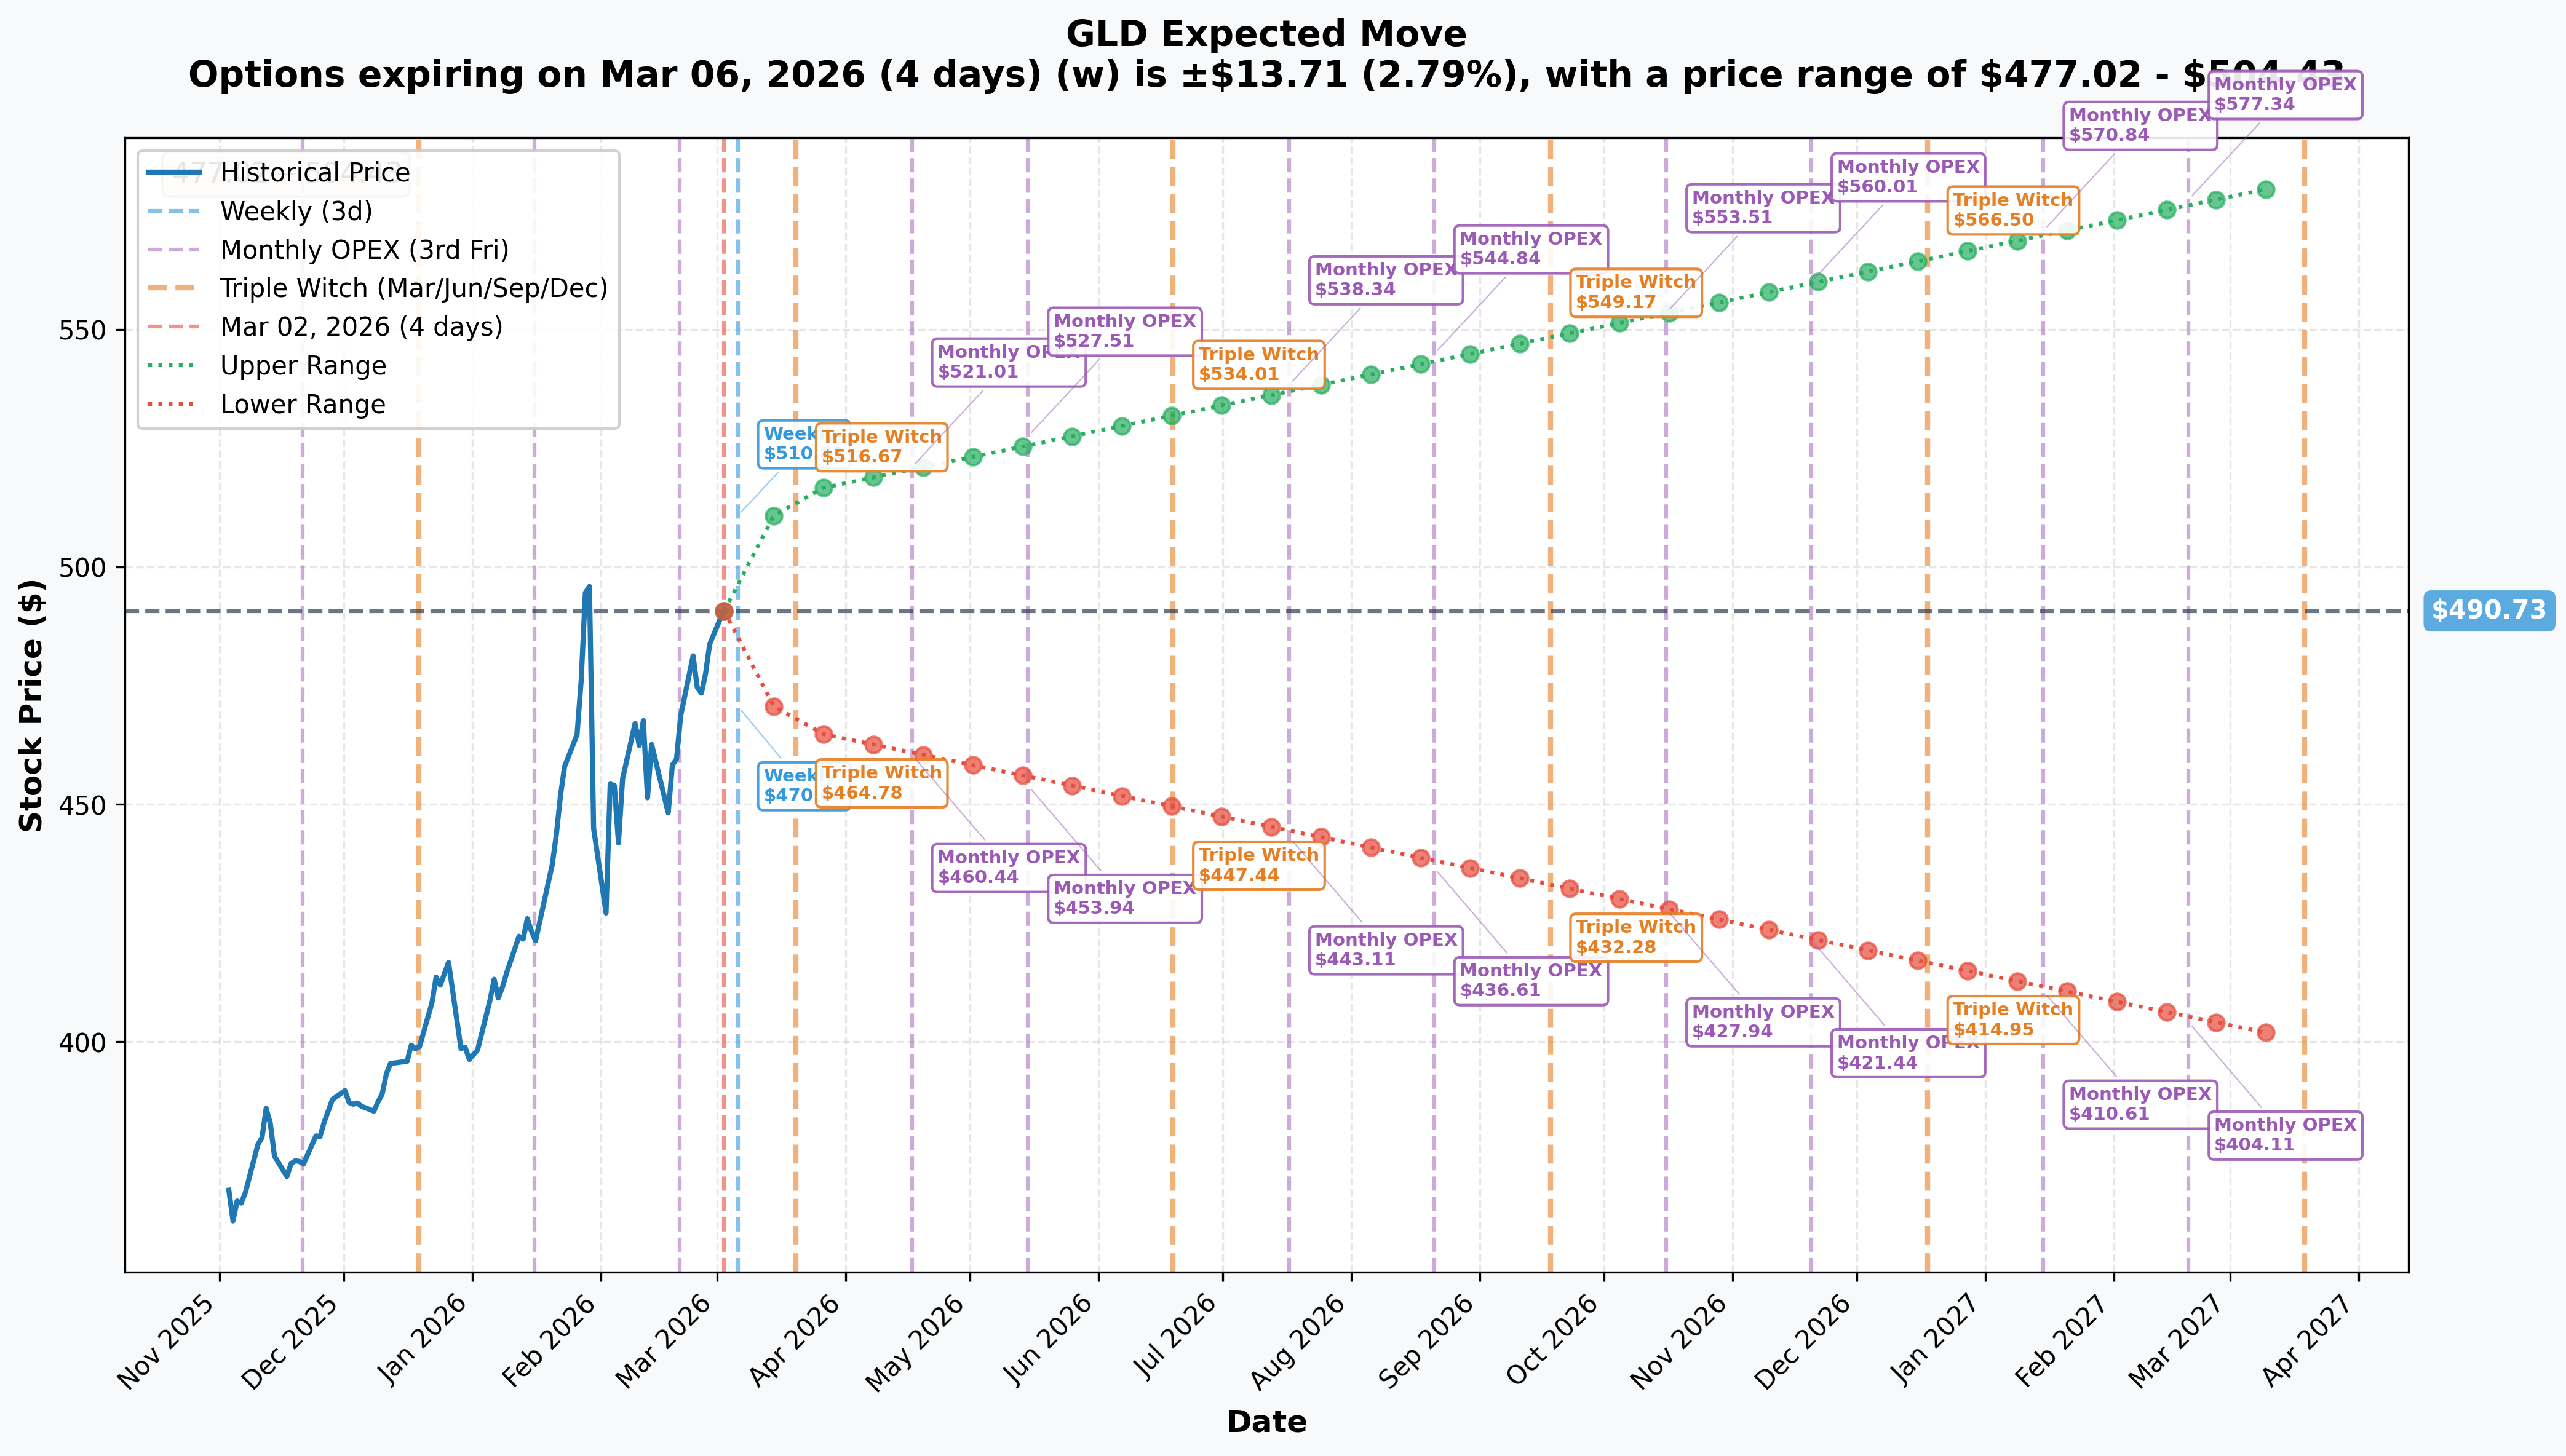
Options market pricing for upcoming expirations:
- 📅 Weekly (Mar 6 -- 4 days): +/-$13.71 (+/-2.79%) --> Range: $477.02 - $504.43
- 📅 Monthly/Triple Witch (Mar 20 -- 18 days): +/-$24.86 (+/-5.07%) --> Range: $465.86 - $515.59
- 📅 LEAPS (Mar 2027 -- 382 days): +/-$90.59 (+/-18.46%) --> Range: $400.14 - $581.31
Translation for regular folks:
The options market is pricing in a roughly $14 move (about 2.8%) by Friday. That means GLD could reasonably trade anywhere from $477 to $504 by the March 6 expiration. The bear call spread's short strike at $485 sits below the current price of $490.73, meaning the trader needs gold to pull back or at least not run further. The protective $495 strike is well within the implied range -- so the market considers a move to $495+ plausible but not the base case.
Importantly, the $485-$495 spread sits right in the middle of the weekly expected move. This is not an extreme bet -- it is a calculated play that gold's recent surge stalls out within the next four days.
🎪 Catalysts
🔥 What Just Happened (Past 7 Days)
US-Israel-Iran Conflict -- "Epic Fury" / "Roaring Lion" (February 28 -- Ongoing) 💣
This is THE catalyst driving gold right now. On February 28, the United States and Israel launched coordinated strikes on Iran, including the assassination of Supreme Leader Ali Khamenei. The immediate fallout:
- 🥇 Gold surged ~6% in three days from ~$5,100 to ~$5,400
- 🛢️ Oil prices spiked 13% to ~$82/bbl Brent as Iran's IRGC threatened to close the Strait of Hormuz
- 🚢 First oil tanker attacked in the Strait of Hormuz on March 1; tanker traffic dropped ~70%
- 🌐 The Strait handles 33% of global seaborne oil and 20% of LNG exports -- a prolonged blockade would be an economic shock
Record Gold ETF Inflows 📈
- 💰 Global gold ETFs recorded $9.4B in inflows in February 2026 -- the strongest since March 2022
- 🇺🇸 North American flows flipped positive, recording one of the strongest months on record
- 🏦 GLD crossed $180B AUM in February
Tariff Escalation 📊
- ⚖️ On February 20, the Supreme Court ruled the President cannot use IEEPA to impose tariffs
- 📋 Trump responded on February 27 with an executive order increasing global tariffs from 10% to 15% for 150 days
- 🗓️ March 4: Tariffs on Canada took effect; tariffs on China increased by additional 10%
📅 Upcoming Catalysts (Next 30 Days)
These are the dates that could make or break this trade:
March 4 -- Canada/China Tariff Escalation Takes Effect 📊 New tariffs increase trade uncertainty and inflationary pressure -- generally bullish for gold.
March 6 -- February Nonfarm Payrolls (8:30 AM ET) 📈 This is also the expiration date of our bear call spread. Weak jobs = Fed cut speculation = bullish gold. Strong jobs = bearish gold. BLS release schedule
March 11 -- February CPI Release (8:30 AM ET) 🔥 Hot inflation data supports gold as an inflation hedge but also makes the Fed less likely to cut. Cold data eases safe-haven demand. January 2026 CPI came in at +2.4% YoY.
March 17-18 -- FOMC Meeting (Decision March 18) 🏦 Market expects the Fed to hold at 3.50-3.75%. A dovish surprise or hints at rate cuts would be bullish gold. A hawkish surprise could trigger a pullback. Markets still price one cut in 2026.
Ongoing -- Iran/Strait of Hormuz Situation 💣 This is the biggest wildcard. Escalation = sharply bullish gold. Ceasefire or de-escalation = potential 5-10% pullback as geopolitical risk premium unwinds.
🏦 Structural Tailwinds (Longer-Term)
- 🌍 Central banks purchased 863 tonnes of gold in 2025 and Goldman forecasts ~60 tonnes/month in 2026
- 💵 DXY expected to soften to mid-90s by year-end -- weaker dollar supports gold
- 🏛️ Central banks are swapping gold into core holdings instead of dollars, reflecting structural de-dollarization
🎲 Price Targets & Probabilities
Using gamma levels, implied move data, and the current catalyst environment:
📈 Bull Case (35% probability)
Target: $500-$515 by March 20 OPEX
How we get there:
- 💣 Iran conflict escalates further -- Strait of Hormuz effectively closed, oil spikes above $90/bbl
- 🥇 Gold pushes through $5,500/oz toward the January all-time high of $5,589
- 📈 GLD breaks above the $495-$500 gamma resistance on sustained institutional buying
- 🏦 Wall Street targets range from $5,400-$6,300/oz by year-end -- plenty of room above
- 📊 Implied move suggests $504-$516 is achievable by March 20
Key risk to this scenario: GLD is already up 84% in a year. Parabolic moves eventually correct. The weekly implied move caps at ~$504, and gamma resistance at $495-$510 will slow any rally.
Bear call spread outcome: The spread loses money. Maximum loss of ~$27M if GLD closes above $495 (net loss of ~$9M after credit).
🎯 Base Case (45% probability)
Target: $477-$495 range through March 6
Most likely scenario:
- 🔄 Gold consolidates after a 6% spike in 3 days -- markets digest the Iran shock
- ⏰ Short-term overbought conditions trigger profit-taking by momentum traders
- 📊 GLD trades within the weekly implied move range of $477-$504
- 🏦 No major escalation or de-escalation in Iran -- stalemate
- 💤 March 6 payrolls come in roughly as expected, no major surprise
This is the spread seller's sweet spot: If GLD drifts back below $485 or even stays in the $480-$490 range, the bear call spread either breaks even or produces partial profit. The $18M credit provides a significant buffer -- the trader does not lose money unless GLD is above $489.02 at expiration ($485 strike + $4.02 credit).
📉 Bear Case (20% probability)
Target: $465-$477
What could drive a pullback:
- 🕊️ Ceasefire announcement or diplomatic breakthrough on Iran -- geopolitical risk premium of ~6% could unwind quickly
- 📉 Hot CPI data on March 11 shifts Fed expectations toward hawkish, strengthening the dollar
- 💵 Dollar rally on risk-on sentiment reversal
- 📊 WGC warns of 5-20% correction risk in "Reflation Return" scenario
- 🔵 Put gamma support at $475-$480 should slow any selloff
Bear call spread outcome: Full profit. The trader keeps the entire $18M credit as both legs expire worthless.
💡 Trading Ideas
🛡️ Conservative: Buy-the-Dip Gold Exposure
Play: Wait for a pullback to $470-$480 and buy GLD shares or GLDM (lower expense ratio)
Why this works:
- 🥇 Structural gold tailwinds remain intact (central bank buying, dollar weakness, rate pause)
- 📉 After a 6% spike in 3 days, a pullback is normal -- better entry likely coming
- 🔵 Put gamma support at $475-$480 provides a natural floor to buy against
- 💸 GLDM at 0.10% expense ratio saves you 0.30% annually vs GLD
- 📊 Median analyst target of $6,000/oz gold by year-end implies ~12% upside from current spot
Action plan:
- 👀 Watch for pullback to $475-$480 zone (put gamma support)
- 🎯 Set limit buy at $475 for patient entry
- 🛡️ Stop loss below $460 (below the implied move lower range)
- ⏰ Hold through FOMC March 18 for next catalyst
Risk level: Low (buy and hold) | Skill level: Beginner-friendly
⚖️ Balanced: Bull Put Spread on GLD Pullback
Play: Sell $470/$460 put spread on GLD, April 17 expiration
Structure: Sell $470 puts, Buy $460 puts (April 17 expiration)
Why this works:
- 🔵 $470 is well below the weekly implied move lower bound ($477) -- you are getting paid to buy at a discount
- 📊 Put gamma support at $475-$480 means GLD would need to break through a dealer wall to reach your short strike
- ⏰ April expiration gives you 46 days -- includes FOMC March 18 and CPI releases as potential catalysts
- 🥇 Structural gold bull market provides a tailwind -- you are selling puts in an uptrend
- 💰 Defined risk: max loss is $10 spread width minus credit received
Estimated P&L:
- 💰 Collect ~$2.50-$3.50 per spread ($250-$350 credit)
- 📈 Max profit: Keep full credit if GLD above $470 at April 17 expiration
- 📉 Max loss: $650-$750 per spread if GLD below $460
- 🎯 Breakeven: ~$466.50-$467.50
Risk level: Moderate (defined risk) | Skill level: Intermediate
🚀 Aggressive: Follow the Whale into a Bear Call Spread
Play: Smaller-scale bear call spread mimicking the institutional trade
Structure: Sell $490 calls, Buy $500 calls (March 6 expiration -- 4 days)
Why this could work:
- 🐋 You are following a $62M institutional trade -- someone with serious conviction
- ⏰ Only 4 days to expiration = massive theta decay in your favor
- 🟠 Gamma resistance at $495-$500 acts as a natural ceiling
- 📊 Gold just spiked 6% in 3 days -- short-term mean reversion is common after panic spikes
- 💰 Collect premium while time works for you
Why this could go wrong:
- 💣 Iran situation escalates further over the weekend -- gold gaps up Monday/Tuesday
- 🚀 Strait of Hormuz closure confirmed -- oil and gold spike in tandem
- 📈 GLD already at $490.73 close, above the $485 spot when the whale traded -- you are already slightly worse off
- ⚠️ March 6 NFP release is a wildcard -- weak jobs could launch gold higher
- 📉 4 days is not much time to recover if the trade moves against you early
Estimated P&L:
- 💰 Collect ~$3-$4 per spread ($300-$400 credit)
- 📈 Max profit: Keep full credit if GLD below $490 at March 6 expiration
- 📉 Max loss: $600-$700 per spread if GLD above $500
- 🎯 Breakeven: ~$493-$494
Risk level: HIGH (short-dated, binary geopolitical risk) | Skill level: Advanced only
⚠️ WARNING: This trade has binary geopolitical event risk. The Iran-Hormuz situation could escalate at any moment over the next 4 days, and gold could gap significantly higher. Do NOT size this trade larger than you can afford to lose entirely. The institutional trader has the resources to absorb a $27M max loss -- you likely don't. Keep position sizes small.
⚠️ Risk Factors
Don't get caught off guard by these potential landmines:
-
💣 Iran conflict is a live, binary event: The situation can escalate at any moment. If the Strait of Hormuz is formally closed or a major military escalation occurs, gold could surge 5-10% in a single session. This is not a normal market environment -- geopolitical tail risk is extremely elevated right now.
-
📈 Gold is in a parabolic uptrend: Up 84% in 12 months, with the all-time high at $5,589/oz just ~4% above current spot. Parabolic moves can overshoot dramatically before correcting. Betting against momentum this strong requires precise timing and strict risk management.
-
🛢️ Oil-gold feedback loop: Oil prices spiked 13% on the Iran strikes. Higher oil = higher inflation expectations = more safe-haven demand for gold. A Strait of Hormuz shutdown could push Brent above $100, fueling further gold buying.
-
📊 March 6 NFP report lands on expiration day: The February Nonfarm Payrolls release at 8:30 AM ET on March 6 -- the exact expiration date of this spread -- creates additional volatility risk. Weak jobs data could spike gold on rate-cut hopes.
-
🏦 Central bank buying provides structural floor: 60 tonnes/month of central bank purchases means there is a persistent bid underneath gold. Pullbacks may be shallower and shorter than historical norms.
-
📉 Geopolitical de-escalation risk (for longs): If a ceasefire or diplomatic resolution emerges, the 6% geopolitical risk premium could unwind in days. This works in favor of the bear call spread but against anyone buying at current levels.
-
💵 Dollar strength scenario: If the Fed is forced to turn hawkish due to tariff-driven inflation, a rising dollar could knock 5-20% off gold per the World Gold Council's "Reflation Return" scenario.
-
📊 GLD expense ratio drag: At 0.40%, GLD's expense ratio is 4x higher than cheaper alternatives like GLDM (0.10%). For long-term holders, this matters -- but for short-dated options trades like this one, it is irrelevant.
🎯 The Bottom Line
Real talk: A $62M two-legged bear call spread on GLD with just 4 days to expiration is a serious statement. This is not a speculative punt -- it is institutional-scale risk management. The most likely explanation is that this is a hedge on a much larger long gold position. With gold surging 6% in three days on the Iran conflict, a fund sitting on massive gold gains would logically cap their upside at $495 while collecting $18M in premium. If gold keeps running, they participate through their underlying long position. If gold pulls back, the $18M credit cushions the drawdown.
What this trade tells us:
- 🎯 The trader expects GLD to stay around $485-$495 through Friday -- a consolidation call
- 💰 $18M net credit = they are willing to give up upside above $495 for 4 days
- ⚖️ Defined risk ($27M max loss) suggests disciplined risk management, not a blind bet
- 📊 With Vol/OI ratio of 1.0x on the $495 leg, this is clearly new positioning -- not closing an old trade
If you are long gold/GLD:
- ✅ This is encouraging -- institutional money is not dumping gold, they are just capping short-term upside
- 📊 Gamma support at $475-$480 provides a solid floor for existing positions
- 🎯 Consider trimming if you are overweight after an 84% run -- take some off the table
- 🛡️ Selling covered calls against long GLD positions at $500-$510 strikes could be smart income
- ⏰ Watch the FOMC meeting March 18 as the next big catalyst
If you are watching from the sidelines:
- ⏰ Wait for the Iran-Hormuz situation to stabilize before establishing new long positions
- 🎯 A pullback to $475-$480 (put gamma support / below implied move lower bound) would be an attractive entry
- 📈 The structural bull case remains strong: median analyst target is ~$6,000/oz gold by year-end (~12% upside)
- 💡 Consider cheaper alternatives like GLDM for long-term gold exposure
If you are bearish on gold:
- ⚠️ Fighting a parabolic uptrend backed by geopolitical crisis, central bank buying, and record ETF inflows is dangerous
- 📊 If you must play the short side, use defined-risk spreads (bear call spreads like this whale) -- never naked shorts
- 🕊️ The best bearish catalyst would be a ceasefire in Iran -- wait for that trigger before getting aggressive
- 📉 Commerzbank targets $4,200-$4,400/oz and Citi has a bear case of $3,600-$3,800 -- but those require dollar strength and de-escalation
Mark your calendar -- Key dates:
- 📅 March 4 (Tuesday) -- Canada/China tariff escalation takes effect
- 📅 March 6 (Friday) 8:30 AM ET -- February NFP release AND this spread's expiration
- 📅 March 11 (Wednesday) -- February CPI release
- 📅 March 17-18 (Tue-Wed) -- FOMC Meeting (rate decision March 18)
- 📅 March 20 (Friday) -- Triple Witch quarterly OPEX
- 📅 April 28-29 -- Next FOMC Meeting
- 📅 Ongoing -- Iran/Strait of Hormuz situation (watch daily)
Final verdict: This $62M bear call spread is a textbook institutional hedge -- not a directional bet against gold. The structural bull case for gold remains intact with central banks buying, ETF inflows at records, and a live geopolitical crisis. But in the very short term (4 days), the trader is betting that the panic spike cools off. For retail traders, the takeaway is simple: gold's long-term setup is strong, but don't chase after a 6% spike. Be patient, use defined-risk strategies, and let the Iran situation clarify before committing big capital.
Disclaimer: Options trading involves substantial risk of loss and is not suitable for all investors. This analysis is for educational purposes only and not financial advice. Past performance does not guarantee future results. The Z-scores of 4.95 and 2.06 reflect these specific trades' size relative to recent history -- they do not imply the trade will be profitable or that you should follow it. Geopolitical events create unpredictable, outsized market moves. Always do your own research and consider consulting a licensed financial advisor before trading.
About SPDR Gold Shares (GLD): GLD is the world's largest physically-backed gold ETF with ~$182.9B in assets under management, holding 1,101 tonnes of gold bullion. Managed by State Street Global Advisors with a 0.40% expense ratio, it trades on NYSE Arca and is the most liquid gold ETF for institutional options activity.