🐋 GLD Whale Closes $23.7M Call Spread as Gold Pulls Back from All-Time Highs!
📅 2026-03-05 | 🔥 Unusual Activity Detected
🎯 The Quick Take
Someone just unwound a $23.7M call spread in GLD -- 44,586 contracts across two legs, all in a single print at 9:58 AM. Both legs scored a z-score above 4.7, making this EXTREMELY UNUSUAL activity -- the kind of institutional block trade you see only a few times a year. With gold pulling back ~8% from its all-time high near $5,600/oz and a gauntlet of catalysts ahead (NFP tomorrow, CPI March 11, FOMC March 17-18), a major player just took chips off the table on their gold bet. Let's break it down. 👀
🏢 What is GLD?
SPDR Gold Shares (GLD) is the world's largest gold-backed ETF with $184.8B in assets under management. Each share represents roughly 1/10th of an ounce of gold held in vaults. GLD is the primary vehicle institutions and retail traders use to get exposure to gold without dealing with futures or physical bullion. It trades on NYSE Arca under the commodity contracts sector.
📈 52-week return: +83.7% | 📊 52-week range: $265.64 - $509.70
💰 The Option Flow Breakdown
📊 What Just Happened
| Detail | Leg 1 (Long Call) | Leg 2 (Short Call) |
|---|---|---|
| 📅 Time | 09:58:35 ET | 09:58:35 ET |
| 🔄 Action | BUY $505 Call | SELL $485 Call |
| 📅 Expiration | 2026-03-13 (8 days) | 2026-03-13 (8 days) |
| 📊 Size | 44,586 contracts | 44,586 contracts |
| 📈 Volume vs OI | 56K / 56K (1.0x) | 56K / 57K (0.98x) |
| 💰 Premium | $5.7M @ $1.27 | $18M @ $4.02 |
| 🏷️ Execution | MID price | BELOW BID |
| 🔍 Z-Score | 4.68 | 4.73 |
| 🏷️ Classification | EXTREMELY UNUSUAL | EXTREMELY UNUSUAL |
| 🔄 Signal | Close Long Call (BTC) | Close Short Call (STC) |
🤓 What This Actually Means
Let me break this down in plain English:
🐋 This is a call spread CLOSURE, not a new bet. The trader was previously short the $485 call and long the $505 call (a bear call spread or the closing of a bull call spread). Today they bought back the $505 call and sold to close the $485 call -- completely unwinding the position.
💵 Net credit received: ~$2.75 per contract ($4.02 received - $1.27 paid), totaling approximately $12.3M in net cash collected on this unwind.
🔑 Key details that scream institutional:
- 🐋 44,586 contracts = exposure on 4.46 million shares of GLD (~$2.1B notional)
- 🏷️ The $485 leg was sold BELOW BID -- they were willing to take a worse fill to get out fast
- 📊 Volume equals OI on both strikes, confirming these are position closures, not new bets
- ⏰ Both legs printed at the exact same second -- coordinated block execution
Translation: A large institution that had a bearish-to-neutral gold position heading into March expiration just said "I'm done with this trade" and closed everything out for a $12.3M credit. With GLD at $469.47, both strikes are OTM so the spread was profitable -- they collected premium when it was put on and now they're locking in that profit before NFP tomorrow and a packed catalyst calendar.
📈 Technical Setup / Chart Check-Up
📊 YTD Price Action
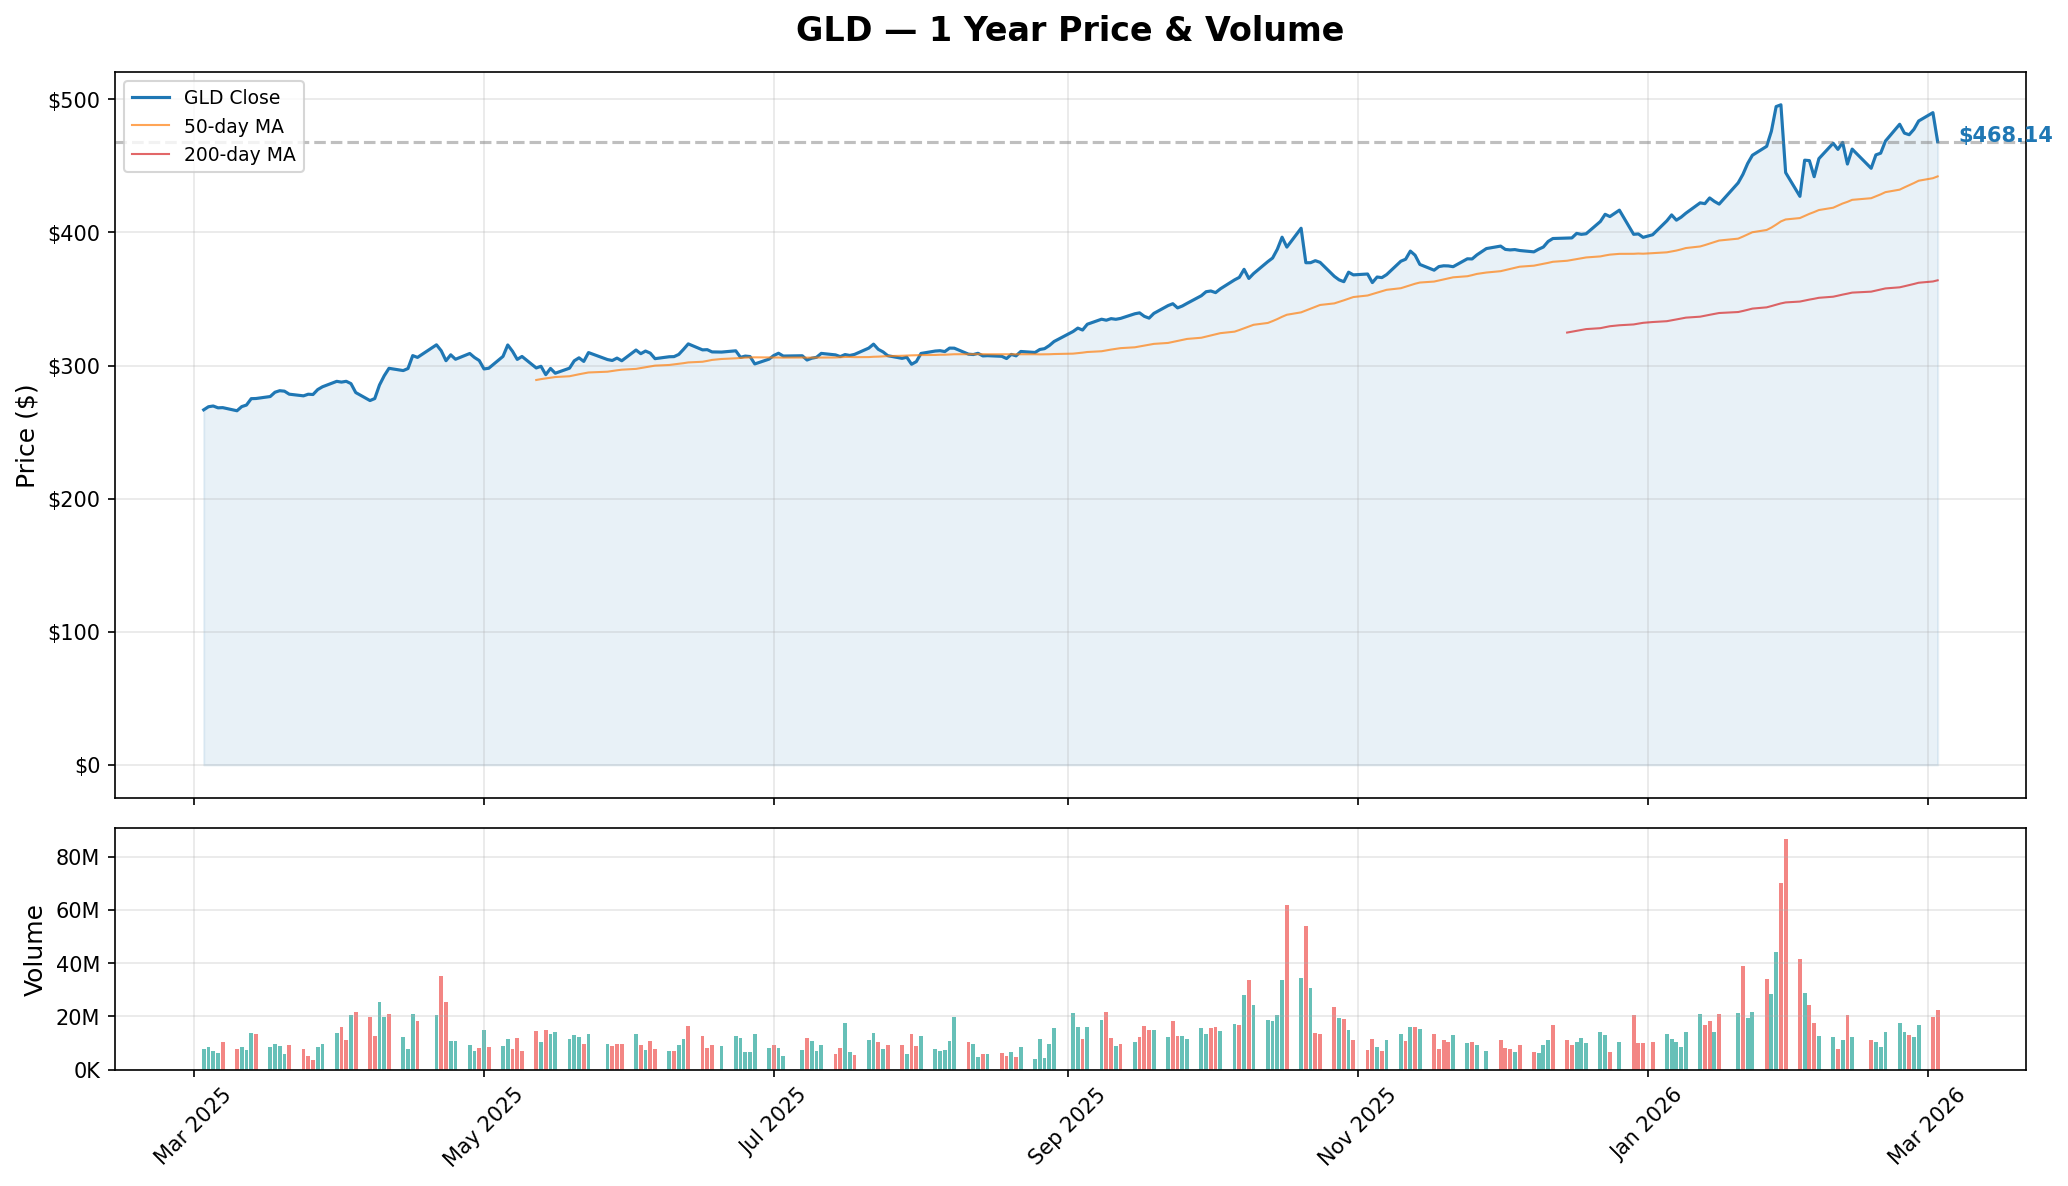
GLD has been on an absolute tear, rallying from ~$270 in March 2025 to a peak of $509.70 in January 2026. That's an 83.7% gain in 12 months. But the chart tells us a few important things right now:
📈 GLD is currently at $468.14, sitting right above its 50-day moving average (~$466) after pulling back from the March 3 spike to ~$493
📊 Volume has been massive over the past few months -- those tall red/teal bars in the volume panel since January show heavy institutional participation
🔄 The pullback from $509 to $466 represents a ~8.5% correction -- healthy after a 100%+ run, and RSI has reset to neutral at 50.57
🔵🟠 Gamma-Based Support & Resistance Analysis
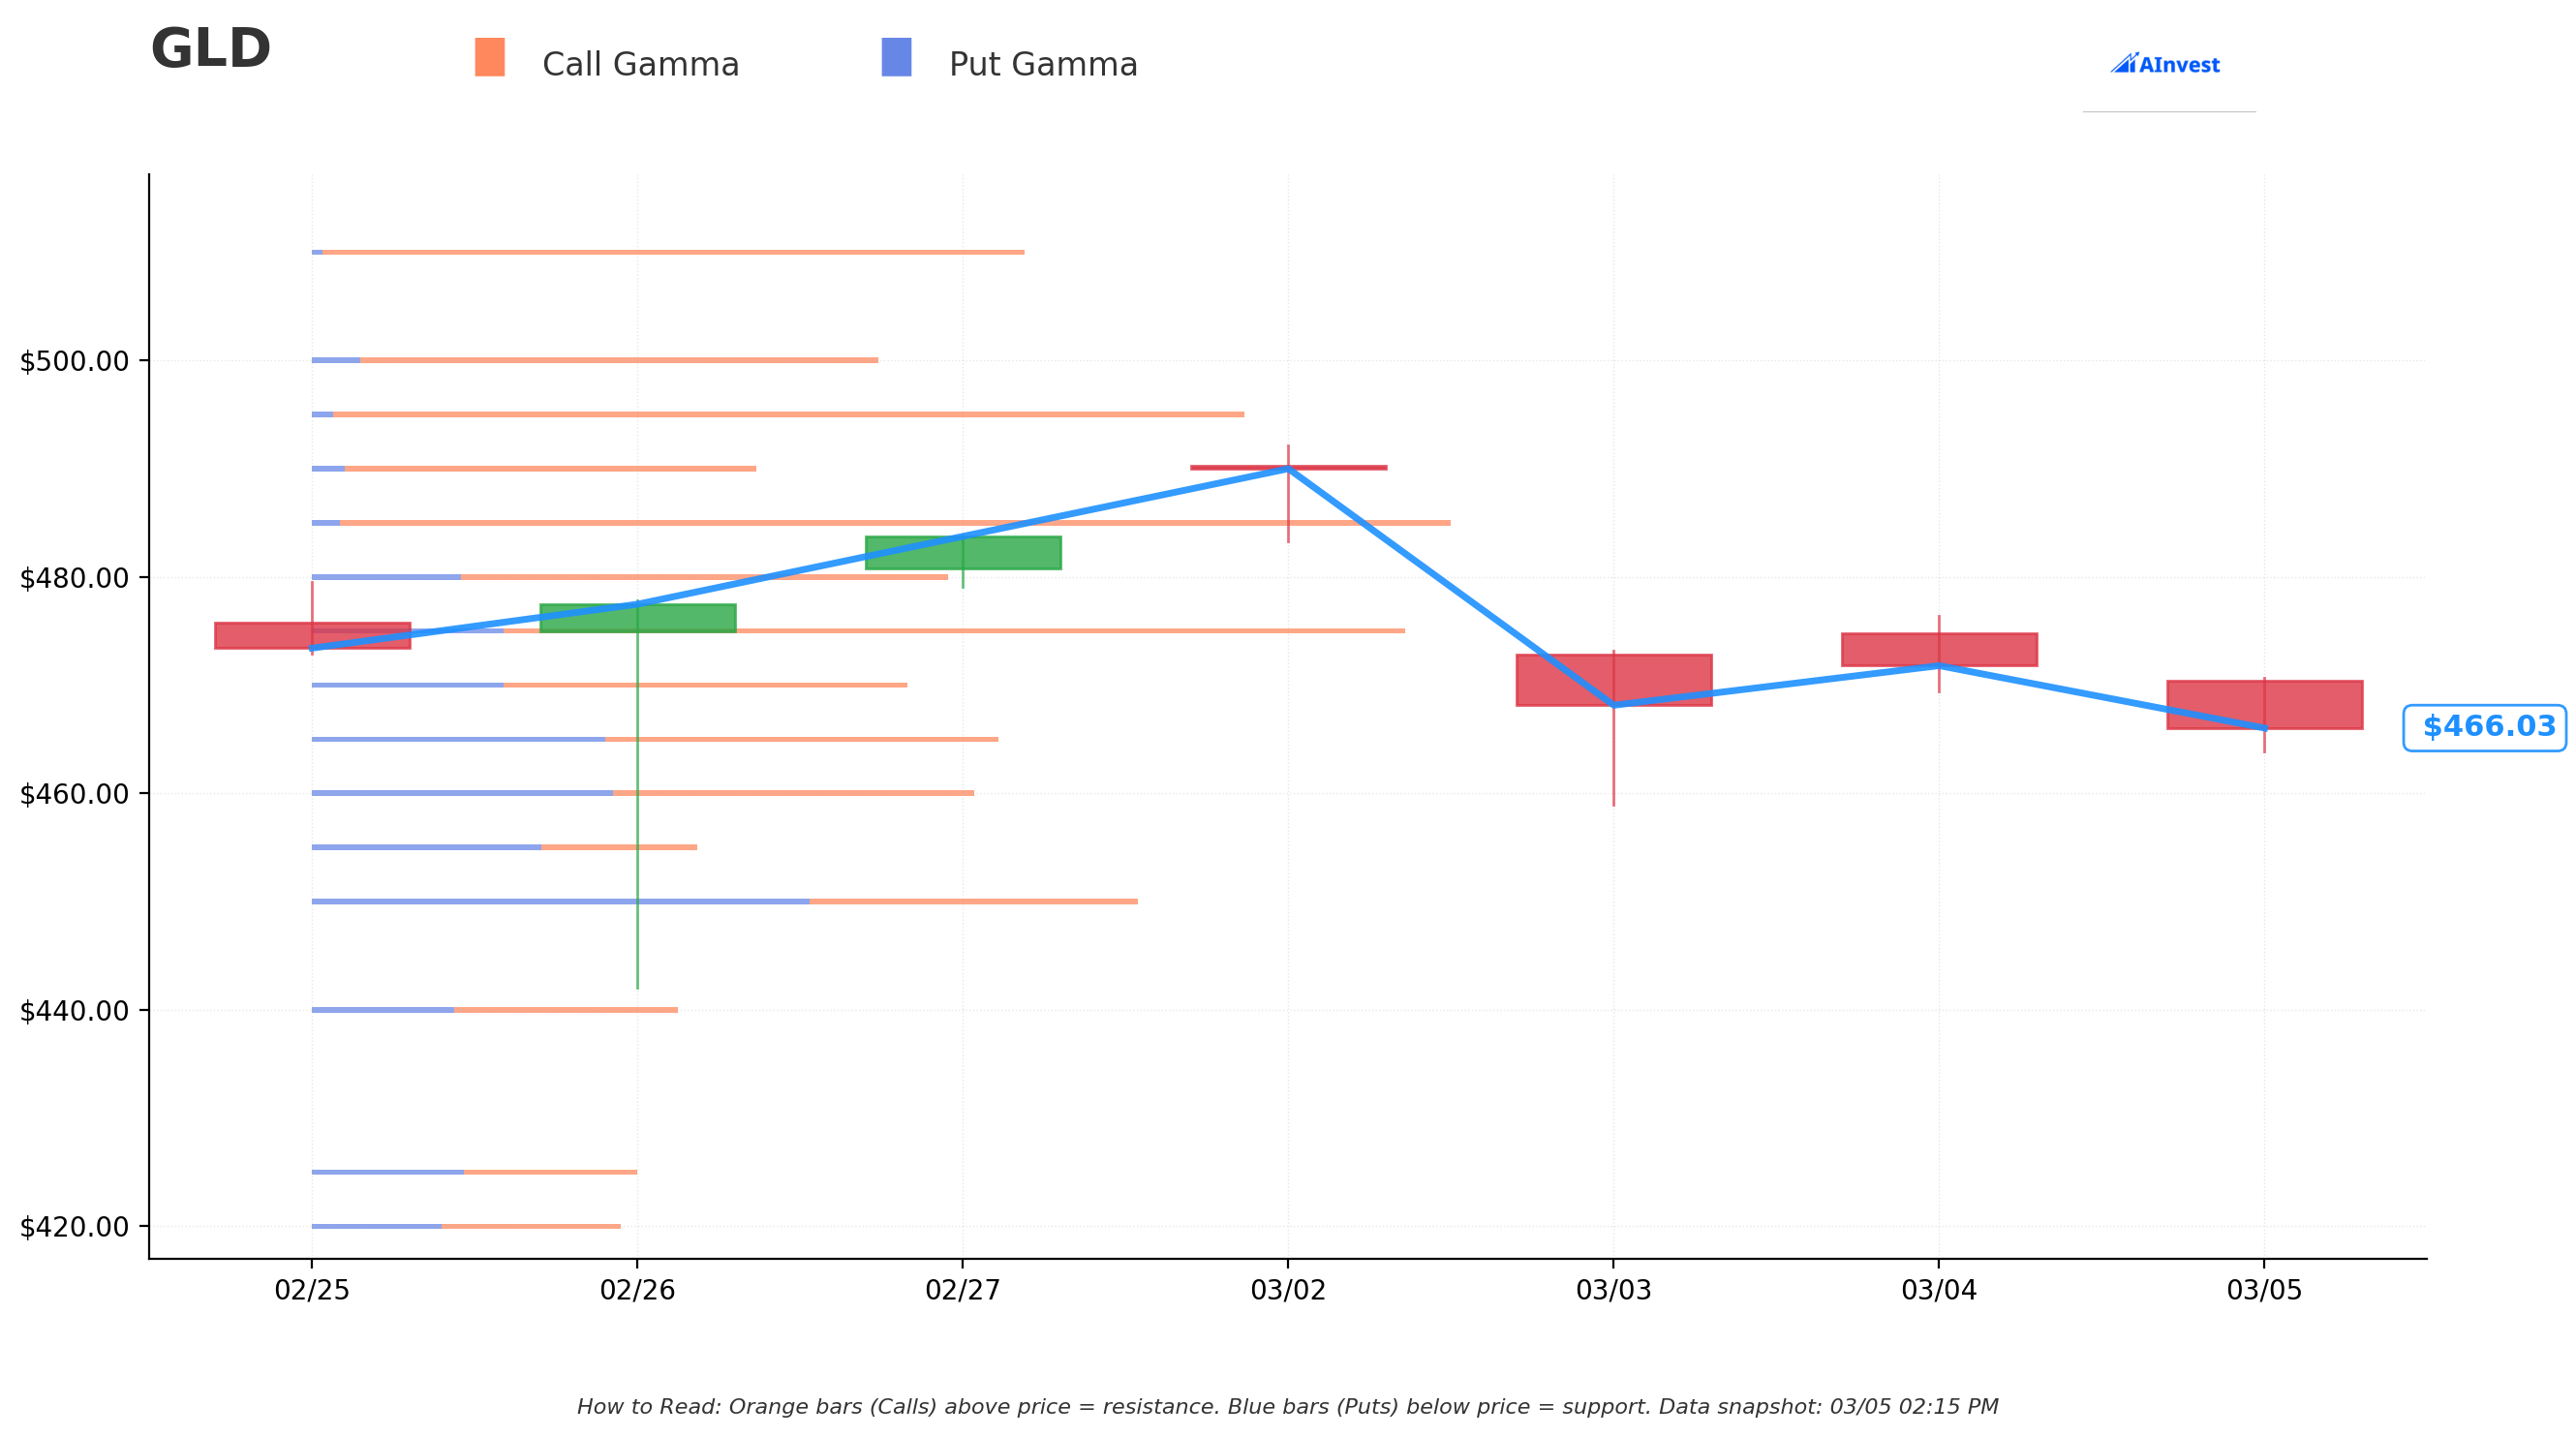
How to read this chart: The 🟠 orange bars (Call Gamma) above price act as resistance -- think of them as magnetic walls that make it harder for GLD to push higher. The 🔵 blue bars (Put Gamma) below price act as support -- they're like cushions that slow down any sell-off. Bigger bars = stronger levels.
What the gamma map tells us:
🟠 Resistance levels above price:
- $475-$480 zone: First call gamma cluster -- this is the near-term ceiling GLD needs to break
- $485 strike: Heavy call gamma (matches our whale trade!) -- this is a key pivot level
- $495-$500 zone: Thick band of call gamma resistance from the March 3 spike zone
- $505-$510 zone: The strongest call gamma wall near the all-time high
🔵 Support levels below price:
- $465-$466 area: Current price sits right at put gamma support -- coincides with the 50-day MA ($465.86)
- $460 zone: Secondary put gamma support
- $450 area: Deeper put gamma cushion
- $440 zone: Strongest put gamma support floor
The key takeaway: GLD is currently sitting on gamma support near $466, with significant call gamma resistance stacked overhead from $475 all the way up to $510. The whale closing their call spread at $485/$505 is consistent with this picture -- those strikes sit right in the resistance zone.
📐 Implied Move Analysis
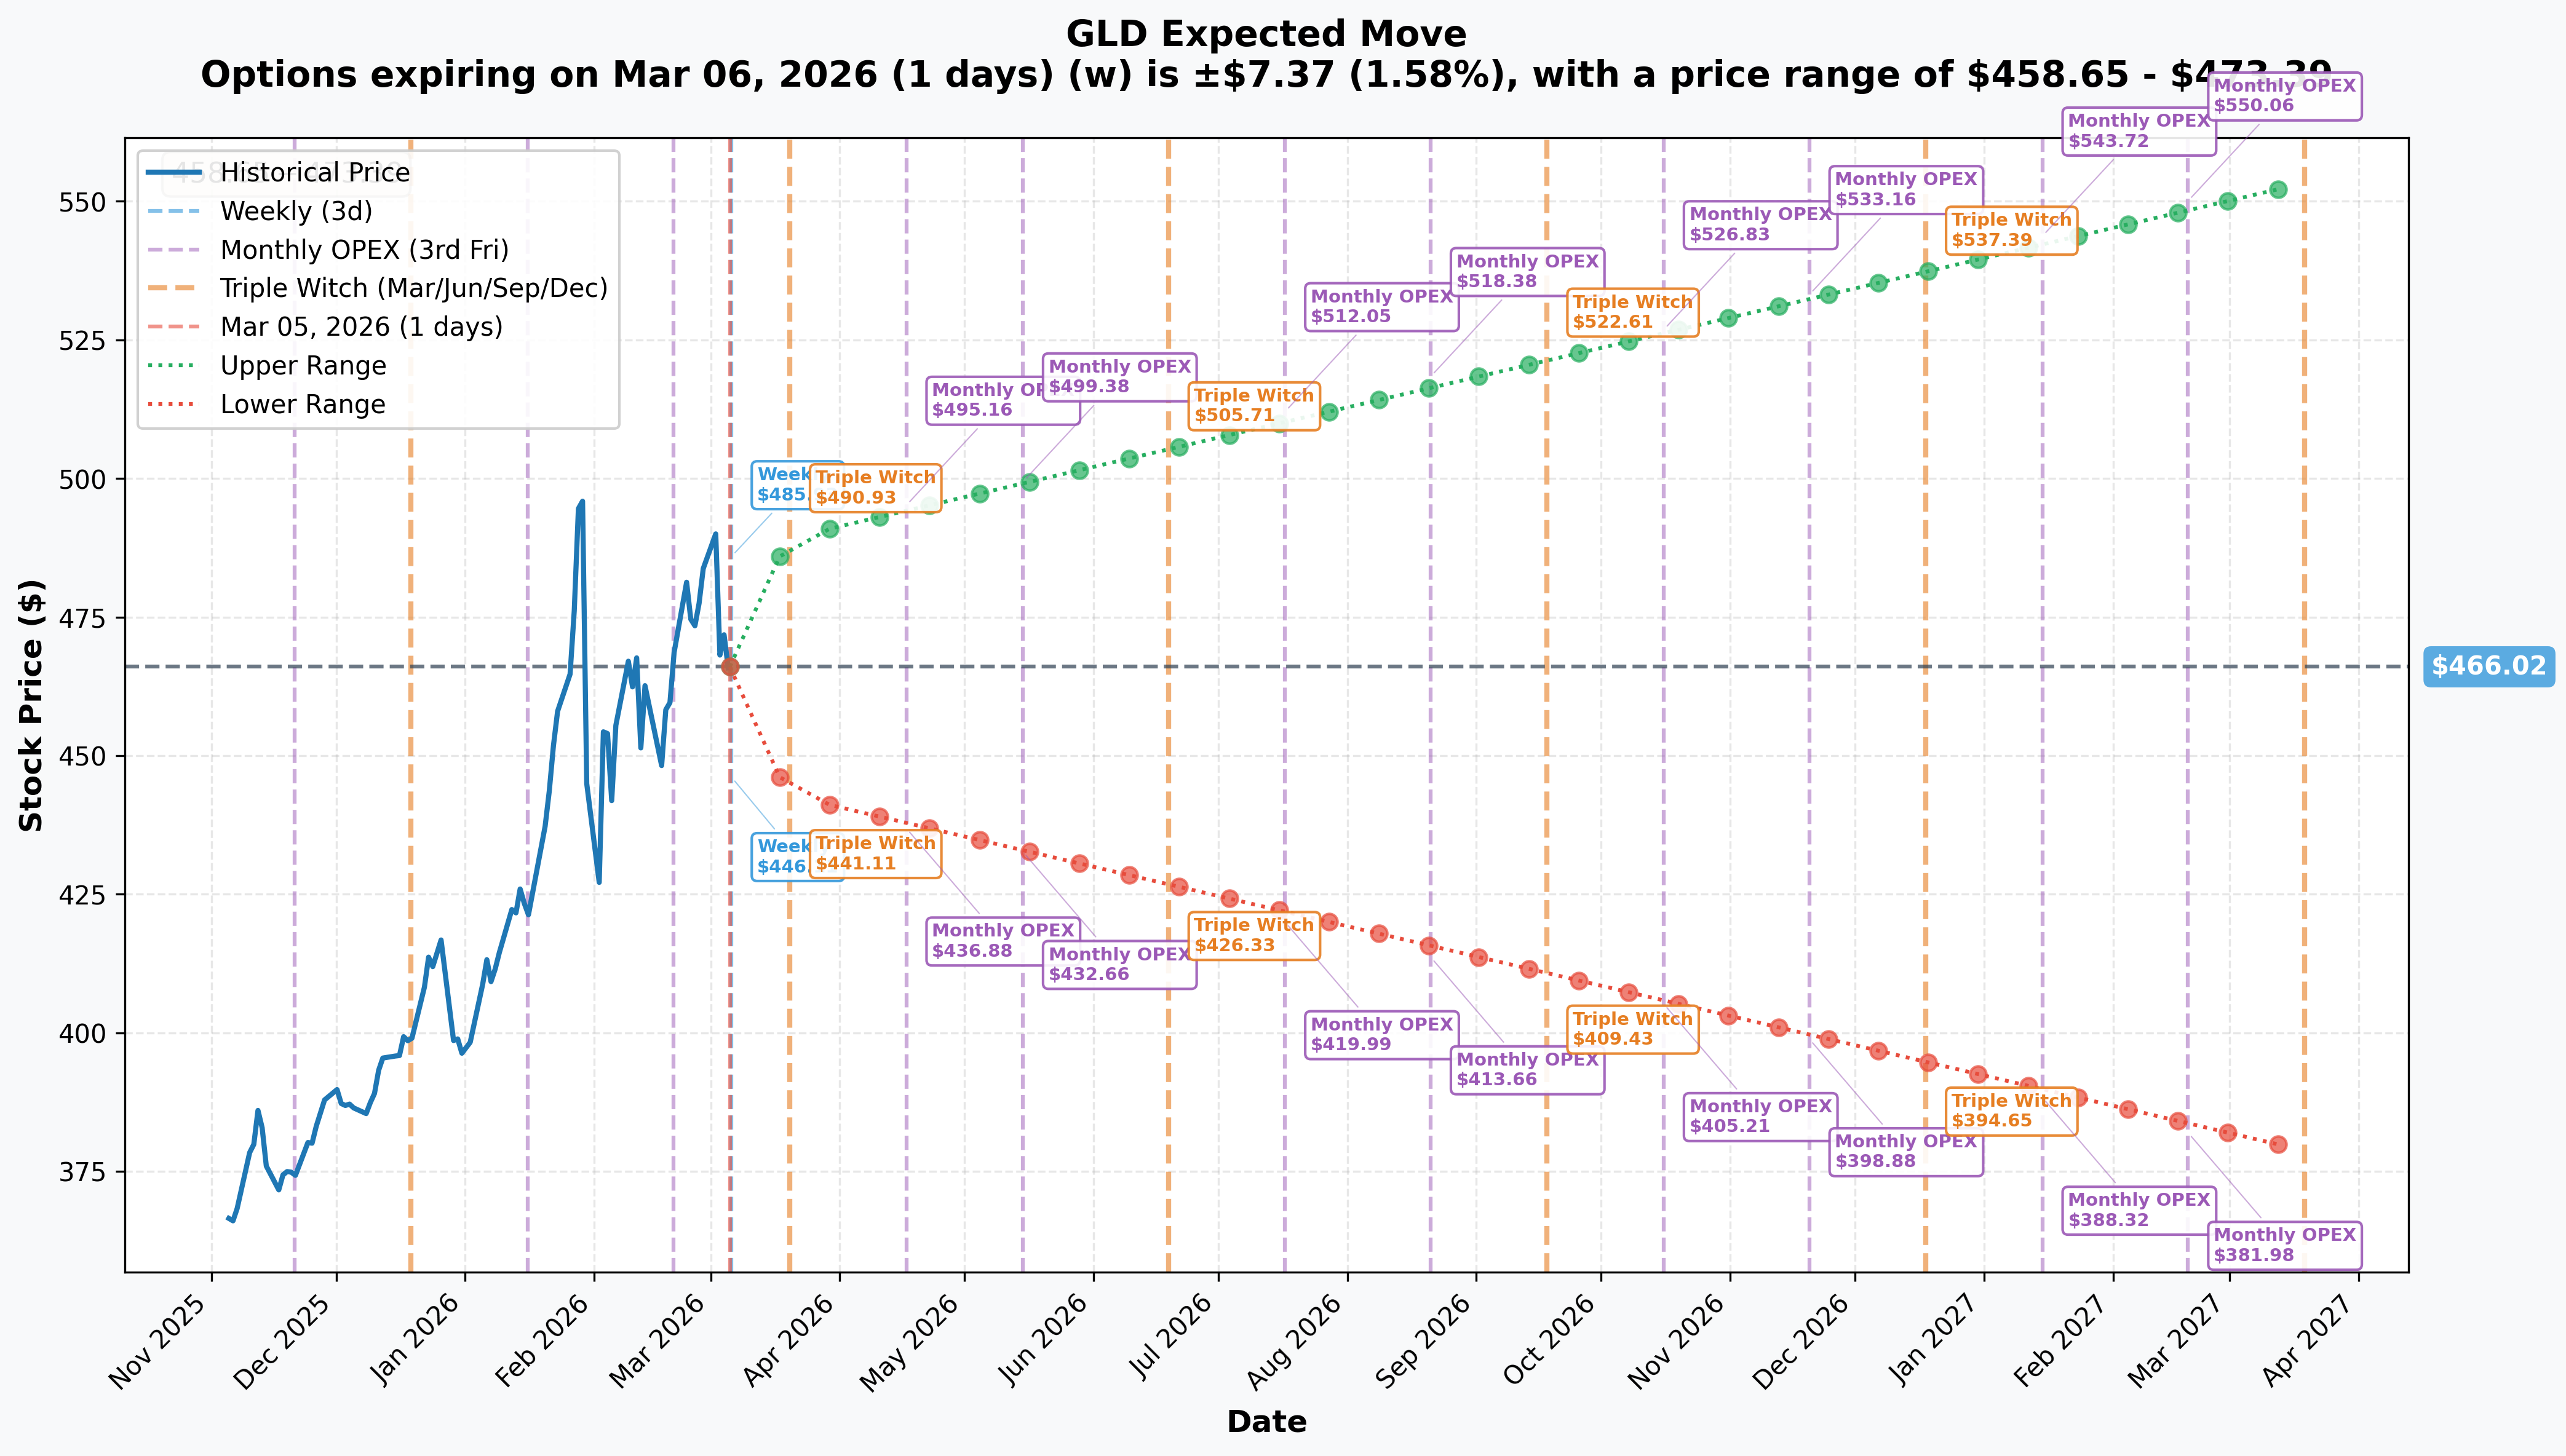
The options market is pricing in meaningful moves across all timeframes:
| Timeframe | Expiry | Implied Move | Range |
|---|---|---|---|
| 📅 Weekly (1 day) | 2026-03-06 | ±$7.37 (1.58%) | $458.65 - $473.39 |
| 📅 Monthly OPEX | 2026-03-20 | ±$23.33 (5.0%) | $442.69 - $489.35 |
| 📅 Triple Witch | 2026-03-20 | ±$23.33 (5.0%) | $442.69 - $489.35 |
| 📅 LEAPS | 2027-03-19 | ±$87.38 (18.8%) | $378.64 - $553.40 |
What this means for you:
📊 With NFP dropping tomorrow, the market expects GLD could move $7+ in either direction by end of day Friday. That's a big deal.
🎯 By March OPEX (Triple Witch on March 20), the implied range is $442.69 to $489.35 -- the $485 strike from our whale trade sits right near the upper bound of the expected move! That helps explain why they were comfortable closing: even with bullish macro conditions, the market says $485+ by March 20 is a stretch.
💡 The LEAPS pricing out to $553.40 on the upside through March 2027 aligns with Goldman Sachs' $5,400/oz year-end target and J.P. Morgan's base case of $5,055/oz.
🎪 Catalysts
🔥 Recent Catalysts (Already Happened)
📌 Gold All-Time High $5,595/oz (January 29) -- GLD peaked at $509.70, the blow-off top from the historic gold rally
📌 Strait of Hormuz Crisis (February 28 - Present) -- US and Israel launched strikes on Iran, Iran retaliated and restricted Hormuz passage. Tanker traffic dropped ~70%, oil supertanker rates hit all-time highs. This is the dominant gold price driver right now.
📌 Supreme Court Tariff Ruling (February 20) -- SCOTUS struck down IEEPA tariffs, admin pivoted to Section 122 with a 10% global tariff. Gold surged past $5,000 on the chaos.
📌 Record ETF Inflows (Q1 2026) -- Global gold ETFs saw $21B in Q1 inflows, the second-strongest quarter on record. GLD AUM crossed $184.8B.
📌 Central Bank Buying -- Goldman Sachs forecasts 60 tonnes/month purchases through 2026. China has bought gold for 15 consecutive months.
📅 Upcoming Catalysts
| Date | Event | Impact |
|---|---|---|
| 📅 March 6 | February NFP Report | 🔥 High -- Weak jobs = gold rally; Strong jobs = USD up, gold dip |
| 📅 March 11 | February CPI Report | 🔥 High -- Hot CPI = inflation hedge bid; Cool CPI = rate cut hopes |
| 📅 March 13 | Whale trade expiration | 📊 These $485/$505 calls expire -- no more hedging pressure |
| 📅 March 17-18 | FOMC Meeting + Dot Plot | 🔥🔥 Very High -- Most important near-term catalyst; rate path guidance |
| 📅 ~April 9 | February PCE Price Index | 🔥 High -- Fed's preferred inflation gauge (rescheduled) |
| 📅 April 28-29 | FOMC Meeting | 🔥 High -- CME FedWatch points to possible first rate cut |
| 📅 ~July 23 | Section 122 Tariff Expiry | 🔥 High -- 150-day authority expires, policy cliff |
| 📅 Ongoing | Strait of Hormuz Resolution | 🔥🔥 Very High -- Escalation/de-escalation is the swing factor |
🎲 Price Targets & Probabilities
Based on the gamma levels, implied move data, and current catalyst landscape:
🐻 Bear Case: $442 - $456 (20% probability)
📉 If NFP comes in hot tomorrow and the dollar surges past 100 on DXY, or if a surprise Iran ceasefire unwinds the geopolitical premium, GLD could pull back to the 200-day moving average at $456.80 -- or even test the monthly implied move floor of $442.69. The gamma chart shows put support thinning out below $450.
🔑 Why this happens: De-escalation in Hormuz + hawkish FOMC = 5-10% risk premium unwind, as analysts from multiple firms have noted. COMEX positioning is stretched long (net 159K contracts) and crowded trades can unwind fast.
⚖️ Base Case: $465 - $485 (55% probability)
📊 The most likely outcome is GLD trading in a range between the 50-day MA support ($466) and the $480-$485 gamma resistance zone through March OPEX. The whale closing their call spread with the short leg at $485 essentially agrees with this view. The catalyst calendar keeps things elevated but contained.
🔑 Why this happens: RSI at neutral 50.57, put/call ratio bullish at 0.53, structural gold demand from central banks (~60 tonnes/month) and record ETF inflows put a floor under price. But the short-term implied move caps the upside near $489.
🚀 Bull Case: $490 - $510 (25% probability)
📈 If Hormuz escalation intensifies, NFP misses badly (spurring rate cut hopes), and the FOMC delivers a dovish surprise, GLD could retest the March 3 spike zone at $490-$493 and potentially make a run at the all-time high of $509.70. The gamma chart shows the strongest call resistance near $500-$510 which would be the test.
🔑 Why this happens: J.P. Morgan's upside scenario targets $6,300/oz gold (GLD ~$575). Hormuz staying closed beyond 2 weeks could send oil past $100/bbl, creating the stagflation conditions that are the most bullish setup for gold. The gold-dollar rising together pattern signals deep macro stress that historically favors gold.
💡 Trading Ideas
🛡️ Conservative: "The Gold Floor" -- Cash-Secured Put Write
Strategy: Sell the GLD March 20 $455 Put
📌 Setup: With GLD at $469, sell the $455 put ($455 strike is below the 200-day MA at $456.80)
📊 Collect: $2.50-$3.00 per contract in premium (estimated given 25.2% IV)
🛡️ Max risk: Assigned GLD at $455 minus premium received ($452 effective cost basis)
🎯 Win condition: GLD stays above $455 by March 20 -- you keep the premium
📈 Probability of profit: ~75% (strike is below put gamma support and the 200-DMA)
Why this works: You're getting paid to commit to buying GLD at a ~7% discount to current levels. If gold's structural bull case is intact (it is), owning GLD at $452 effective basis would be a gift. Elevated IV (25.2%) means you're getting paid more for that commitment. Worst case, you own gold near a major support level in the middle of a historic bull run.
⚖️ Balanced: "The Gold Range" -- Iron Condor Through March OPEX
Strategy: GLD March 20 Iron Condor: Sell $490/$500 Call Spread + Sell $445/$435 Put Spread
📌 Setup: Sell $490 call / Buy $500 call AND Sell $445 put / Buy $435 put
📊 Collect: $2.00-$2.50 net credit
🛡️ Max risk: $10 per spread minus credit received ($7.50 per side)
🎯 Win condition: GLD stays between $445 and $490 by March 20
📈 Probability of profit: ~60-65% (both short strikes are outside the monthly implied move range of $442-$489)
Why this works: The whale trade is telling us that even a big institutional player doesn't think GLD blows past $485 by March 13 -- and our implied move data says the market agrees ($489.35 is the upper range for March 20). You're selling premium on both sides where the gamma chart shows resistance (calls) and support (puts). The elevated 25.2% IV works in your favor as a premium seller.
⚠️ Watch out for: Hormuz escalation headlines or a big NFP miss could blow through the upside. Keep stop-losses if $490 is breached.
🚀 Aggressive: "The Gold Reload" -- Bullish Call Spread for ATH Retest
Strategy: GLD April 17 $475/$500 Bull Call Spread
📌 Setup: Buy $475 call / Sell $500 call (April 17 expiration gives you 6 weeks + FOMC) 📊 Cost: ~$7-$8 debit per spread 🎯 Max profit: $25 per spread minus cost = ~$17-$18 per contract 📈 Breakeven: ~$483 at expiration 🎯 Win condition: GLD rallies back toward the all-time high zone by April OPEX
Why this works: Gold's structural story is insanely bullish -- Hormuz crisis, central bank buying, $21B in Q1 ETF inflows, stagflation fears. The pullback from $509 to $466 has reset RSI to neutral and created a re-entry window. The April expiration gives you time to absorb NFP (March 6), CPI (March 11), AND FOMC (March 17-18). If any of those catalysts spark a re-acceleration, GLD's all-time high at $509.70 is the target. The April OPEX implied upper range is $495.16, which gets you well into profit territory.
⚠️ The risk: If Hormuz de-escalates and rate cuts get pushed out, GLD could settle into the $450s range and this spread bleeds out. Only risk what you can afford to lose.
⚠️ Risk Factors
❗ Geopolitical De-escalation Risk: Any Iran ceasefire or Hormuz reopening could yank 5-10% of the risk premium out of gold overnight. This is the biggest near-term risk. Analysts warn the pullback could be swift.
❗ Dollar Strength: DXY is at 99.33 and approaching 100. If it breaks through and holds, it creates a headwind for gold even in a crisis environment.
❗ Crowded Positioning: COMEX net longs are at 159K contracts -- extremely stretched. When everyone is on the same side of the trade, liquidation cascades can be violent.
❗ Real Yields Rising: 10-year TIPS yield at 1.82% represents a historically elevated opportunity cost for holding non-yielding gold. If the Fed stays hawkish, this pressure intensifies.
❗ Profit-Taking After 100%+ Rally: After doubling in 12 months, 10-15% corrections are normal and healthy. We're only 8% off the high -- more downside isn't abnormal.
❗ Catalyst Density Risk: NFP tomorrow, CPI in 6 days, FOMC in 12 days -- that's three major events that could whipsaw GLD in either direction. Options are priced accordingly (IV at 25.2%) so buying premium is expensive.
🎯 The Bottom Line
Real talk: A whale just closed a $23.7M call spread in GLD, collecting roughly $12.3M net as they unwound their position. Both legs scored above 4.7 on the z-score -- this is a trade you see maybe a handful of times a year in GLD. The message is clear: this institution locked in profits on their gold options position before a packed week of catalysts.
Here's your action plan:
🟢 If you're bullish on gold: The pullback to $466 from $509 is your entry window. The structural story (Hormuz crisis, central bank buying, ETF inflows, stagflation) is incredibly strong. Use the April $475/$500 bull call spread to play the rebound with defined risk. Mark your calendar for NFP on March 6 and FOMC on March 17-18 -- these are the triggers.
🟡 If you're watching from the sidelines: This is a sell-premium environment. IV at 25.2% and a dense catalyst calendar means options are expensive. Iron condors or cash-secured puts let you collect that elevated premium while gold chops in a range. The whale closing their call spread is telling you the near-term range is $465-$485.
🔴 If you're cautious on gold: Respect the macro setup but watch for the de-escalation signal. A Hormuz reopening or Iran ceasefire is your cue that the risk premium is coming out. The 200-day MA at $456 and the $440 zone are where you'd want to start nibbling if we get a deeper pullback.
🗓️ Key dates: NFP March 6 (tomorrow!), CPI March 11, whale trade expiry March 13, FOMC March 17-18. This next two weeks will define GLD's direction into spring.
⚠️ Disclaimer: This analysis is for educational purposes only and does not constitute financial advice. Options trading involves significant risk of loss. Past performance does not guarantee future results. Always do your own research and consult with a qualified financial advisor before making investment decisions.
Analysis by Ainvest | Data as of March 5, 2026