🛢️ HAL $16.8M Double Bull Bet - Someone Just Loaded Up 45,000 Calls on Halliburton!
📅 January 28, 2026 | 🔥 Unusual Activity Detected
🎯 The Quick Take
Two massive back-to-back call purchases hit the tape on HAL this morning - $8.4M at 10:52am and another $8.4M at 10:59am, totaling $16.8 MILLION in bullish call premium on the September $35 strike. That's 45,000 contracts bought to open within 8 minutes of each other, representing conviction on a stock that just crushed Q4 earnings a week ago and is flirting with 52-week highs. This is institutional money making a strong directional bet that Halliburton is heading higher over the next 8 months.
📊 Company Overview
Halliburton Company (HAL) is North America's largest oilfield services company, specializing in hydraulic fracturing, completions, drilling fluids, and directional drilling:
- Market Cap: $28.8 Billion
- Industry: Oil & Gas Field Services
- Current Price: $33.81
- Employees: 48,000 | Headquarters: Houston, TX
- Primary Business: Completion & Production services (~58% of revenue) and Drilling & Evaluation services (~42%), serving oil and gas producers worldwide
💰 The Option Flow Breakdown
The Tape (January 28, 2026):
| Time | Symbol | Side | Buy/Sell | Type | Expiration | Premium | Strike | Volume | OI | Size | Spot | Option Price |
|---|---|---|---|---|---|---|---|---|---|---|---|---|
| 10:52:04 | HAL | ASK | BUY | CALL $35 | 2026-09-18 | $8.4M | $35 | 23K | 1.1K | 22,500 | $33.81 | $3.73 |
| 10:59:54 | HAL | ASK | BUY | CALL $35 | 2026-09-18 | $8.4M | $35 | 45K | 1.1K | 22,500 | $33.71 | $3.73 |
🤓 What This Actually Means
This is a straight-up bullish bet on Halliburton going higher. Here's the breakdown:
- 💸 Massive premium deployed: $16.8M total ($3.73 per contract x 45,000 contracts across two trades)
- 🎯 Strike price: $35 is 3.5% above current price - slightly out-of-the-money, needs the stock to rally
- ⏰ Long runway: September 18 expiration gives nearly 8 months for the thesis to play out
- 📊 Size dwarfs open interest: 45,000 contracts vs just 1,100 OI - this is 40x the existing open interest
- 🏦 Buy to Open (BTO): Confirmed new position, NOT closing an existing trade
- 🔥 Two separate clips: Splitting into two 22,500-lot trades 8 minutes apart suggests the buyer was working a larger order and got filled in pieces
What's really happening here: Someone with deep pockets is betting that HAL trades above $38.73 (strike + premium = breakeven) by September. That's a ~14.6% move from current levels. With the stock already at 52-week highs after a blowout Q4, this buyer sees MORE upside ahead - likely driven by Venezuela re-entry, the VoltaGrid AI data center partnership, and international contract wins. The September $35 calls capture two full earnings reports (Q1 on April 21, Q2 in July) plus any Venezuela mobilization news.
Unusual Score: 🔥 EXTREME (Z-Score: 420.45 on the second trade) - This is well into "extremely unusual" territory. Volume of 45,000 contracts against 1,100 open interest is a 40:1 ratio, which you might see a handful of times per year on a name like HAL. This is clearly institutional capital at work.
📈 Technical Setup / Chart Check-Up
YTD Performance Chart
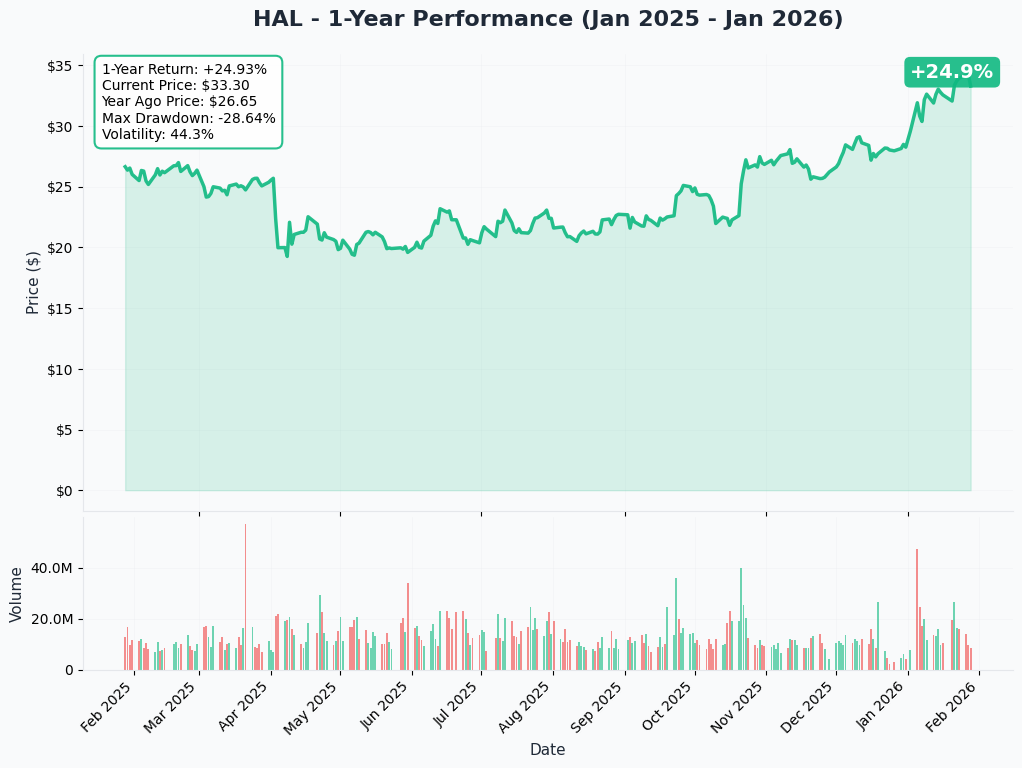
HAL is off to a strong start in 2026, up 13.5% YTD and trading near its 52-week high of $34.26. The stock has recovered from its 2025 lows near $18.72 and is now benefiting from a combination of cost-cutting execution, earnings beats, and improving sentiment around oilfield services.
Key observations:
- 📈 Strong uptrend: Rallied from ~$30 at year start to $33.81 on Q4 earnings momentum
- 💪 Earnings catalyst: Q4 beat on January 21 (EPS $0.69 vs $0.54 consensus, +27.8%) sparked the latest leg higher
- 🎯 At resistance: Trading just below the 52-week high of $34.26 - a breakout above this level could trigger technical buying
- 📊 Volume confirmation: Heavy institutional accumulation visible in recent sessions
- ⚠️ Near-term caution: Stock trading above the analyst consensus price target of $31.55 - already ahead of the Street
Gamma-Based Support & Resistance Analysis
Current Price: $33.81
The gamma exposure map reveals the key price levels where options market makers hold significant positions, creating natural magnets and barriers:
🔵 Support Levels (Below Price):
- $33 - Immediate support with 8.9B total gamma exposure (strongest nearby floor)
- $32 - Secondary support at 7.4B gamma (solid cushion if we dip)
- $31.50 - Deeper support at 4.8B gamma with heavy put gamma creating a natural buyer zone
- $31 - Extended support at 2.9B gamma
- $30 - Major structural floor at 5.8B gamma (round number + significant options interest)
- $28 - Disaster floor at 2.2B gamma (would require a significant macro event)
🟠 Resistance Levels (Above Price):
- $34 - First resistance with 9.8B total gamma (STRONGEST nearby level - breakout zone!)
- $35 - Major resistance at 13.0B gamma (THIS IS THE STRIKE WHERE THE BIG BET LANDED!)
- $37 - Secondary ceiling at 2.7B gamma (11% above current)
- $40 - Extended target at 3.5B gamma (20% rally required)
What this means for traders: HAL is sandwiched between strong $33 support and $34 resistance right now. The $35 strike where the massive call purchase landed has the LARGEST gamma exposure on the board at 13.0B - this creates a powerful price magnet. If HAL breaks above $34, market makers will need to buy shares to hedge their call exposure, potentially accelerating the move toward $35. The 45,000 new call contracts at $35 will add even more gamma at that level, strengthening the magnet effect.
Notice the setup: The call buyer chose $35 precisely because it sits at the heaviest gamma level. Once the stock clears the $34 gateway, the path to $35 could be quick as dealer hedging kicks in. Smart strike selection.
Net GEX Bias: Bullish (53.7B call gamma vs 29.0B put gamma) - Overall positioning leans bullish, supporting the directional call buyer's thesis.
Implied Move Analysis
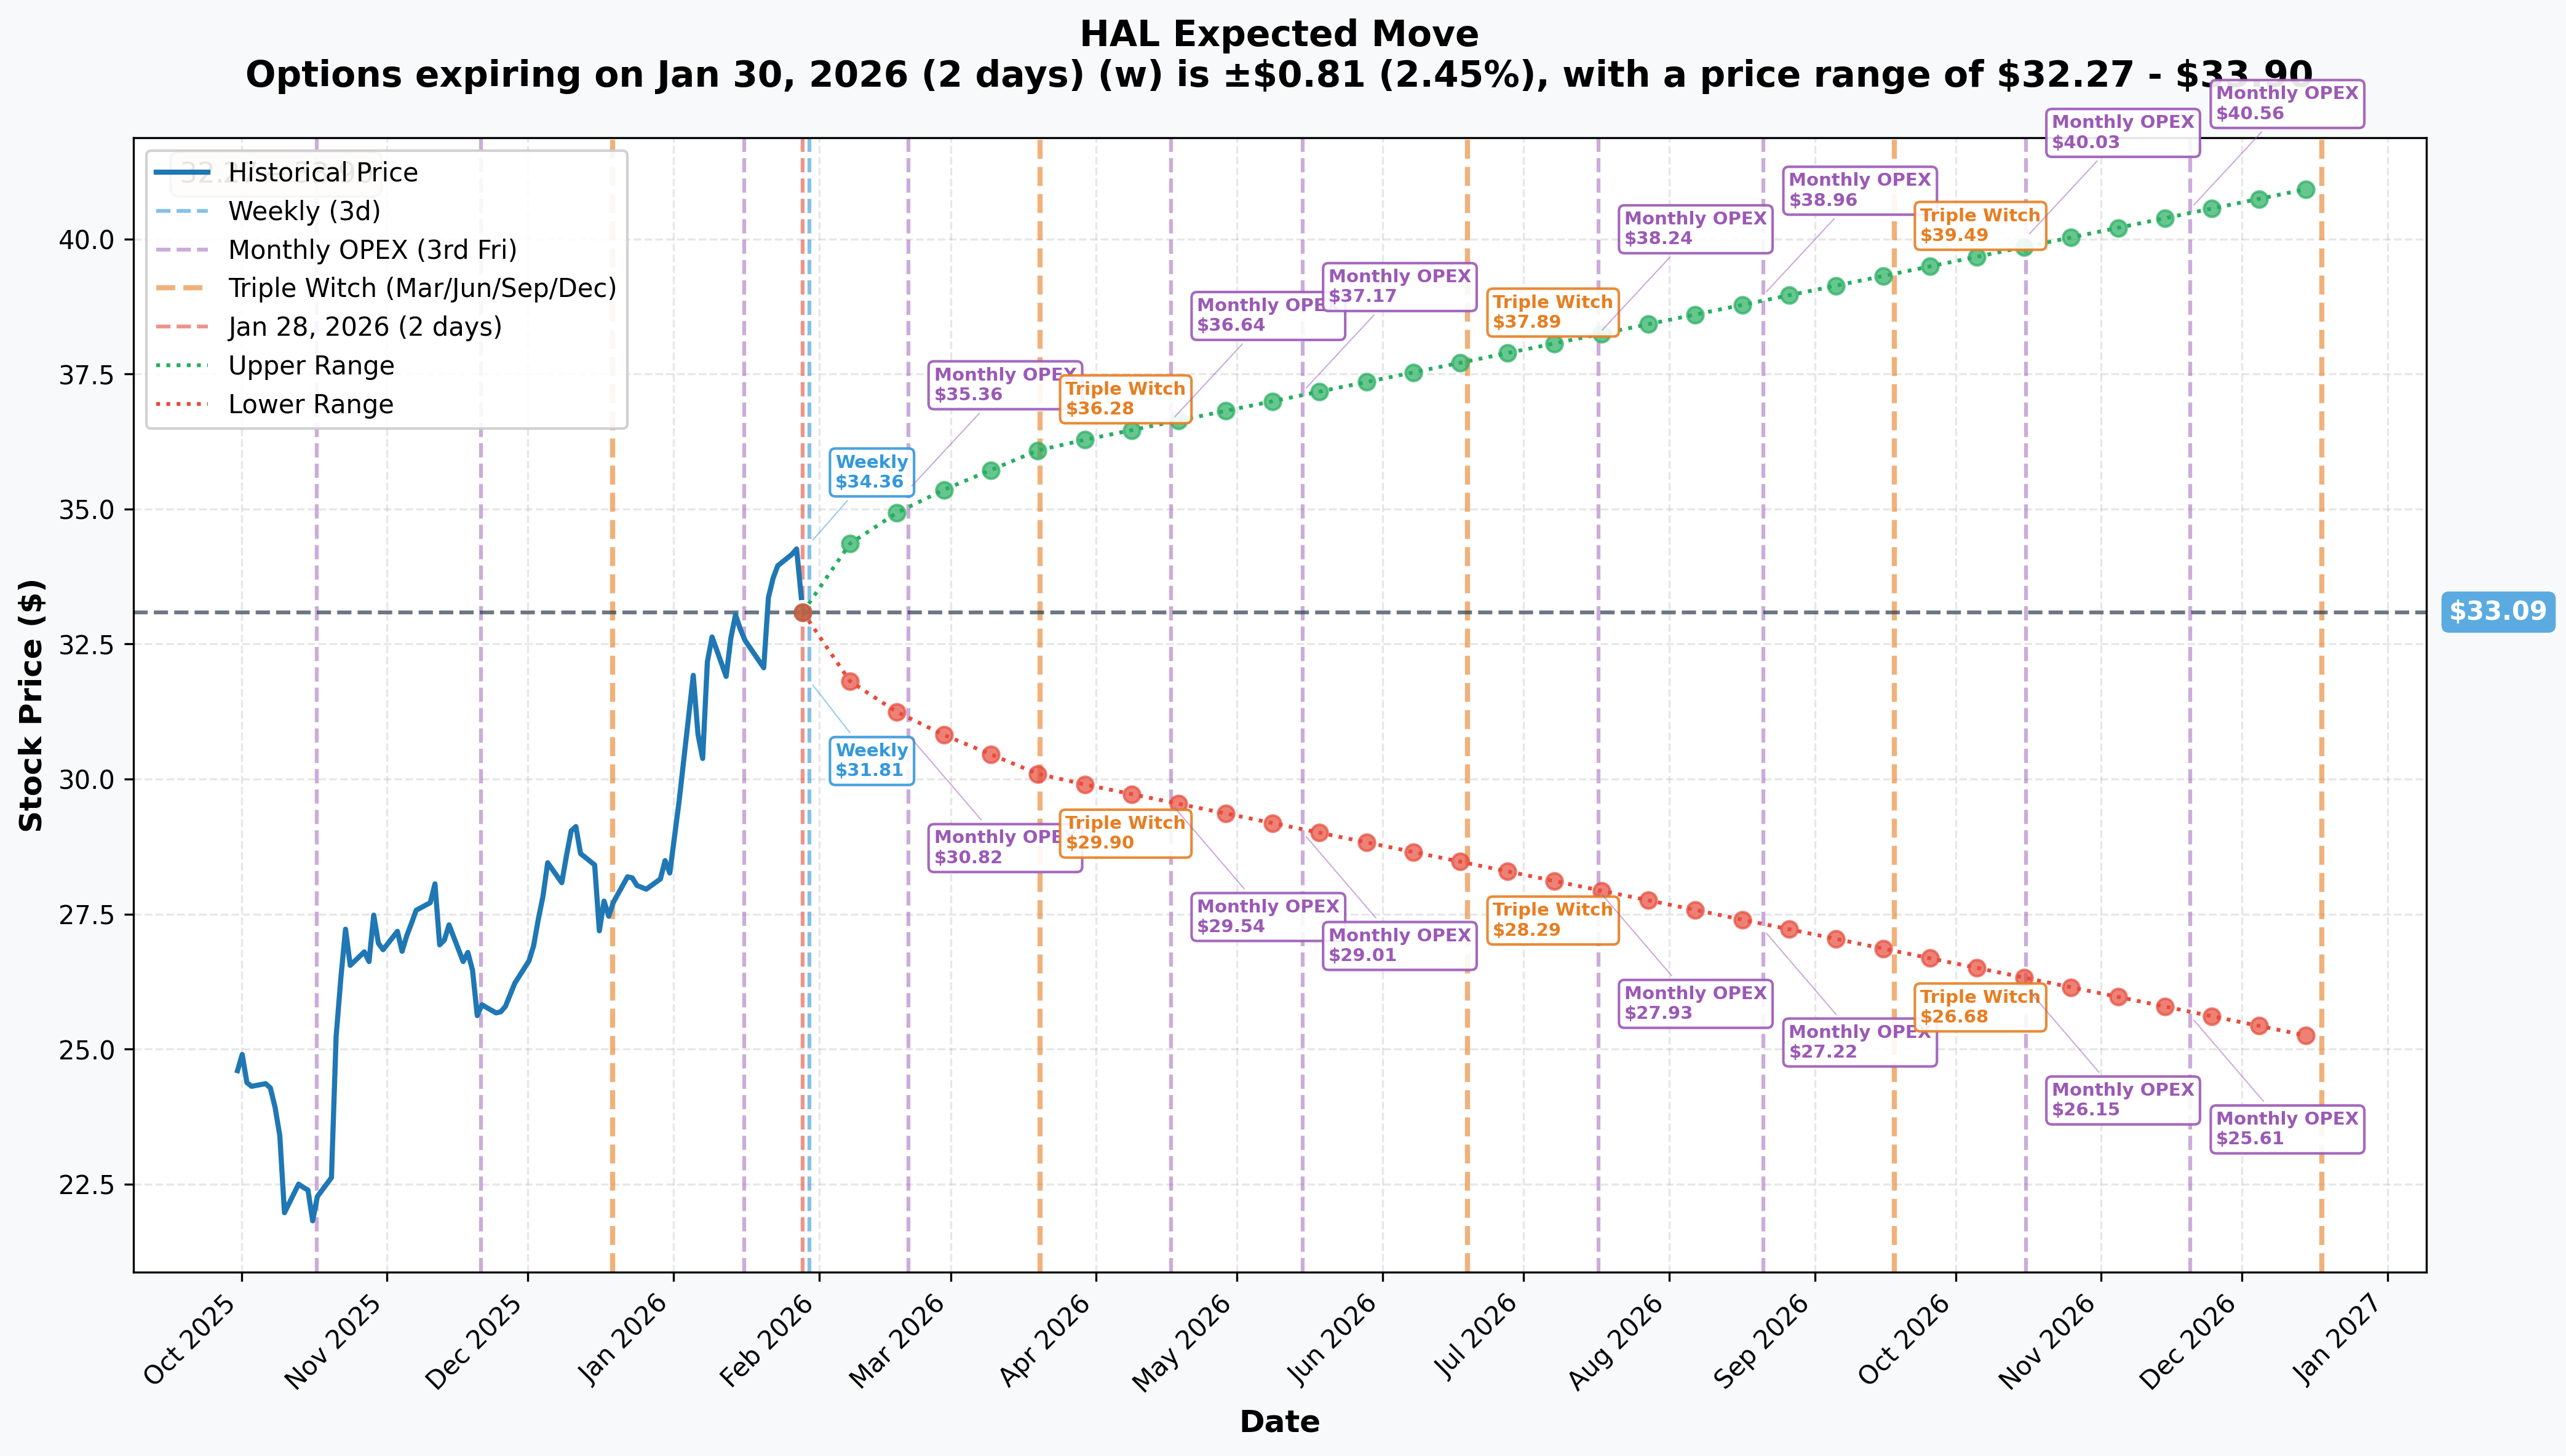
Options market pricing for upcoming expirations:
- 📅 Weekly (Jan 30 - 2 days): ±$0.81 (±2.5%) → Range: $32.27 - $33.90
- 📅 Monthly OPEX (Feb 20 - 23 days): ±$2.01 (±6.1%) → Range: $31.07 - $35.10
- 📅 Quarterly Triple Witch (Mar 20 - 51 days): ±$3.03 (±9.2%) → Range: $30.06 - $36.12
- 📅 September Triple Witch (Sep 18 - THIS TRADE!): Implied range: $26.68 - $39.49
Translation for regular folks: The options market expects HAL to move about 2.5% by Friday and roughly 6% by February OPEX. But looking out to the September expiration where our big trade lives, the market is pricing in a possible range from $26.68 to $39.49 - that's a WIDE ±24% window.
The call buyer's breakeven at ~$38.73 sits comfortably within the upper implied range of $39.49 for September. That means the options market considers this outcome plausible, though certainly not the base case. The buyer needs HAL to rally about 14.6% over 8 months - roughly 2% per month sustained, which is achievable if the fundamental catalysts deliver.
Key insight: The implied move widens dramatically from 6% (monthly) to 24% (September), reflecting significant uncertainty around oil prices, OPEC+ decisions, and Halliburton's transitional year narrative. The call buyer is betting the uncertainty resolves to the upside.
🎪 Catalysts
🔥 Recent Catalysts (Already Happened)
Q4 2025 Earnings Beat - January 21, 2026 (One Week Ago!) 📊
HAL crushed Q4 expectations just seven days ago, and the stock hasn't stopped running since:
- 📊 Revenue: $5.7B (beating consensus by 4.64%) - strong year-end activity
- 💰 Adjusted EPS: $0.69 vs $0.54 consensus (+27.8% beat) - massive upside surprise
- 🏭 Operating margin: 15% adjusted, driven by improved activity mix and elevated completion tool/software sales
- 💵 Cash flow: $1.2B from operations, $875M free cash flow - strong cash generation
- 📈 Shareholder returns: 85% of free cash flow returned; share count at 10-year lows
- 🇻🇪 Venezuela signal: CEO Jeff Miller said Halliburton can "mobilize in weeks" to re-enter Venezuela, sparking a 5.4% rally
Analyst Upgrades Post-Earnings:
- 📈 RBC Capital raised PT to $36 (from $31)
- 📈 Goldman Sachs raised PT to $35 (from $29)
- 📈 Morningstar fair value: $39.00
🚀 Upcoming Catalysts (Next 8 Months - Through September Expiration)
Venezuela Re-Entry - Potential $500M+ Revenue Opportunity 🇻🇪
This could be the biggest catalyst in the pipeline. CEO Jeff Miller stated on the January 21 earnings call that Halliburton is ready to return:
- 🏭 Can "mobilize in weeks" and return "in months" pending U.S. government approval
- 💰 Venezuela was historically ~$500M/year for Halliburton - re-entry could meaningfully boost revenue
- ⚖️ Halliburton filed an ICSID arbitration claim against Venezuela in December for ~$199M in losses
- 🎯 Timeline aligns perfectly with the September expiration - any positive announcement before then could send the stock flying
Q1 2026 Earnings - April 21, 2026 📊
Next earnings report falls right in the middle of our trade's life:
- 📉 Q1 expected to be seasonally weak: C&P revenue down 7-9% sequentially, margins down ~300bps
- 💡 BUT the market already knows this - it's guided. The focus will be on forward commentary
- 🎯 Key items: Venezuela mobilization updates, VoltaGrid progress, cost savings realization, tariff impact
- 📊 If Q1 comes in better than guided-down expectations, the stock could gap higher
VoltaGrid AI Data Center Partnership - Expanding Revenue Streams 🤖
This diversification play gives HAL exposure to the AI infrastructure buildout:
- 🏭 Strategic collaboration to deliver distributed power generation for data centers, initially targeting the Middle East
- ⚡ Secured manufacturing for 400MW of modular natural gas power systems for 2028 delivery
- 🤝 VoltaGrid separately has a $5.0B financing package and 4.3+ GW pipeline, including a 2,300MW deal with Oracle
- 🎯 Unique among the Big 3 oilfield services companies - gives HAL an AI angle that SLB and Baker Hughes don't have
Petrobras Deepwater Contracts - International Growth 🌊
- 🏭 Multiple contracts for vessel stimulation, SmartWell completions, and EcoStar safety valves across Brazil's major deepwater fields
- 📅 Contracts commencing in 2026, supporting the Latin America growth narrative
- 💪 Complements an existing 3-year integrated drilling contract - Halliburton's largest with Petrobras
OPEC+ Production Decisions - H1 2026 🛢️
- ⏸️ Production increases paused through February-March 2026 - any resumption of output could shift oil price dynamics
- 📊 OPEC+ retains 5+ mb/d of spare capacity
- 🎯 Positive surprise: if OPEC+ keeps cuts longer, oil prices stabilize, supporting oilfield services spending
U.S. Offshore Leasing Expansion 🇺🇸
- 🏛️ Interior Department proposed 34 new offshore leases across California, Alaska, and Gulf states
- 📈 If implemented, could support incremental deepwater activity for HAL in 2027+
- 🤝 Aligns with "drill, baby, drill" energy policy under Trump administration
🎲 Price Targets & Probabilities
Using gamma levels, implied move data, and upcoming catalysts, here are the scenarios through the September 18 expiration:
📈 Bull Case (30% probability)
Target: $38-$40
How we get there:
- 🇻🇪 Venezuela re-entry announced with contract terms - adds $500M+ annual revenue visibility
- 💪 Q1 earnings on April 21 beat the guided-down expectations, restoring confidence in the "transitional year" narrative
- ⚡ VoltaGrid partnership announces additional customer wins or accelerated timeline
- 🛢️ Oil prices stabilize above $65 WTI as OPEC+ maintains discipline
- 📊 Cost savings program delivers above the $100M/quarter target
- 📈 Stock breaks above $34.26 (52-week high), triggers technical buying through $35 gamma wall to $37-$40
- 🎯 Morningstar's $39 fair value estimate becomes the target as fundamentals improve
Call P&L in Bull Case:
- Stock at $38: Calls worth $3.00, loss = -$0.73/share (breakeven needs $38.73)
- Stock at $40: Calls worth $5.00, profit = $1.27/share x 45,000 = $5.7M gain (34% ROI)
- Stock at $42: Calls worth $7.00, profit = $3.27/share x 45,000 = $14.7M gain (88% ROI)
Probability assessment: 30% because it requires multiple catalysts to align - Venezuela approval, oil price support, and earnings execution. But the setup is real: strong institutional accumulation, positive analyst revisions, and legitimate growth catalysts.
🎯 Base Case (45% probability)
Target: $33-$37 range (GRADUAL GRIND HIGHER)
Most likely scenario:
- ✅ Q1 earnings come in roughly in line with guided expectations (seasonally weak but manageable)
- 🇻🇪 Venezuela re-entry remains in "mobilization" phase without definitive contract news
- 🛢️ Oil prices trade sideways in $55-65 range, supporting current activity levels
- 📊 Cost savings deliver as planned, protecting margins during the transition year
- 🔄 Stock consolidates between $33 gamma support and $35 gamma resistance for several months
- ⚡ VoltaGrid provides incremental positive narrative but limited near-term revenue impact
- 💤 Gradual grind toward $35-$37 as the market digests Q4 beat and prices in H2 improvement
Call P&L in Base Case:
- Stock at $33: Calls worth ~$1.50-$2.00 (time value), loss = -$1.73 to -$2.23/share
- Stock at $35: Calls worth ~$2.00-$2.50 (at-the-money with time value), loss = -$1.23 to -$1.73/share
- Stock at $37: Calls worth $2.50-$3.00, loss = -$0.73 to -$1.23/share
Why 45% probability: Halliburton's management explicitly framed 2026 as a "transitional year" with North America revenue declining high single digits. The stock is already trading above the $31.55 consensus PT. This limits near-term upside unless major catalysts (Venezuela, oil price rally) materialize. The call buyer likely needs the bull case to profit.
📉 Bear Case (25% probability)
Target: $28-$32 (PULLBACK TO SUPPORT)
What could go wrong:
- 🛢️ Oil prices decline toward the EIA forecast of WTI $51/bbl, crushing oilfield services demand
- 📉 U.S. rig count drops further from current 411 level - at $55 WTI, ~100 rigs could be lost
- 🇻🇪 Venezuela re-entry stalls due to political/legal complications (Senate investigation into Trump-oil company dealings)
- 💸 Tariff impacts escalate beyond the ~$60M/quarter level, compressing margins
- 📊 Q1 earnings worse than guided (seasonal weakness deeper than expected)
- 🏭 Competitors SLB and Baker Hughes win international share at Halliburton's expense
- 📉 Break below $33 gamma support triggers cascade to $31.50, then $30
Call P&L in Bear Case:
- Stock at $30: Calls worth ~$0.50-$1.00 (far OTM with time value), loss = -$2.73 to -$3.23/share
- Stock at $28: Calls worth ~$0.20 (nearly worthless), loss = -$3.53/share x 45,000 = -$15.9M loss (95% loss)
Probability assessment: 25% because oil price weakness and U.S. rig count declines are real risks. However, Halliburton's aggressive cost cutting, strong cash flow, and share buyback program provide a floor. The stock would need both oil price weakness AND catalyst disappointment to trade this low.
💡 Trading Ideas
🛡️ Conservative: Follow the Smart Money into Stock
Play: Buy HAL shares on pullback to $32-$33 range (gamma support zone)
Why this works:
- 📊 Institutional money just dropped $16.8M betting on upside - they've done the homework
- 💰 At ~14x forward P/E, HAL is reasonably valued compared to history (this is NOT a stretched valuation)
- 💵 Strong cash flow generation ($875M FCF in Q4 alone) and aggressive buyback program provide downside support
- 📈 Morningstar $39 fair value implies 15% upside from current levels
- 🎯 Dividend yield ~2% provides income while you wait
- 🛡️ $33 and $32 gamma support provide natural entry points
Action plan:
- 👀 Wait for pullback to $32-$33 area (strong gamma support) rather than chasing at $33.81
- 📊 Set initial position size at 50%, add the other 50% on any dip to $31-$31.50
- 🎯 Price target: $37-$39 over 6-12 months
- 🛑 Stop loss: Below $29.50 (below all major gamma support levels)
- ✅ Hold through Q1 earnings on April 21 - seasonal weakness is already expected and priced in
Risk level: Low-Moderate (stock position with defined stop) | Skill level: Beginner-friendly
⚖️ Balanced: September Call Spread (Defined Risk Bullish)
Play: Buy the September $35 / $40 call spread - same expiration as the institutional trade
Structure: Buy September $35 calls, Sell September $40 calls
Why this works:
- 🤝 Riding the same wave as the $16.8M institutional buyer but with defined risk
- 📊 $5-wide spread caps risk while targeting the same $35-$40 zone
- 💸 Estimated cost: ~$1.50-$2.00 per spread ($150-$200 per spread) - much more affordable
- ⏰ 8 months of runway captures Q1 earnings (April 21), Q2 earnings (July), Venezuela news, and OPEC+ decisions
- 🎯 Max profit at $40+: $3.00-$3.50 per spread (175-230% return on risk)
- 🛡️ Max loss limited to premium paid - you know exactly what you can lose
Estimated P&L:
- 💰 Cost: ~$1.50-$2.00 per spread
- 📈 Max profit: $3.00-$3.50 if HAL above $40 at September expiration
- 📉 Max loss: $1.50-$2.00 (premium paid) if HAL below $35
- 🎯 Breakeven: ~$36.50-$37.00
Position sizing: Risk 3-5% of portfolio maximum. Buy 5-20 spreads depending on account size.
Risk level: Moderate (defined risk, bullish directional) | Skill level: Intermediate
🚀 Aggressive: Copy the Whale - Buy September $35 Calls Outright
Play: Buy September $35 calls outright, same as the institutional trade
Why this could work:
- 🐋 You're literally copying a $16.8M institutional bet - someone with serious conviction and presumably serious research
- ⏰ 8 months is a LONG time for catalysts to develop (Venezuela, VoltaGrid, earnings beats)
- 📈 September implied range goes up to $39.49 - breakeven of $38.73 is within reach
- 💥 If Venezuela re-entry is announced, stock could gap to $37-$40 quickly
- 📊 Gamma squeeze potential: 45,000 new contracts at $35 create massive dealer hedging demand as stock approaches that level
Why this could hurt (REAL RISKS):
- 💸 Premium at risk: $3.73 per contract ($373 per contract) - that's real money
- ⏰ Time decay: Theta will erode value every day, especially in months 5-8 if stock isn't moving
- 📉 Out of the money: Stock needs to rally 3.5% just to reach the strike, and 14.6% to breakeven
- 🛢️ Oil price sensitivity: A drop in WTI to $50s could tank the stock and these calls
- 📊 Already above consensus: Stock at $33.81 vs $31.55 consensus PT means analysts aren't as bullish as this buyer
- ⚠️ Transitional year: Management guided North America revenue down high single digits for 2026
Estimated P&L:
- 💰 Cost: ~$3.73 per contract ($373 per contract, $3,730 per 10 contracts)
- 📈 Profit scenario: Stock at $40 = calls worth ~$5.00, gain of $1.27 (34% ROI)
- 🚀 Home run: Stock at $42 = calls worth ~$7.00, gain of $3.27 (88% ROI)
- 📉 Loss scenario: Stock at $34 = calls worth ~$1.50, loss of -$2.23 (60% loss)
- 💀 Total loss: Stock at $30 = calls nearly worthless, loss of ~$3.50 (94% loss)
CRITICAL WARNING - Only attempt if you:
- ✅ Can afford to lose the entire premium
- ✅ Understand that buying OTM calls has a lower probability of profit than ITM or stock
- ✅ Have a plan to take profits if the stock hits $37-$38 (don't get greedy)
- ✅ Monitor oil price movements and Venezuela headlines regularly
- ✅ Are willing to cut losses if the thesis deteriorates (e.g., oil crashes below $50)
Risk level: HIGH (can lose most/all of premium) | Skill level: Advanced
⚠️ Risk Factors
Keep these potential landmines on your radar:
-
🛢️ Oil price weakness is the #1 risk: EIA forecasts WTI averaging $51/bbl in 2026, which is 21% below 2025 averages. At those levels, U.S. drilling activity would decline sharply - J.P. Morgan estimates ~100 rigs could be lost at $55 WTI. Halliburton's 42% North America revenue concentration makes it especially vulnerable. If oil prices slide toward the low $50s, this call trade likely loses significantly.
-
📉 North America revenue declining in 2026: Management explicitly guided North America revenue down high single digits YoY for full-year 2026, with Q1 particularly weak (C&P revenue -7-9% sequentially). The U.S. rig count at 411 is already down from 750 at the December 2022 peak. This structural headwind is real and well-documented.
-
🇻🇪 Venezuela re-entry is NOT guaranteed: While the CEO signaled readiness, the U.S. Senate has launched an investigation into Trump administration dealings with oil companies regarding Venezuela, which could create political headwinds. Halliburton also has an active $199M arbitration claim against Venezuela. Don't assume this revenue is coming.
-
💸 Tariff headwinds are escalating: Tariff impact was $31M in Q3 and expected ~$60M in Q4, with potential for further increases. Trade war disruptions increase equipment costs 4-40% across the value chain and create demand uncertainty for customers.
-
📊 Stock already above analyst consensus: HAL at $33.81 is above the $31.55 average price target. While some analysts like RBC ($36) and Goldman ($35) see upside, the stock is priced for good news. Limited margin for error at current levels.
-
🏢 Insider selling at highs: Multiple executives sold shares near the 52-week high in January 2026 - EVP Pope sold $3.2M, EVP Slocum sold $772K, EVP Beckwith sold $575K. While these were under pre-arranged 10b5-1 plans, insiders have sold $112M vs just $5.5M in purchases since 2011. The people running the company are taking chips off the table.
-
⚖️ Competitive disadvantage vs peers: Analysts note SLB and Baker Hughes are better positioned for the international/offshore cycle, which is the defining trend of 2026. Baker Hughes also expanded its addressable market via the $13.6B Chart Industries acquisition. Halliburton's heavier U.S. weighting is a structural drag.
-
📉 Q4 pull-forward risk: Q4 2025 completion tool sales were ~3x normal year-end levels, creating a difficult comp and potential demand pull-forward concern. If Q1 2026 comes in worse than even the guided-down expectations, the stock could sell off hard.
-
🌍 OPEC+ oversupply risk: IEA projects 3.8 mb/d oversupply in 2026 with non-OPEC+ production growing from U.S., Brazil, Canada, Guyana, and Argentina. If OPEC+ starts unwinding production cuts in Q2, oil prices could drop sharply, dragging oilfield services spending down with them.
🎯 The Bottom Line
Real talk: Someone just bet $16.8 MILLION that HAL trades meaningfully higher by September. This isn't a hedge or a spread - this is a straight directional call purchase, split into two $8.4M clips within 8 minutes. That's conviction. The timing, one week after a blowout Q4 earnings beat and with Venezuela re-entry looming, suggests the buyer has a thesis around specific catalysts playing out over the next 8 months.
What this trade tells us:
- 🎯 The buyer needs HAL above $38.73 by September to profit - that's a 14.6% move from here
- 💰 They chose September expiration to capture Q1 earnings (April 21), Q2 earnings (July), Venezuela timeline, and OPEC+ decisions
- 📊 The $35 strike lands right at the heaviest gamma level on the board - smart strike selection
- 🐋 Volume of 45,000 contracts vs 1,100 OI (40:1 ratio) confirms this is new institutional positioning, not closing old trades
- ⏰ The two-trade structure (22,500 + 22,500) suggests one large buyer working the order carefully
This IS a bullish signal - but keep it in perspective. The buyer could be a hedge fund with a multi-billion dollar portfolio, for whom $16.8M is a speculative allocation, not a portfolio-defining bet. They can afford to be wrong. Make sure you can too.
If you're bullish on HAL:
- ✅ Consider buying shares on pullbacks to $32-$33 rather than chasing at $33.81
- 📊 The September call spread ($35/$40) is the best risk/reward way to follow this trade without betting the farm
- 🎯 Key breakout level: $34.26 (52-week high) - a clean break above that opens the door to $35 and beyond
- ⏰ Be patient - this is an 8-month trade, not a day trade. Let the catalysts develop.
If you're watching from the sidelines:
- 👀 Monitor Venezuela headlines closely - that's the potential game-changer
- 📅 April 21 Q1 earnings is the next major catalyst. If HAL guides better than expected, that confirms the bull thesis
- 🛢️ Watch WTI crude prices - if oil stays above $60, HAL likely grinds higher. Below $55, all bets are off
- 📊 Look for additional unusual options activity confirming this buyer's thesis
If you're cautious:
- ⚠️ Insider selling at the 52-week high is worth noting - executives know the business better than anyone
- 📉 The "transitional year" narrative with declining North America revenue is real
- 🛢️ Oil price forecasts around $51 WTI would be very negative for oilfield services
- 📊 Stock already above consensus PT of $31.55 - you're paying above what most analysts think it's worth
Mark your calendar - Key dates:
- 📅 January 30 (Friday) - Weekly OPEX (±2.5% implied move window)
- 📅 February 20 - Monthly OPEX (±6.1% implied move)
- 📅 March 20 - Quarterly Triple Witch (±9.2% implied move)
- 📅 April 21 - Q1 2026 earnings report (major catalyst!)
- 📅 July (estimated) - Q2 2026 earnings report
- 📅 September 18 - Expiration of these $35 calls ($16.8M trade)
- 📅 H1-H2 2026 - Potential Venezuela re-entry timeline
Final verdict: HAL has a genuinely interesting setup right now - Q4 earnings momentum, Venezuela optionality, the VoltaGrid AI infrastructure angle, and now a $16.8M institutional call bet. The valuation at ~14x forward P/E is reasonable (unlike some AI stocks at 75x). But the macro headwinds are real: declining U.S. rig counts, oil price weakness forecasts, and management's own admission that 2026 is "transitional." The call buyer is betting the catalysts outweigh the headwinds. If you agree, the September call spread is the smartest way to follow. If you're not sure, there's no shame in waiting for better entry on a pullback to $32-$33.
Patience pays. Let the catalysts develop. And never risk more than you can afford to lose. 💪
Disclaimer: Options trading involves substantial risk of loss and is not suitable for all investors. This analysis is for educational purposes only and not financial advice. Past performance doesn't guarantee future results. The Z-score of 420.45 reflects this specific trade's unusual size relative to recent HAL trading history - it does not imply the trade will be profitable or that you should follow it. Always do your own research and consider consulting a licensed financial advisor before trading. The call buyer may have portfolio context, hedging relationships, or risk tolerance not applicable to retail traders.
About Halliburton Company: Halliburton is North America's largest oilfield services company, providing completion & production and drilling & evaluation services to oil and gas operators worldwide, with a market cap of $28.8 billion in the Oil & Gas Field Services industry. Headquartered in Houston, TX with 48,000 employees.