🛢️ HAL — Institutional Covered Call Writer Pockets $12M on Oilfield Giant!
📅 March 13, 2026 | 🔥 Unusual Activity Detected
🎯 The Quick Take
Someone just collected $12 MILLION in premium by selling 30,000 HAL call contracts at the $37 strike expiring January 2027 — while HAL sits at $34.18, that strike is 8.2% out of the money with 10 months to go. This isn't a bet that HAL rockets higher — this is a massive institution essentially saying "we're fine capping our upside at $37 and pocketing $12M in income right now." With oilfield services facing a soft North America drilling outlook but Iran/Hormuz tension threatening to spike oil prices, this trade is a bold statement about where HAL heads through early 2027.
📊 Company Overview
Halliburton Company (HAL) is North America's largest oilfield services company by market share — the company that actually goes out and drills, fractures, and completes the wells that oil producers need:
- Market Cap: $29.2B (NYSE: HAL)
- Industry: Oil & Gas Field Services (SIC 1389)
- Employees: ~46,000 worldwide
- Current Price: $34.18 (March 13, 2026)
- 52-Week Range: ~$28 – $46+
- P/E Ratio: ~13x (classic cyclical energy valuation)
- Dividend Yield: ~2.0%
- Primary Business: Hydraulic fracturing, completions, directional drilling, drilling fluids — nearly half of revenue comes from completions services alone
Real talk: Halliburton doesn't own oil wells — it's the company oil producers call when they need to get oil out of the ground. When drilling is hot, HAL prints money. When drillers pull back, HAL feels it fast. That's the cycle this trade is betting on right now.
💰 The Option Flow Breakdown
📊 The Tape (March 13, 2026 @ 10:40:59)
| Time | Ticker | Side | Buy/Sell | Type | Expiration | Premium | Strike | Volume | OI | Size | Spot | Option Price |
|---|---|---|---|---|---|---|---|---|---|---|---|---|
| 10:40:59 | HAL | MID | SELL | CALL $37 | 2027-01-15 | $12M | $37 | 30K | 4.3K | 30,000 | $34.18 | $4.11 |
Volume vs. Open Interest: 30,000 contracts traded vs. 4,300 existing open interest — that's 7x the existing OI in a single print. This is brand-new positioning, not someone closing a trade. Someone opened this entire position in one shot at 10:40 in the morning.
🤓 What This Actually Means
This is a Covered Call Write (STO — Sell to Open) — one of the most common institutional income strategies. Here's what's going on under the hood:
- 💸 Premium collected: $4.11 per share × 100 shares per contract × 30,000 contracts = $12.33M upfront cash
- 📍 Strike price: $37 — HAL needs to rally 8.2% from $34.18 before this trade starts costing money
- ⏰ Time horizon: January 15, 2027 — that's 308 days of premium protection
- 🏦 Most likely scenario: A large institution that already owns HAL shares is writing these calls against their position to generate income — classic covered call
- 📊 The bet in plain English: "We own HAL stock. We're willing to sell it at $37 if it gets there. Meanwhile, we collect $12M in cash today and wait."
What's really happening here:
Imagine you own 3 million shares of HAL at an average cost around $32-35. HAL's been bouncing around, oilfield services are soft, and you're sitting on a modest gain. You COULD just hold and hope. OR you could sell someone the RIGHT to buy your shares at $37 — and collect $12M in cash today for doing so.
That's this trade. The seller gets $4.11 per share in income (12% of the $34.18 stock price) over the next 10 months. In exchange, they cap their upside: if HAL surges past $37, they sell there and miss the rally above. But given consensus price targets cluster at $34–$35, this seller is betting that extra $3 of upside isn't worth chasing. Take the $12M and sleep well.
Unusual Score: 🔥 HIGH — 30,000 contracts vs. 4,300 OI is nearly 7x the existing open interest in one trade. This is institutional-scale — your typical retail trader isn't writing $12M covered calls before 11 AM. This happens a handful of times per year on HAL. The size and single-print execution signals a well-capitalized player making a deliberate income play.
📈 Technical Setup / Chart Check-Up
YTD Performance Chart
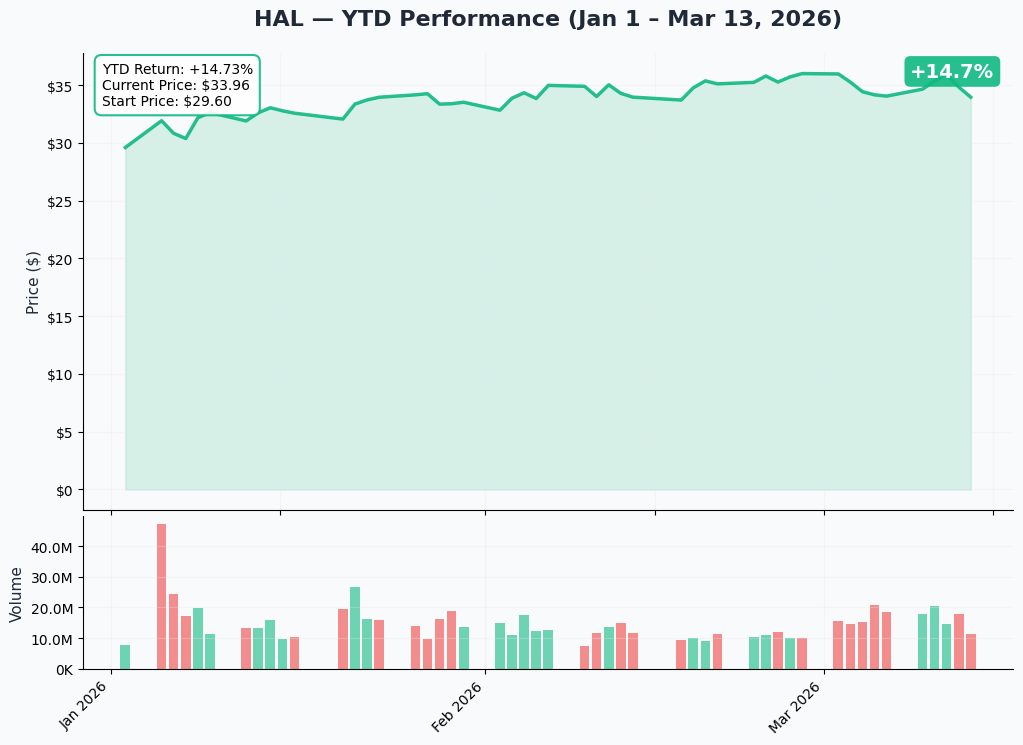
HAL has had a rough ride in 2026 — the stock is trading at $34.18, down considerably from its 52-week high near $46+. The drop reflects the brutal reality: J.P. Morgan's baseline Brent crude forecast of ~$60/bbl for 2026 and management's own Q1 guidance calling for ~6% revenue decline sent the stock toward its lower range. After the Q4 2025 earnings beat in January (revenue $5.7B, EPS $0.69 — a 25% surprise), the stock got a brief bounce but the cautious 2026 guidance quickly took the air out.
Key observations:
- 📉 Significant drawdown from highs: HAL down roughly 25%+ from its 52-week peak, reflecting North America drilling headwinds
- 📊 Stabilizing near support: Current price $34.18 is near the lower end of analyst targets ($28–$35 range), suggesting a floor is forming
- 🛢️ Macro-driven: This isn't a company execution story — HAL is a high-quality operator; it's the oil price and rig count that drives the stock
- 💡 Dividend and buyback floor: HAL returned 85% of free cash flow to shareholders in 2025, limiting downside and providing support near current levels
- 👀 Iran/Hormuz wildcard: Geopolitical tension is the lurking variable — a Strait of Hormuz disruption could spike Brent toward $80–$90 and light HAL up fast
🔵🟠 Gamma-Based Support & Resistance Analysis
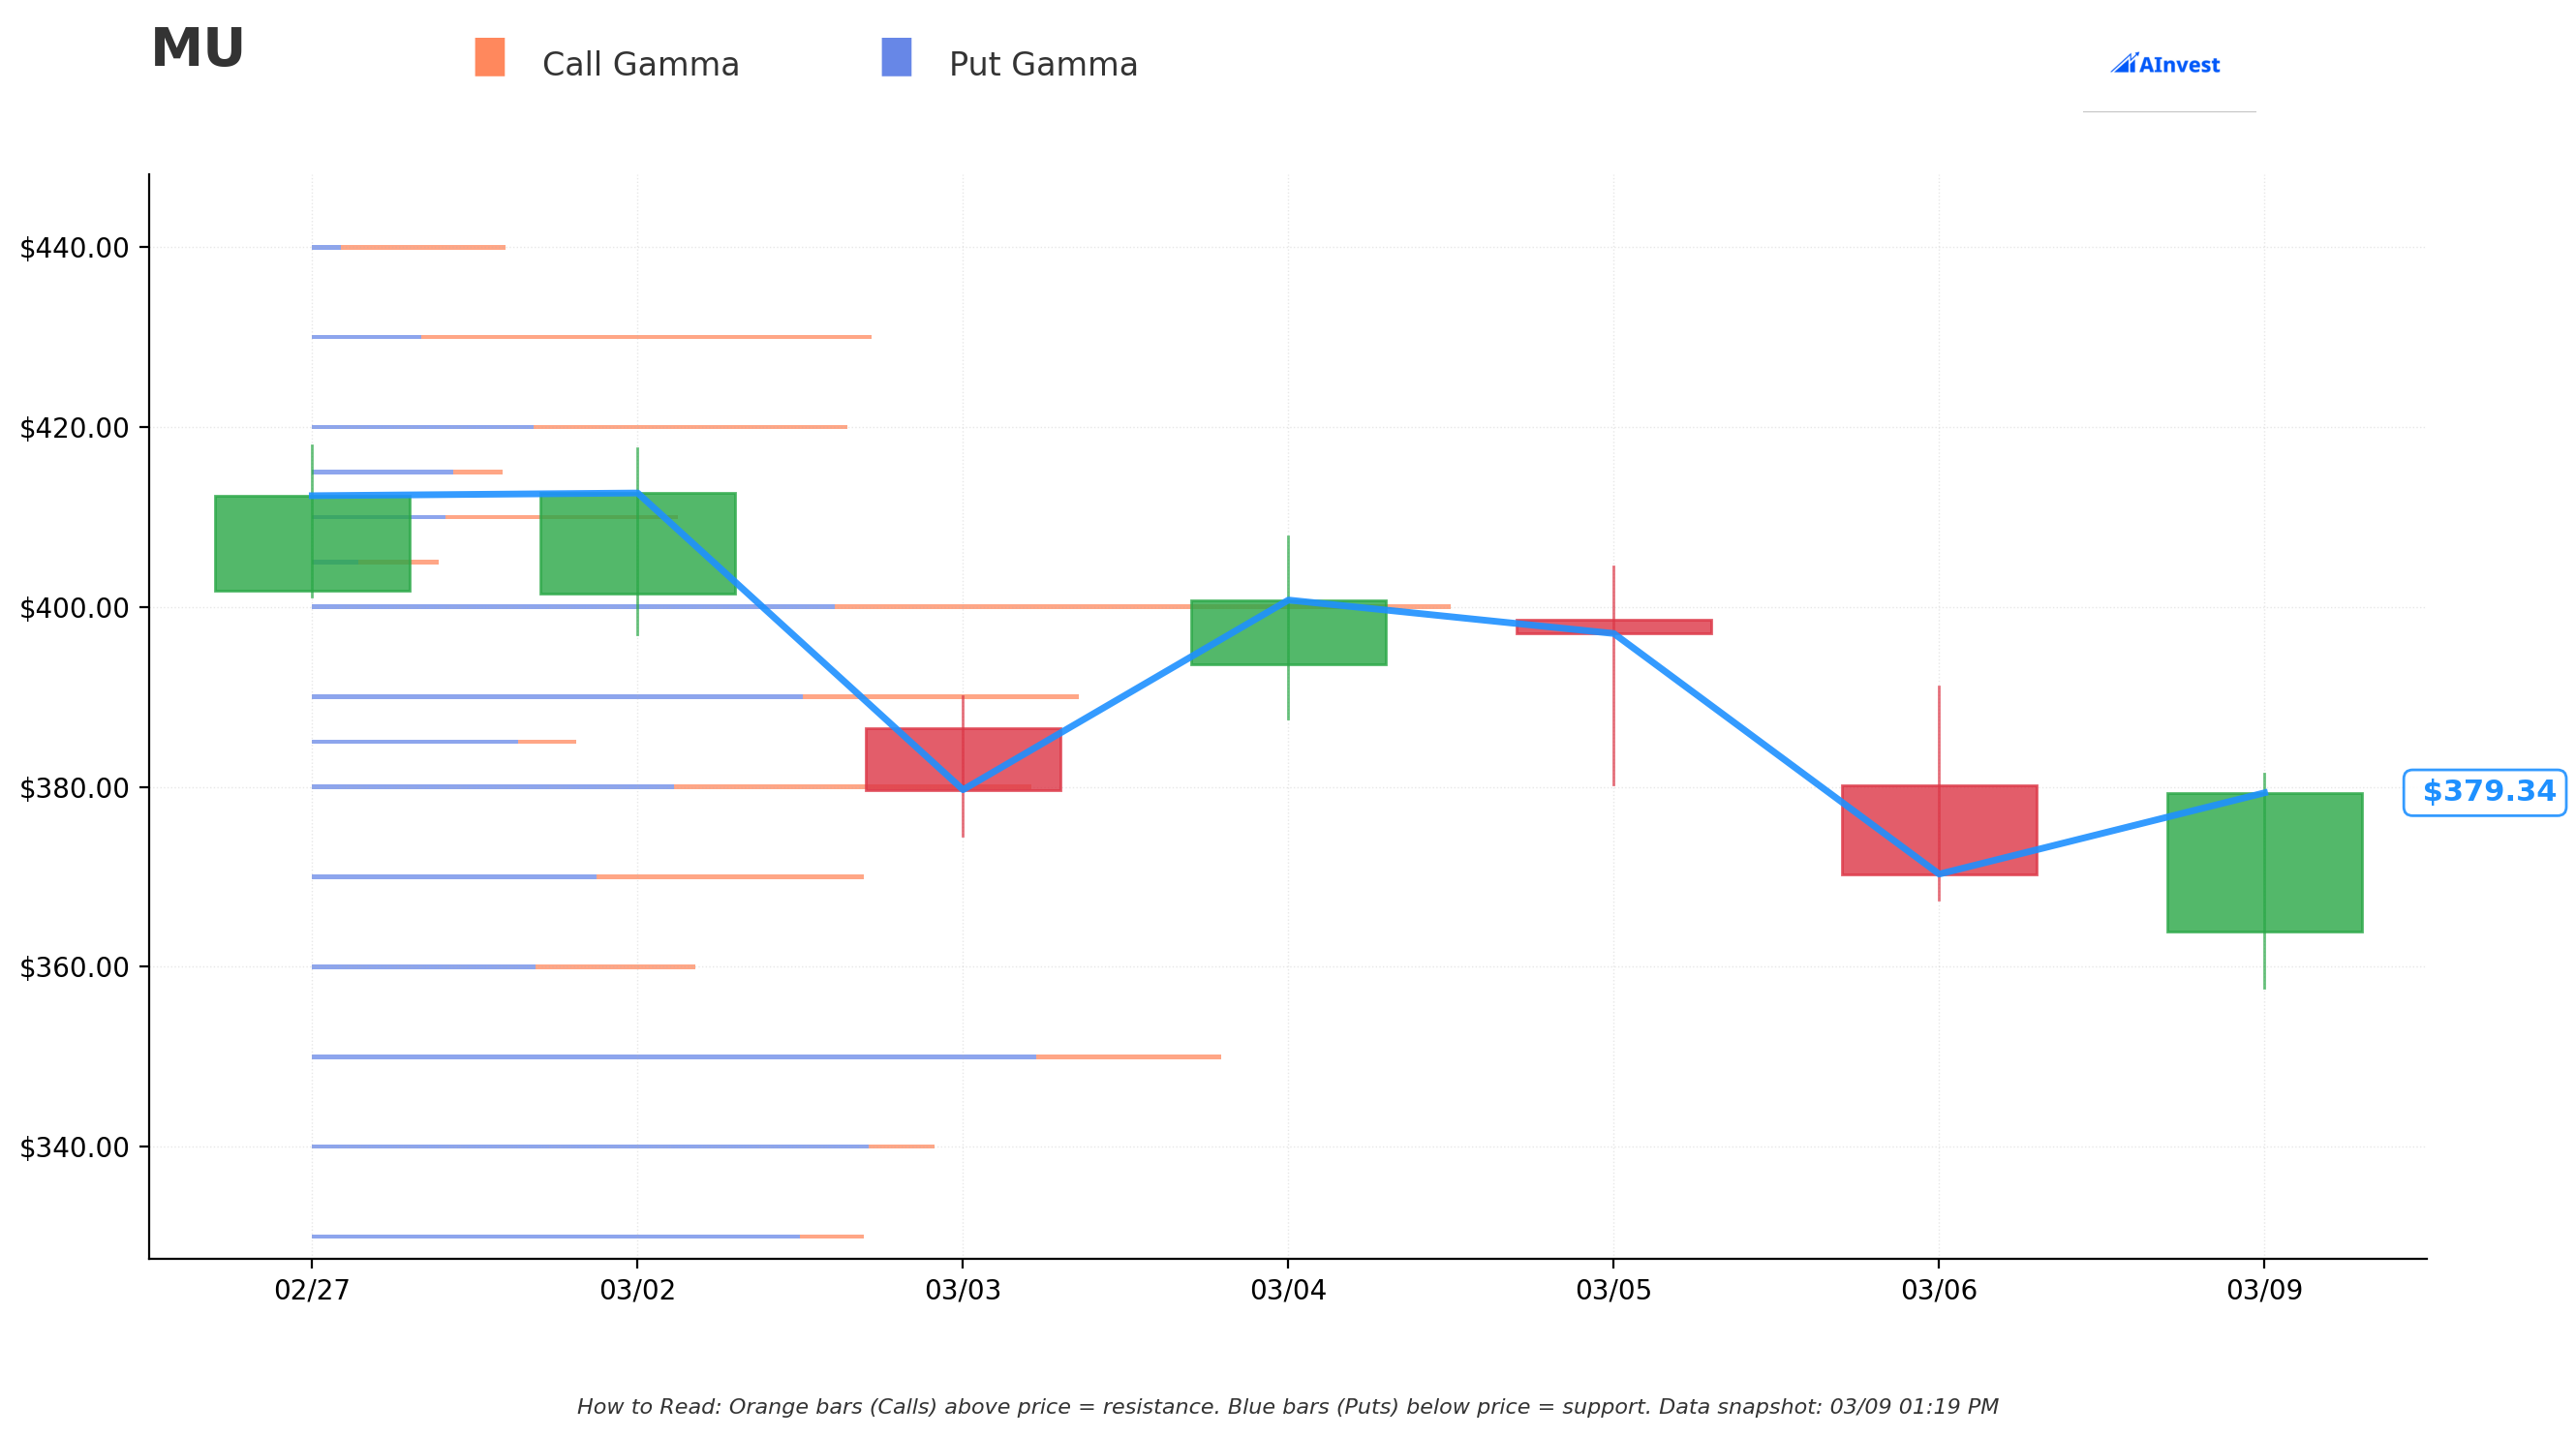
Current Price: $33.89 (as of gamma snapshot)
The gamma exposure map shows where market makers have the heaviest options exposure — these are the levels where price tends to slow down, bounce, or stall:
🔵 Support Levels (Put Gamma Below Current Price):
- $33 — Strongest support nearby, 7.36B total gamma exposure. This is the immediate floor — dealers buying stock to hedge their puts here creates natural demand
- $32 — Secondary support, 5.0B total gamma. About 5.6% below current price; a meaningful backstop if $33 breaks
- $30 — Deeper support, 4.76B total gamma. The last major line of defense — would represent an 11.5% drop from current price
- $31 — Lighter support at 1.88B gamma, providing a modest buffer between $32 and $30
🟠 Resistance Levels (Call Gamma Above Current Price):
- $34 — Immediate overhead resistance (6.69B total gamma). Price is essentially wrestling with this level RIGHT NOW — only 0.3% away
- $35 — STRONGEST RESISTANCE at 21.58B total gamma — the dominant call gamma wall. This is the brick wall bulls need to crack. Market makers will systematically sell into any rally toward $35 to hedge their positions
- $37 — Notable resistance at 4.43B gamma — and this is EXACTLY where the whale sold their calls! Not a coincidence. The smart money chose this strike because there's already meaningful call gamma resistance here, making it harder for HAL to push through
- $36 — Secondary resistance at 3.31B gamma
- $38 — Further resistance at 3.74B gamma
- $40 — Extended resistance at 3.91B gamma
Net GEX Bias: Bullish (52.8B call gamma vs. 27.1B put gamma) — The overall positioning leans bullish, meaning market maker hedging dynamics provide a soft tailwind for the stock. But that massive $35 call gamma wall is a real ceiling in the near term.
What this means for traders: HAL is pinned in a tight range. The $34–$35 zone is a gauntlet of call gamma resistance, while $33 offers solid support below. The covered call seller picked $37 wisely — not only is it 8.2% OTM, it sits above multiple layers of gamma resistance that make reaching that level genuinely difficult over the next 10 months in a soft oil environment.
Implied Move Analysis
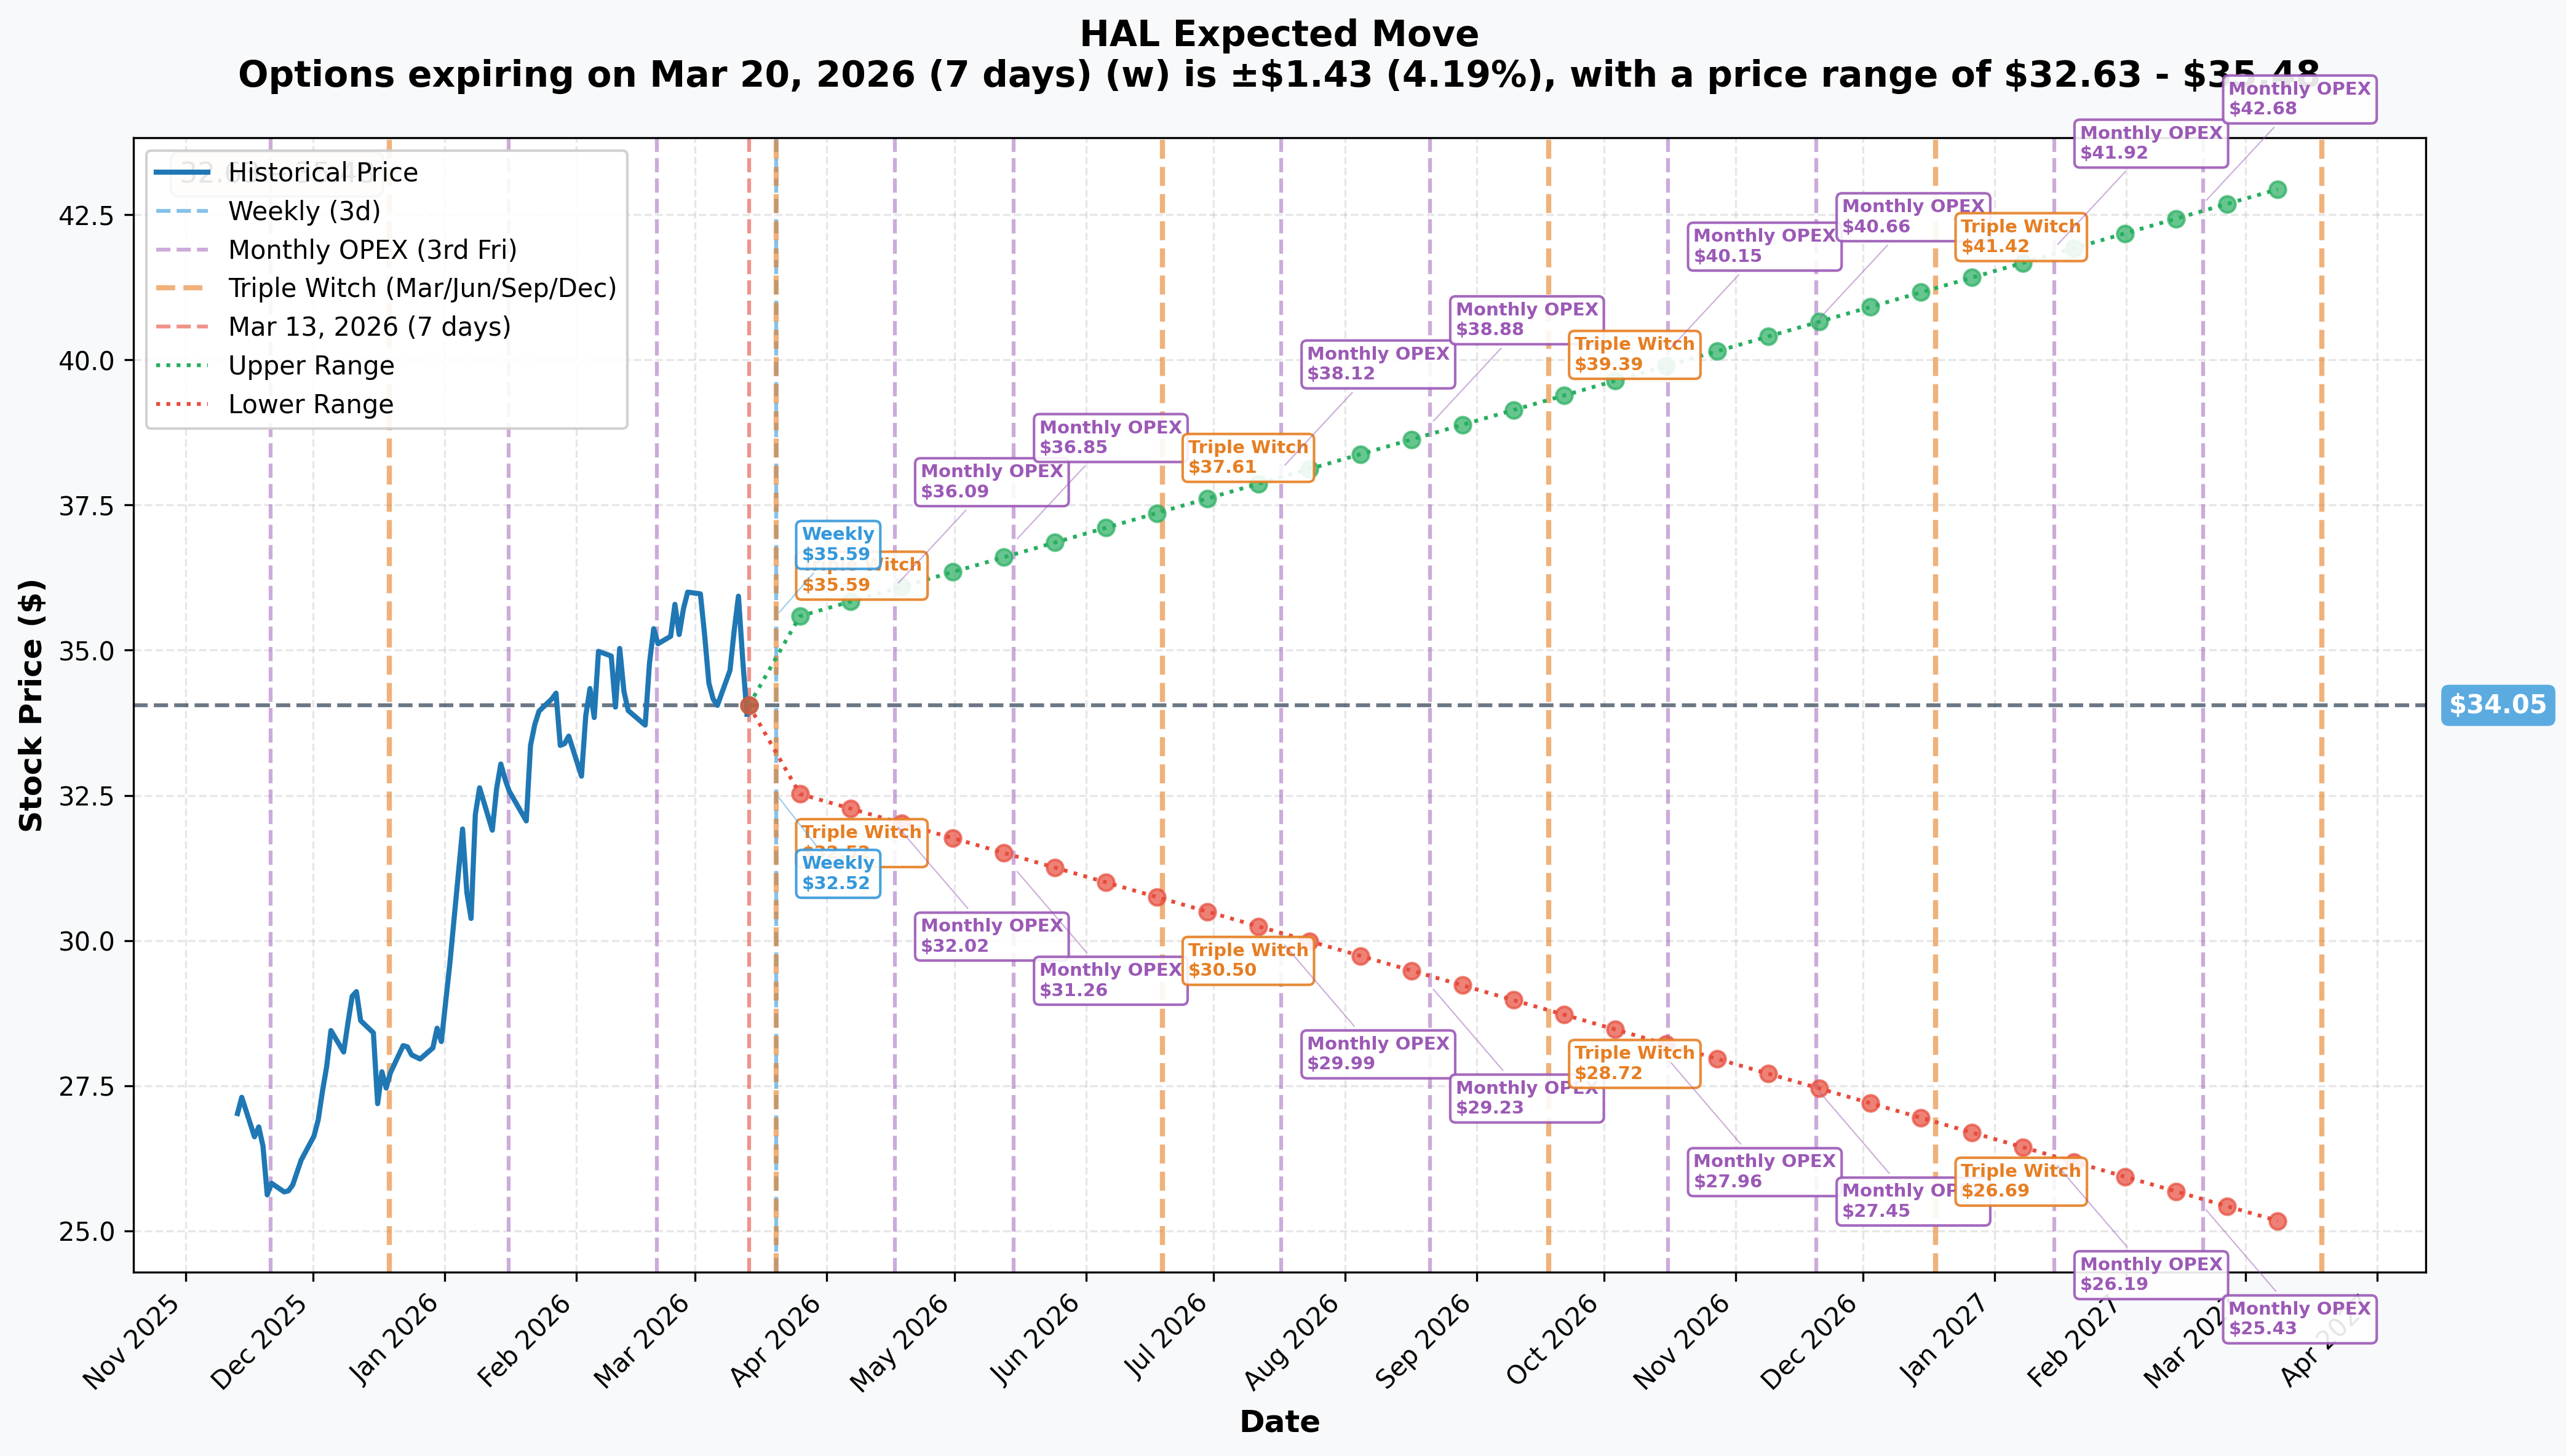
Options market pricing for upcoming expirations:
| Expiration | Type | Days Out | Implied Move | Upper Range | Lower Range |
|---|---|---|---|---|---|
| 2026-03-20 | Triple Witch / Weekly | 7 days | ±4.19% (±$1.43) | $35.48 | $32.63 |
| 2026-04-17 | Monthly OPEX | ~35 days | ~±$2.09 | $36.09 | $32.02 |
| 2026-06-19 | Triple Witch | ~98 days | ~±$3.56 | $37.61 | $30.50 |
| 2026-10-16 | Monthly OPEX | ~217 days | ~±$6.19 | $40.15 | $27.96 |
| 2027-01-15 | Monthly OPEX (THIS TRADE!) | 308 days | ±26.77% (±$9.12) | $41.92 | $26.19 |
Translation for regular folks:
For THIS WEEK alone, options are pricing a ±$1.43 move (±4.19%) — so HAL could land anywhere from $32.63 to $35.48 by Friday March 20. That upper end barely grazes the first real resistance zone.
For the January 2027 expiration (where the covered call lives), the implied move is a massive ±$9.12 from today's price, giving a range of $26.19 to $41.92. The $37 strike sits comfortably INSIDE the upper end of that 1-year implied range — which is exactly what the call seller is counting on. They're selling at a level the options market says has a meaningful but not dominant probability of being reached.
Key insight: The $37 strike is right around where the June 2026 Triple Witch upper range ($37.61) starts. Essentially, the options market is saying HAL would need to be running on all cylinders — a strong oil price move AND fundamental improvement — to get there. The covered call seller likes those odds.
🎪 Catalysts
✅ Recent Catalysts (Already Happened)
Q4 2025 Earnings Beat — January 21, 2026
HAL delivered a genuine earnings surprise to kick off 2026:
- Revenue of $5.7B, up from $5.6B in Q3 2025
- Adjusted EPS of $0.69 vs. street estimate of $0.55 — a 25.4% surprise beat
- Full-year 2025 revenue of $22.2B (vs. $22.9B in 2024) — modest YoY decline reflecting soft market
- 85% of free cash flow returned to shareholders via buybacks and dividends
- Full Q4 2025 earnings call transcript via Motley Fool
The beat helped the stock bounce in late January, but management poured cold water on the rally with a sobering Q1 2026 outlook.
Q1 2026 Warning Issued — January 2026
Management gave the market exactly what it didn't want to hear:
- Q1 2026 revenue expected down ~6% QoQ and EBITDA down ~14% QoQ
- North America activity expected to fall high single digits in 2026 overall
- Both Completions & Production and Drilling & Evaluation segments face headwinds
- Halliburton investor relations page details the full guidance
One-Time $757M Loss — Q4 2025
Halliburton took a $757M one-off charge related to asset write-downs and restructuring — which tested investor patience even though management framed 2026 as a rebalancing year.
Oil Price Pressure — J.P. Morgan Bearish Call
J.P. Morgan's baseline forecast of Brent at ~$60/bbl for 2026 landed like a wet blanket on the entire oilfield services sector. The IEA's March 2026 oil market report echoed persistent global supply surplus concerns. This macro backdrop is the primary reason HAL is down from its highs and why the covered call seller feels comfortable selling the $37 strike for $12M.
🔥 Upcoming Catalysts (Next 6 Months)
Q1 2026 Earnings — Expected Mid-April 2026 📊
This is THE immediate make-or-break event. The street has already lowered the bar significantly after the Q1 guidance cut, so the question is whether HAL beats a low bar or misses it entirely:
- Consensus EPS for 2026 is $2.25 full year, implying roughly $0.50/quarter
- North America expected down high single digits; international expected flat-to-modestly up
- Any upside surprise on margins or international demand would be a bullish spark
- A miss deepens the bear case and validates the covered call seller's thesis
Iran / Strait of Hormuz Geopolitical Risk — Ongoing 🛢️
This is the X-factor that could blow up the covered call. If the U.S.-Iran standoff intensifies:
- HSBC raised their 2026 Brent forecast to $80/bbl, Standard Chartered to $70/bbl on Hormuz concerns
- A sustained Brent price above $75–$80 would trigger E&P capex increases in North America
- HAL is a direct beneficiary — more drilling = more completions work = more revenue
- This is the scenario where HAL pushes toward $37+, and the covered call seller's upside gets capped
OPEC+ Production Decisions — Q2/Q3 2026 🌍
OPEC+ production decisions are the other key oil price driver:
- Any supply cuts by OPEC+ that push Brent sustainably above $70 rerates energy stocks higher
- Conversely, any surprise production increase floods the market and keeps oil suppressed — bad for HAL
- Goldman Sachs and others are tracking this closely; TheStreet summarizes the 2026 oil price reset thesis
North America Rig Count Recovery — Ongoing Leading Indicator 📈
The Baker Hughes North America rig count is the most direct real-time signal for HAL revenues:
- Current expectations embed weakness
- Any WTI price recovery above $70 would likely trigger a rig count bounce within 1-2 quarters
- A meaningful rig count recovery would be a positive surprise that could push HAL toward the $37 strike
International Business Expansion — Ongoing 🌐
HAL's international pivot is the company's growth story:
- Latin America, Africa, and the Middle East are growing faster than North America
- International revenue expected flat to modestly up in 2026 — a stabilizing offset
- If international beats expectations, HAL could re-rate above $37 even without a North America recovery
- Technology and digital solutions (iEnergy platform) provide a revenue stream less tied to commodity prices
Free Cash Flow & Capital Returns — Full Year 2026 💰
Halliburton projected $1.8B in free cash flow for 2026, +6% YoY:
- Company targets 85% of FCF returned to shareholders (buybacks + dividends)
- This provides a meaningful floor on the stock even if revenues disappoint
- Accelerated buybacks at current prices would be a positive catalyst
- The ~2% dividend yield adds to total return while holders wait for oil to recover
🎲 Price Targets & Probabilities
Using the gamma levels, implied move data, analyst consensus, and catalyst setup, here are the scenarios through January 2027:
📈 Bull Case (20% probability)
Target: $37–$42
How we get there:
- 🛢️ Iran/Hormuz disruption spikes Brent above $80 sustained — U.S. E&P capex surges
- 📊 Rig count jumps meaningfully by Q3 2026, HAL North America revenues inflect positive
- 🌐 International business beats expectations, management upgrades 2026 guidance
- 💪 Q1 2026 earnings beat the already-low bar, showing margin resilience
- 📈 HAL breaks through $35 gamma wall, momentum carries toward $37 and beyond
- ⚠️ If this plays out, the covered call seller has their upside capped at $37 — they miss the rally above that but still keep the $4.11 premium collected
Implied move context: The January 2027 upper range from implied move data is $41.92 — so the options market says this scenario is possible but priced as a tail event.
🎯 Base Case (55% probability)
Target: $32–$36 (range-bound, with $34–$35 as magnet)
Most likely scenario:
- ✅ Q1 2026 results roughly in-line with already-lowered guidance — no major surprise either way
- 📊 Oil prices stay in the $60–$70 WTI range — low enough to keep North America activity subdued, not low enough to cause a crisis
- 🌐 International business provides modest positive offset to North America weakness
- 🔄 HAL grinds sideways between $33 support and $35 gamma wall, with occasional spikes and dips
- 💰 Dividend support and buybacks provide a floor around $32–$33
- ⏰ Covered call seller collects the $12M in full — the $37 strike expires worthless in January 2027
Why 55%: Analyst consensus price targets cluster at $34.25–$35.29 — essentially where the stock is RIGHT NOW. The fundamental setup (soft NA, steady international, oil prices range-bound) screams sideways action. The $35 gamma wall reinforces the ceiling. The covered call seller is betting EXACTLY on this scenario.
📉 Bear Case (25% probability)
Target: $26–$32
What could go wrong:
- 😰 Q1 2026 earnings miss — revenues fall MORE than guided 6%, margin compression accelerates
- 🛢️ OPEC+ floods supply, Brent drops to $55 range — North America E&P spending freezes
- 📉 Rig count decline accelerates, HAL issues second guidance cut in 2026
- 🌍 International momentum stalls, removing the one bright spot in the story
- 💸 Covered call seller keeps all $12M premium — but their stock position loses ground
- 📊 Break below $33 gamma support triggers flush toward $30–$31 zone
Implied move context: January 2027 lower range from implied data is $26.19 — so the bear case is well within the options market's expected range.
💡 Trading Ideas
🛡️ Conservative: Ride the Income Wave (The "Copy the Whale" Play)
The idea: If you already own HAL shares (or want to own them), consider writing covered calls just like this institutional trader did.
Structure: Own 100 shares of HAL at ~$34, sell the $37 call expiring January 2027
Why this works:
- 💰 You collect roughly $4.11 per share upfront — that's a 12% cash yield in 10 months on top of the ~2% dividend
- 🛡️ Your breakeven on the downside drops to ~$30 after collecting premium ($34.18 - $4.11)
- 📊 You keep the stock plus premium if HAL stays below $37 — which the $35 gamma wall suggests is likely
- 🎯 If HAL rallies to $37, you sell there for a gain PLUS keep the $4.11 — total return from today: ~$6.93/share (+20.3%)
- ✅ This is the same bet the $12M institutional trade is making, scaled down to your size
Estimated P&L:
- HAL stays below $37 at Jan 2027 expiration: Keep full $4.11 premium ✅
- HAL at $37: Sell shares at $37 + keep $4.11 = $7.11 per share profit from $34.18 cost (+20.8% total) ✅
- HAL falls to $30: Stock loss of $4.18, offset by $4.11 premium = net loss only $0.07 (near breakeven) 🛡️
- HAL falls below $30: You're losing money on the stock position
Risk level: Moderate (capped upside, cushioned downside) | Skill level: Intermediate Best for: Long-term investors or premium collectors who are fine owning HAL at current levels
⚖️ Balanced: Bull Call Spread (Betting Iran Spikes Oil)
The idea: Position for a geopolitical oil spike that sends HAL toward $37 without paying through the nose for it.
Structure: Buy the $35 call / Sell the $37 call — April or June 2026 expiration
Why this works:
- 🛢️ If Iran/Hormuz escalates and Brent hits $80+, HAL could reach $36–$38 within 1-2 months
- 📊 You're buying the $35 call (at or near the biggest resistance level) and selling the $37 call (where the whale sold theirs) — limiting your cost
- 🎯 Max profit if HAL is at or above $37 at expiration
- 💰 Net cost is much lower than buying a naked call — typically $0.60–$0.90 for this spread
- 🎢 Defined risk — you know your maximum loss going in
Estimated P&L (rough estimate — verify real-time quotes):
- Cost: ~$0.60–$0.80 per spread (so $60–$80 per contract)
- Max profit: $2.00 - cost = ~$1.20–$1.40 if HAL above $37 at expiry (~150-175% return)
- Max loss: $60–$80 per spread if HAL stays below $35 (100% loss of premium paid)
- Breakeven: ~$35.70–$35.80
Entry timing: Consider entering on any oil price spike or Iran headline that pushes HAL up toward $35 — use the momentum as confirmation
Risk level: Moderate (defined risk, directional) | Skill level: Intermediate Best for: Swing traders who want leveraged exposure to an oil price spike with limited downside
🚀 Aggressive: Long Call Spread for Iran Spike (YOLO Version)
The idea: Short-dated bet that the Hormuz tension boils over and HAL gaps higher in the next 30–60 days.
Structure: Buy the $35 call / Sell the $38 call — April 17, 2026 expiration
Why this could work:
- 💥 Oil geopolitical events move FAST — a single Hormuz incident can spike Brent $10+ overnight
- 📈 HAL has high beta to oil prices; a 10% oil spike could push HAL 15%+ from current levels
- 📊 April OPEX upper range is $36.09 from the implied move data — one oil spike and you're in profit territory
- 🎯 Selling the $38 call caps your max gain but dramatically reduces your entry cost
- ⏰ 35 days is enough time to catch a geopolitical spike without paying for long-dated theta
Estimated P&L (rough estimate — verify real-time quotes):
- Net cost: ~$0.30–$0.50 for the $35/$38 spread
- Max profit: $3.00 - cost if HAL above $38 at April expiry = 500–900% return
- Max loss: 100% of premium paid (small in dollar terms, total in percentage terms)
- Breakeven: ~$35.35–$35.50
CRITICAL WARNING — DO NOT attempt unless you:
- ✅ Accept that this is a pure directional bet on geopolitics — not fundamental analysis
- ✅ Can afford to lose 100% of the premium (high probability of this happening!)
- ✅ Have a clear exit plan: Take profits quickly if HAL spikes, don't wait for expiration
- ✅ Keep position size to 1-2% of your portfolio maximum
- ⚠️ The April upper implied range is only $36.09 — you need HAL to EXCEED that range to reach max profit
Risk level: HIGH (likely 70%+ chance of losing the full premium) | Skill level: Advanced Best for: YOLO traders with a strong conviction on near-term Iran/Hormuz escalation
⚠️ Risk Factors
Here's what could go sideways — be honest with yourself about these:
-
🛢️ Oil price is the entire story: At 13x P/E with ~2% dividend yield, HAL's stock performance is almost entirely driven by WTI/Brent prices and the North America rig count. J.P. Morgan's $60/bbl base case for 2026 is the primary headwind — if they're right, HAL stays range-bound or worse. The IEA March 2026 report notes persistent global supply surplus concerns.
-
📉 Q1 2026 earnings could be ugly: Management guided for ~6% revenue decline and ~14% EBITDA decline in Q1 2026. The question is whether reality comes in better or worse than this already-lowered bar. If results are worse — or if management guides Q2 even lower — HAL could retest $30–$31 support levels.
-
🌍 North America structural headwind: Management explicitly guided North America activity "down high single digits" for full-year 2026. This is a slow bleed, not a crisis, but it puts consistent pressure on the largest segment of the business. U.S. shale producers are showing more capital discipline in 2026, which means fewer wells to complete and drill.
-
💰 Covered call seller caps your upside: For HAL stock holders, this $12M covered call print is a reminder that the biggest players on the street are selling the $37 rallies. If the whale with 3 million shares is willing to cap at $37, that creates meaningful overhead supply — market makers who bought those calls will hedge by shorting stock near $37, creating mechanical resistance.
-
🌐 Iran risk cuts both ways: Yes, a Hormuz disruption benefits HAL via higher oil prices. But sustained Middle East tension also creates uncertainty around HAL's international operations in the region. The company has significant Middle East exposure — geopolitical escalation is not a clean win for HAL.
-
📊 $35 gamma wall is a genuine ceiling: The 21.58B call gamma at $35 is the dominant options market feature for HAL right now. Market makers are short $35 calls and will sell stock as HAL approaches that level to hedge — creating systematic selling pressure. Breaking through this level requires sustained fundamental improvement, not just noise.
-
🎢 Cyclical nature means fast reversals: HAL can move 10–20% in a week if oil prices gap. The ±4.19% weekly implied move is the market's best estimate of short-term volatility — but oil geopolitics can blow through that easily. Both the upside AND downside scenarios can materialize quickly.
-
💸 $757M one-time charge hangover: While management framed the Q4 2025 write-down as a one-time item, the underlying assets being written down reflect a more cautious view of North America activity. This charge erodes trust and could weigh on sentiment through mid-2026.
🎯 The Bottom Line
Real talk: Someone just collected $12 MILLION by selling 30,000 HAL call options at $37 — 8.2% above where the stock is trading today. This isn't a complicated trade. This is a large institution that owns HAL shares saying: "The next 10 months are going to be choppy. Give me the $12M income now. If HAL manages to get to $37, I'm happy to sell there. If it doesn't, I just made 12% on my shares in cash."
What this trade is telling us:
- 🎯 The seller sees limited upside for HAL above $37 through January 2027 — analyst consensus at $34–$35 backs this view
- 💰 They're confident enough in the $37 level that they're willing to cap any rally there for 10 months
- 📊 The timing (mid-March 2026, post-Q1 guidance cut, soft oil backdrop) suggests the seller sees 2026 as a "wait and see" year for oilfield services
- 🛢️ The Iran/Hormuz wildcard is the only real risk to this trade — and even then, HAL needs to gain 8.2% + before the option costs the seller anything
If you're interested in HAL:
- ✅ Current levels around $33–$34 look like reasonable entry territory — you're near the bottom of the 52-week range with strong support at $33 and a 2% dividend providing income while you wait
- 📊 Consider the covered call strategy — at $34.18 with a $37 call generating $4.11, your effective cost basis drops to $30 and you collect 12% cash yield in 10 months
- ⏰ Mark mid-April 2026 for Q1 earnings — that's the next critical data point. If HAL beats the already-lowered bar, it could close the gap to $35–$36
- 🛢️ Watch WTI oil prices daily — if WTI breaks above $72–$75 and holds, HAL's entire fundamental picture changes for the better
If you're watching from the sidelines:
- 👀 The $33 gamma support is your line in the sand — if HAL holds above $33 through Q1 earnings, the floor is sturdy
- 🎯 A Q1 earnings disappointment that pushes HAL toward $30–$31 would be a much better entry point for longer-term holders
- 🚀 The Hormuz/Iran angle is a real asymmetric trade — if oil spikes hard, HAL is one of the fastest moving beneficiaries in the S&P 500
If you're bearish on HAL:
- 📉 The covered call seller chose the RIGHT strike — $37 is where the biggest call gamma sits and where every analyst upgrade starts to matter. Fighting above $37 without an oil price catalyst is swimming upstream
- 🎯 Break below $33 support is your signal — that opens a clear path toward $30–$31 (11–12% downside)
- ⚠️ Don't short into a 13x P/E cyclical with buybacks and a 2% dividend — the support is stickier than it looks
Mark your calendar — Key dates:
- 📅 March 20, 2026 — Weekly and Triple Witch OPEX (±$1.43 implied move, range $32.63–$35.48)
- 📅 Mid-April 2026 — Q1 2026 earnings (THE big near-term catalyst)
- 📅 April 17, 2026 — Monthly OPEX (upper range $36.09, lower $32.02)
- 📅 June 19, 2026 — Quarterly Triple Witch (upper range $37.61 — approaching the $37 strike!)
- 📅 Q2/Q3 2026 — OPEC+ production decisions, major oil price determinant
- 📅 January 15, 2027 — This $12M covered call expires
Final verdict: The covered call seller is making a smart, conservative bet on a difficult year for oilfield services. They're getting PAID $12M to be patient. For retail traders, HAL at $33–$34 with strong gamma support and a 2% dividend is a reasonable income position if you write covered calls against it — but don't expect fireworks unless Iran or OPEC gives you a gift. This is an oil price story, not a stock picker's story.
Be realistic. Collect the premium. Let the oil market come to you. 💪
Disclaimer: Options trading involves substantial risk of loss and is not suitable for all investors. This analysis is for educational and informational purposes only and does not constitute financial advice. Past performance does not guarantee future results. The unusual option activity described reflects a single institutional trade and may not predict future price movements. All price targets, probabilities, and implied move calculations are estimates based on available market data and are subject to change. Energy sector stocks are particularly sensitive to commodity price fluctuations, geopolitical events, and macroeconomic factors outside any analyst's ability to predict. Always do your own research and consult a licensed financial advisor before making any investment or trading decisions. Never risk money you cannot afford to lose.
About Halliburton Company (HAL): Halliburton is North America's largest oilfield services company by market share, specializing in hydraulic fracturing, completions, directional drilling, and drilling fluids across 46,000 employees worldwide. With a market cap of $29.2B and operations spanning Latin America, the Middle East, Africa, and North America, HAL is a direct play on global oil exploration and production activity in the Oil & Gas Field Services industry (SIC 1389).