🎯 INTU: $9.7M Call Bet on 46% Upside Move! Someone Knows Something...
📅 December 11, 2025 | 🔥 Unusual Activity Detected
🎯 The Quick Take
Someone just dropped $9.7 MILLION on Intuit calls betting on a massive move to $700 by mid-January! This massive bet, representing 9,000 contracts at the $700 strike, shows a z-score of 26.33 (extremely unusual activity) - this isn't your typical retail flow. With INTU trading around $671, this institutional whale is betting on a 4.3% rally in just 36 days, right through the critical 2025 tax season ramp-up.
💼 Company Overview
Intuit Inc (NASDAQ: INTU) 📍 Mountain View, California | 👥 18,200 Employees 💰 Market Cap: $184.3 Billion
Intuit dominates the business accounting and tax software space with a powerful ecosystem of products. Their portfolio includes QuickBooks (small business accounting leader with 81% market share), TurboTax (67% of DIY tax prep market), Credit Karma (personal finance platform), and Mailchimp (email marketing). The company went public in 1993 and has built formidable competitive moats through vertical integration and high switching costs.
What They Do: Think of INTU as the financial operating system for small businesses and individual filers. From doing your taxes to managing your business books to checking your credit score - Intuit probably touches your financial life somewhere.
💰 The Option Flow Breakdown
📊 What Just Happened
| Date | Time | Type | Strike | Expiration | Contracts | Premium | Spot Price | Strategy |
|---|---|---|---|---|---|---|---|---|
| 2025-12-11 | 11:39:03 | BUY CALL | $700 | 2026-01-16 | 9,000 | $9.7M | $671.17 | Long Call |
Trade Details:
- 💵 Premium Paid: $9,700,000 ($10.74 per contract)
- 🎯 Strike Price: $700 (4.3% above current price)
- 📅 Expiration: January 16, 2026 (36 days out)
- 📊 Open Interest: 10,000 contracts
- 🔥 Z-Score: 26.33 (EXTREMELY UNUSUAL)
- 📈 Order Type: Buy-to-Open (BTO)
🤓 What This Actually Means
Translation for us regular folks: A major institutional player just made a massive directional bet that Intuit rockets above $700 in the next 36 days. Here's why this trade is wild:
🐋 This is Whale Territory: With a z-score of 26.33, this trade is 555 times larger than typical INTU option activity. This happens maybe once or twice a year - definitely not your neighbor Bob on Robinhood.
💡 They're Betting on Catalysts: The timing is surgical - this position expires right after tax filing season ramps up in early January. Someone believes INTU's AI-powered tax platform launches and Credit Karma momentum will drive the stock through $700.
⚠️ Conviction Play: They paid $10.74 per contract for calls that need a 4.3% rally just to break even. This isn't a lottery ticket - this is calculated conviction based on inside knowledge of business momentum or upcoming catalysts.
🎢 Risk Profile: Maximum loss is capped at the $9.7M premium paid, but the upside is theoretically unlimited above $700. Breakeven sits at $710.74 - they need INTU at that level by January 16 just to walk away even.
📈 Technical Setup / Chart Check-Up
YTD Chart Analysis
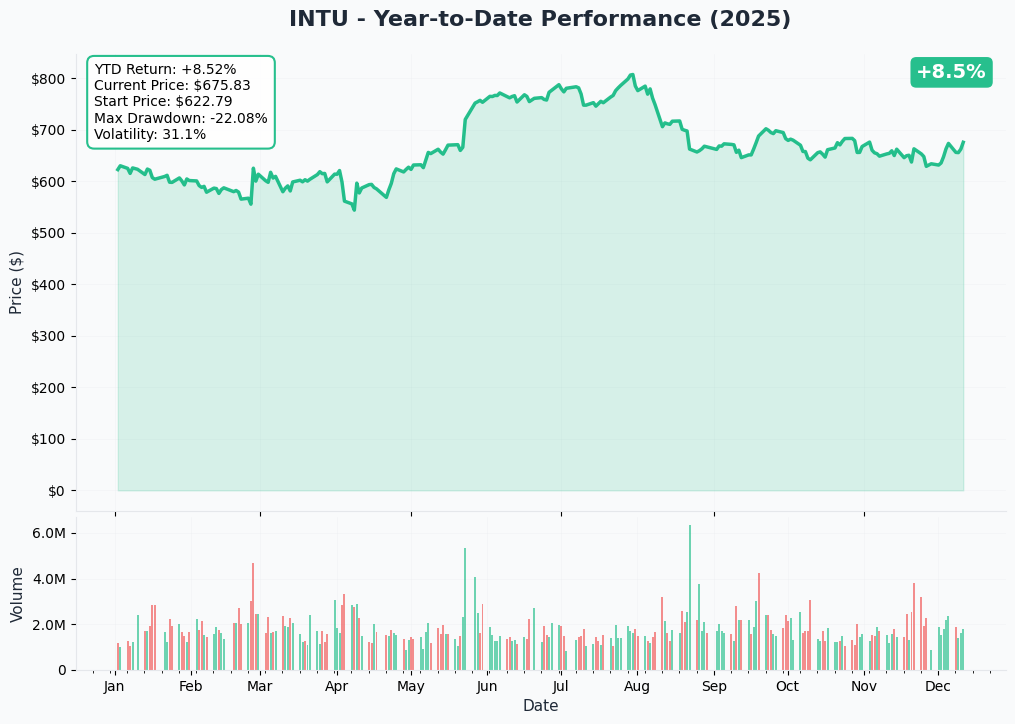
INTU is currently trading at $671, down 17.5% from its 52-week high of $813.70 hit earlier this year but well above the 52-week low of $532.65. The stock has shown resilience after the November DOGE-related selloff (dropped 6.8% on government tax app threat) and is now consolidating in the mid-$600s range.
Key Technical Observations:
- 📊 Stock finding support around $660-670 zone
- 📈 Currently trading above major gamma support at $670
- 🎯 Next major resistance sits at $680-690 corridor
- 💪 Holding above critical 200-day moving average zone
The chart shows a classic consolidation pattern after the sharp selloff - this whale trade suggests a breakout attempt is imminent.
Gamma-Based Support & Resistance Analysis
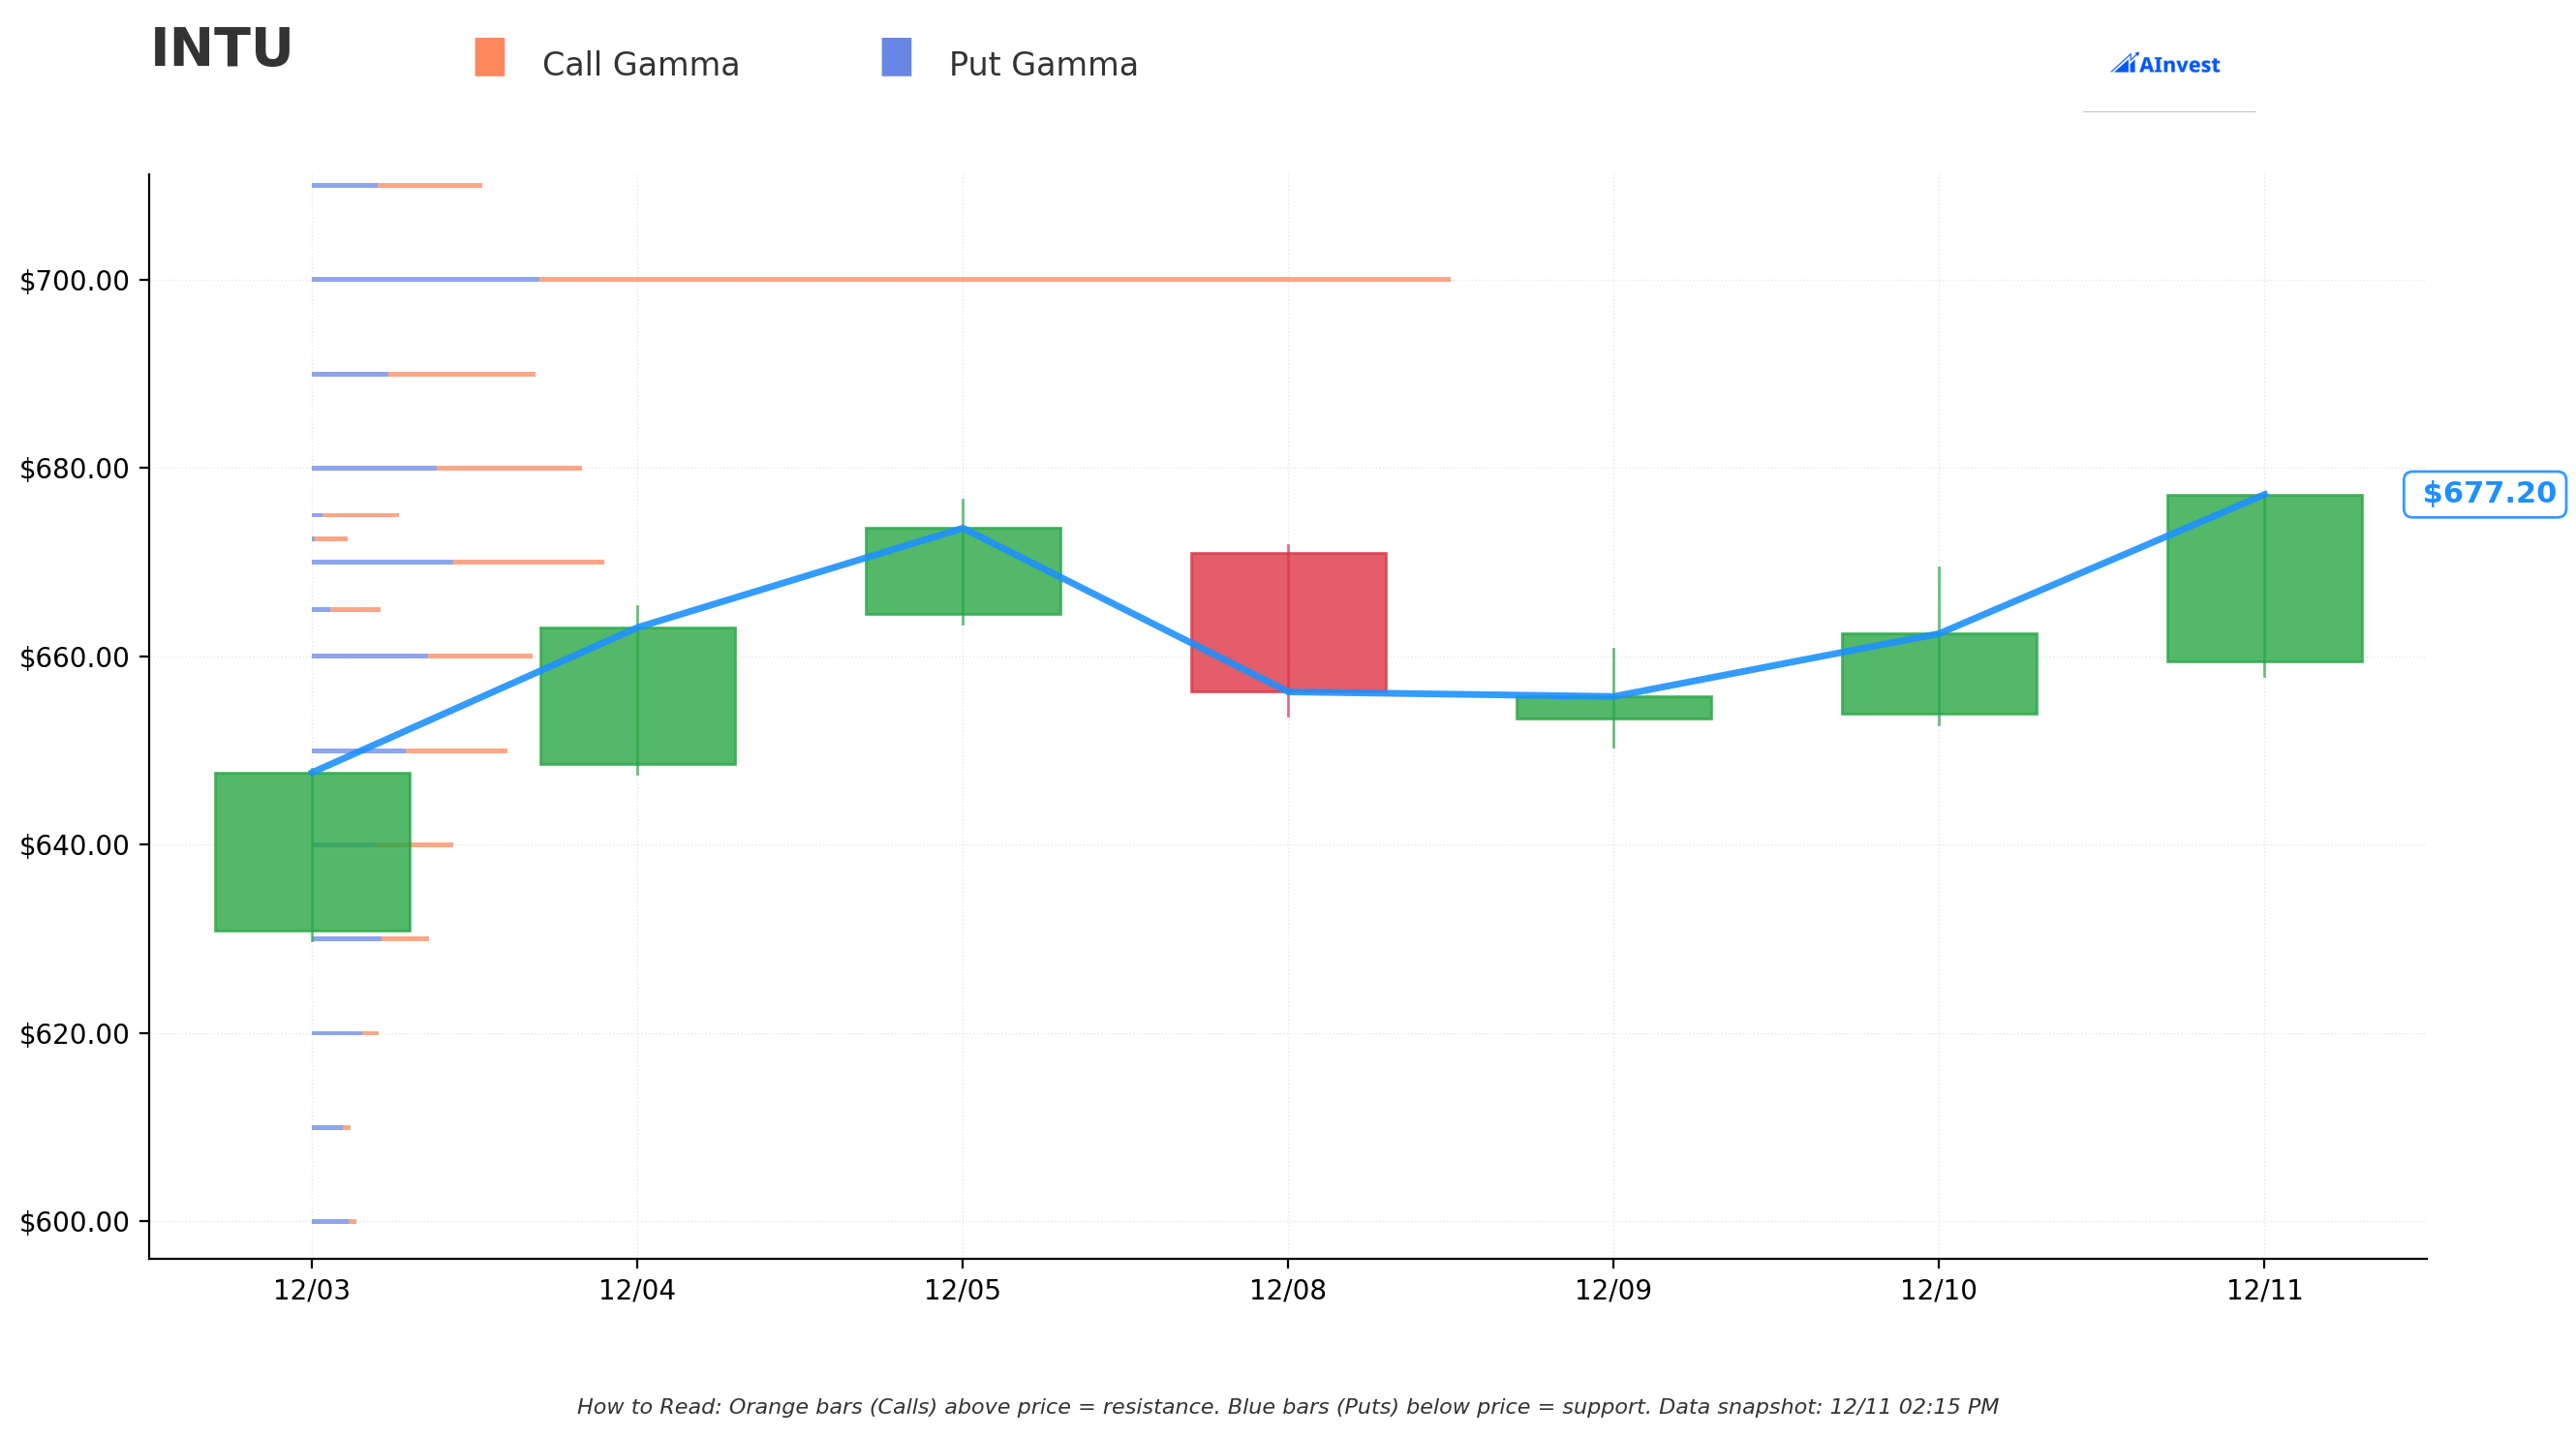
What the Gamma Tells Us:
The gamma exposure (GEX) analysis reveals critical price magnets where option market makers will defend levels:
🔴 Resistance Levels (Orange Bars - Call Gamma):
- $700 (MASSIVE): Total GEX of 7.01 - this is the monster level! The whale trade targets exactly this strike. Huge call gamma wall here means market makers will hedge aggressively if price approaches.
- $690: GEX of 1.37 - moderate resistance (+1.9% from current)
- $680: GEX of 1.65 - nearest resistance (+0.5% from current)
🔵 Support Levels (Blue Bars - Put Gamma):
- $670: Total GEX of 1.79 - strongest support floor (-1.0% from current)
- $660: GEX of 1.35 - secondary support (-2.5% from current)
- $650: GEX of 1.20 - tertiary support (-4.0% from current)
Net GEX Bias: BULLISH - Total call gamma (15.97) dominates put gamma (8.91), indicating the options market is positioned for upside. This confirms the whale's directional bias.
Key Insight: That massive $700 strike gamma wall is what the whale is targeting. If INTU can break through the $680 resistance, the path to $700 opens up as delta hedging flows could accelerate the move.
Implied Move Analysis
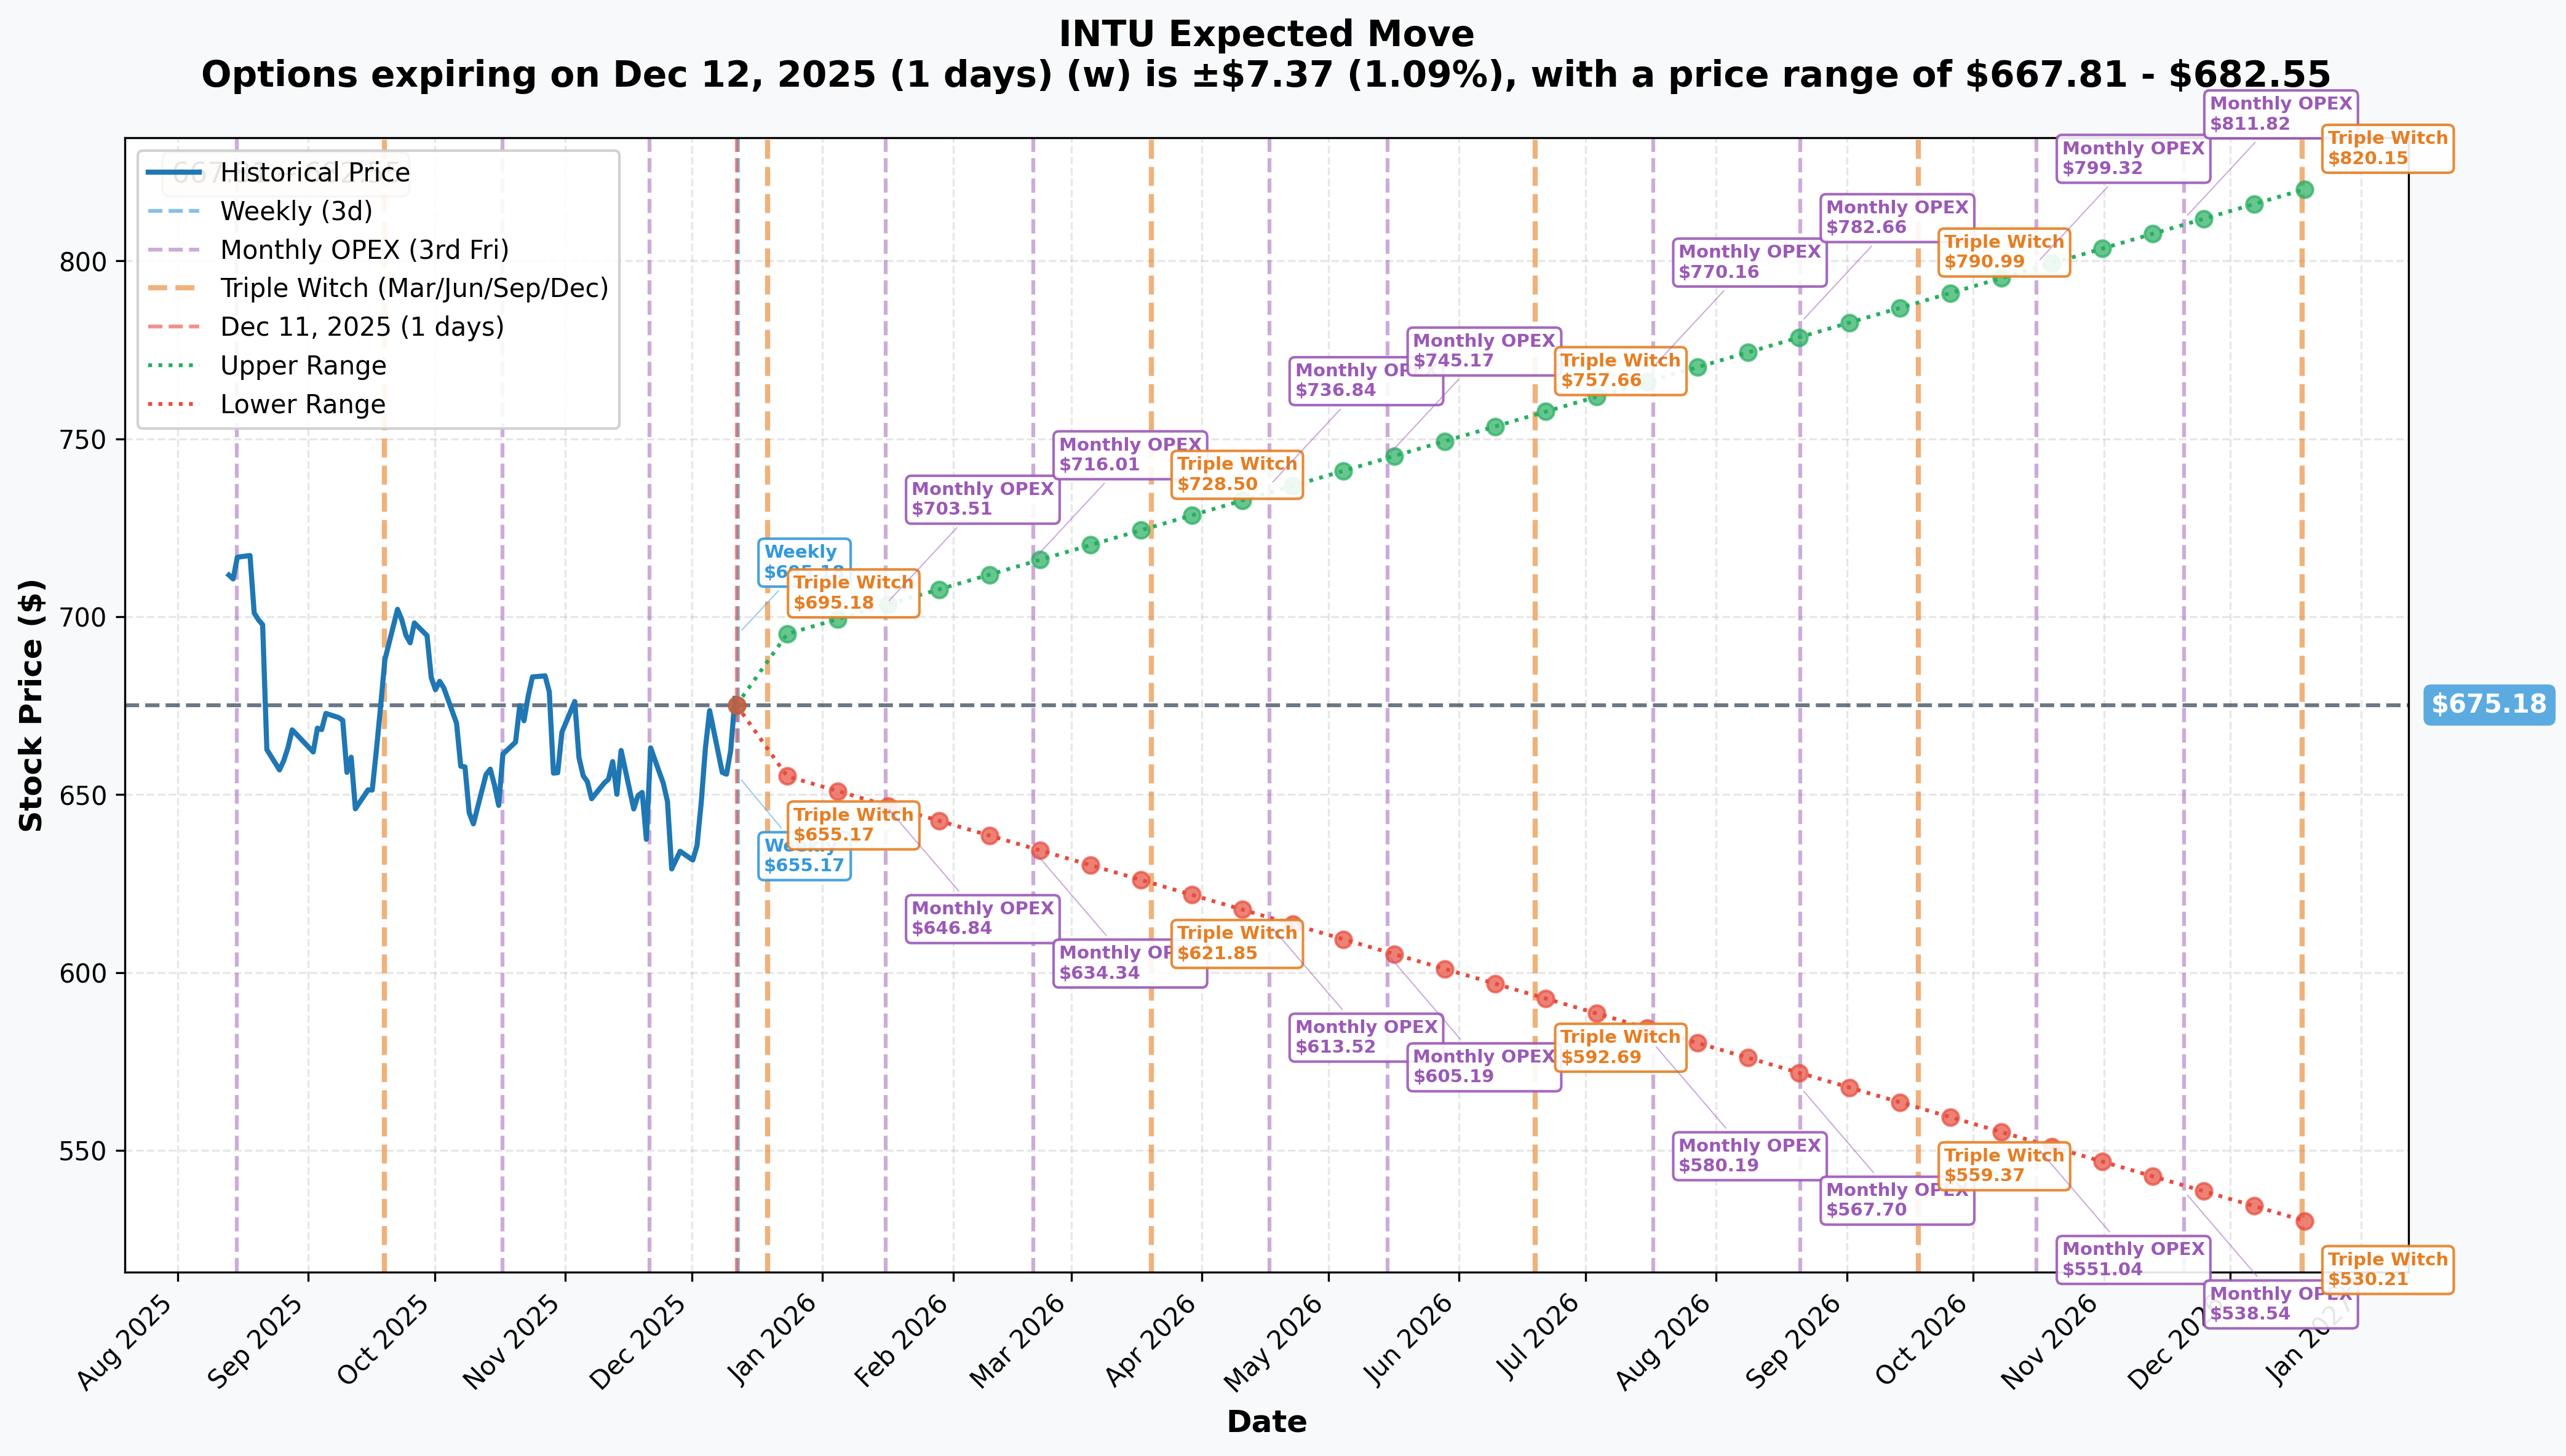
What Options Are Pricing In:
The options market is telling us expected price ranges for key expiration dates:
📅 Weekly (Dec 12, 2025 - 1 day out):
- Expected Move: ±1.09% ($7.37)
- Range: $667.81 - $682.55
- Verdict: Expecting relatively quiet trading into this week's close
📅 Monthly OPEX (Dec 19, 2025 - 8 days out):
- Expected Move: ±2.76% ($18.61)
- Range: $656.56 - $693.79
- Verdict: Market pricing moderate volatility through December options expiration
📅 January OPEX (Jan 16, 2026 - 36 days out):
- Expected Move: ±4.19% ($28.34)
- Range: $646.84 - $703.51
- Critical Level: Upper range of $703.51 lines up PERFECTLY with the whale's $700 strike target!
📅 Yearly LEAPS (Dec 18, 2026 - 372 days out):
- Expected Move: ±21.47% ($144.97)
- Range: $530.21 - $820.15
- Verdict: One-year outlook suggests potential retest of all-time highs
Real Talk: The January implied move upper bound of $703.51 validates the whale trade thesis. Options market is saying there's a realistic path to $700+ by mid-January - they just made a massive bet it actually happens.
🎪 Catalysts
📅 Upcoming Catalysts
Q3 FY2025 Earnings - May 22, 2025:
- Analyst EPS estimate: $11.04 (11.74% YoY growth expected)
- Too far out to impact this trade directly, but business momentum matters
Tax Season 2025 Performance (January-April 2025):
- 🔥 CRITICAL FOR THIS TRADE: Peak tax filing period February-April
- New AI-powered "done-for-you" tax experiences launched December 5
- Market share defense against IRS Direct File expansion is key
- TurboTax platform now available in English and Spanish for tax year 2024
Agentic AI Rollout (Ongoing through 2025):
- Agentic AI capabilities rolling out across TurboTax, Credit Karma, QuickBooks, Mailchimp
- CEO noted AI increases "monetization potential and driving efficiencies"
- Could drive premium tier adoption and pricing power
GenOS Platform Expansion:
- Major enhancements to proprietary GenOS platform accelerate development velocity
- Adding more LLM options beyond current providers
📰 Past Catalysts (Already Happened)
Q1 FY2025 Earnings Beat (November 21, 2024):
- ✅ Revenue: $3.28B vs. $3.14B expected (+10% YoY) - CNBC
- ✅ Adjusted EPS: $2.50 vs. $2.35 expected
- ✅ Credit Karma: $524M revenue (+29% YoY)
- ✅ QuickBooks Online: +21% revenue growth
- ❌ Stock fell 6% on weak Q2 guidance ($3.81B-$3.85B vs. $3.87B consensus)
$100M+ OpenAI Strategic Partnership (November 18, 2024):
- 🚀 Multi-year contract exceeding $100 million with OpenAI
- Brings TurboTax, Credit Karma, QuickBooks, Mailchimp into ChatGPT
- CFO detailed innovation roadmap and growth implications
LA28 Olympic Partnership (November 21, 2024):
- Founding Partner for 2028 LA Olympics
- Historic retention of Intuit Dome naming rights during Olympics (first time ever)
- Will host Olympic basketball events
Q2 FY2025 Results (Already Reported - February 25, 2025):
- Strong Q2 with 17% revenue growth
- Credit Karma: 36% revenue growth
- $721M in stock repurchases during Q2
DOGE Tax App Threat (November 19, 2024):
- ⚠️ Trump's DOGE exploring mobile tax filing app development
- Stock fell 6.8% on November 19 following news
- Bloomberg Intelligence warned "could threaten almost a third of Intuit's sales"
- However, Jefferies called threat "unwarranted" given low priority vs. other DOGE initiatives
Analyst Activity:
- ✅ JP Morgan upgraded from Neutral to Overweight (PT: $640 → $660)
- ✅ Goldman Sachs reiterated Buy with $860 price target
- ✅ Consensus: Strong Buy (16 buy ratings, 1 hold, 0 sell)
- ✅ Average price target: $812 (21% upside from current levels)
🎲 Price Targets & Probabilities
Using the gamma levels, implied move data, catalysts, and analyst targets, here are three scenarios:
🚀 Bull Case: $700-720 (25% probability)
Target Range: $700-720 Timeline: By January 16, 2026 expiration
Why It Happens:
- Tax season early adoption metrics exceed expectations for AI-powered TurboTax
- Credit Karma maintains 30%+ revenue growth trajectory from Q1/Q2
- DOGE tax app threat fades as politically unfeasible
- Market rotates back into quality growth names
- Gamma squeeze through $680 resistance accelerates move to $700 wall
Supporting Evidence:
- Implied move upper bound of $703.51 by January OPEX validates this target
- Analyst average PT of $812 shows room for upside
- Strong Q2 results (17% revenue growth) demonstrate business momentum
- $100M OpenAI partnership begins showing early monetization wins
Catalyst Triggers:
- Positive data points on TurboTax Live adoption in January
- Any positive news on IRS Direct File limitations
- Analyst upgrades post-holiday trading resumption
⚖️ Base Case: $670-690 (50% probability)
Target Range: $670-690 Timeline: Sideways consolidation through January
Why It Happens:
- Stock continues grinding in current range
- Tax season performs in-line with muted Q2 guidance
- DOGE headlines continue creating periodic volatility
- Market awaits concrete evidence of AI monetization
- Gamma support at $670 and resistance at $690 contains price action
Supporting Evidence:
- Current consolidation pattern after November selloff
- Conservative Q2 guidance signals management cautiousness
- IRS Direct File expansion provides structural headwind
- Valuation at 44.91x P/E limits upside without fundamental catalyst
What Happens to Whale Trade:
- Call expires worthless or gets closed at partial loss
- Time decay erodes premium value throughout January
- Needs breakout catalyst to rescue position
😰 Bear Case: $640-660 (25% probability)
Target Range: $640-660 Timeline: Breakdown if tax season disappoints
Why It Happens:
- TurboTax market share loss to IRS Direct File accelerates
- Single-digit consumer segment revenue decline (from Q2 guidance) worsens
- DOGE threat gains political traction in new administration
- Broader market selloff pressures high-multiple SaaS names
- Breaks through gamma support at $670
Supporting Evidence:
- Q2 guidance disappointed with revenue miss vs. consensus
- IRS Direct File made permanent starting 2025
- Heavy insider selling ($310M+ by CEO and founder with zero purchases)
- Premium valuation (45x P/E) leaves little margin for error
- Tax prep competitors (TaxAct, FreeTaxUSA, Cash App Taxes) gaining share
Catalyst Triggers:
- Negative tax season data in January/February
- Escalation of DOGE tax app development news
- Broader tech sector rotation/selloff
- Disappointing early AI monetization metrics
💡 Trading Ideas
🛡️ Conservative: "Fade the Whale" Put Spread
Strategy: Buy $670/$660 Put Spread (January 16 expiration)
Why This Works:
- You're betting the whale is wrong and INTU stays below $700
- Defined risk with gamma support levels as your guide
- If stock stays range-bound or pulls back, you profit
- Cost: ~$300-400 per spread (risking $400 to make $600)
Setup:
- Buy 1x $670 Put
- Sell 1x $660 Put
- Max profit: $600 (if INTU below $660 at expiration)
- Max loss: $400 (premium paid)
- Breakeven: $666
For Who: Skeptical traders who think the whale is early or wrong. You're collecting when institutions make mistakes.
⚖️ Balanced: "Ride the Gamma Rails" Call Spread
Strategy: Buy $680/$700 Call Spread (January 16 expiration)
Why This Works:
- You get exposure to the whale's thesis at 1/3rd the cost
- Capped risk means you can sleep at night
- Benefits from any momentum through $680 resistance
- Gamma levels support both strikes as magnetic zones
- Cost: ~$600-800 per spread
Setup:
- Buy 1x $680 Call
- Sell 1x $700 Call
- Max profit: $1,200-1,400 (if INTU above $700)
- Max loss: $600-800 (premium paid)
- Breakeven: ~$686-688
For Who: Traders who like the AI/tax season thesis but want defined risk. You're piggybacking the whale's homework with better risk management.
🚀 Aggressive: "Full Whale Mode" - $700 Calls
Strategy: Buy $700 Calls (January 16 expiration) - Same as the whale!
Why This Works:
- You're literally copying a $9.7M institutional bet
- Unlimited upside if INTU explodes above $700
- Z-score of 26.33 suggests they know something
- Tax season + AI catalysts align with expiration timing
- Cost: ~$10-12 per contract ($1,000-1,200 per lot)
Setup:
- Buy $700 Calls at ~$10.50-11.00
- Max profit: Unlimited above $700
- Max loss: Premium paid
- Breakeven: $710.50-711.00
For Who: YOLO traders with conviction and capital to risk. You're betting the whale has inside knowledge of business acceleration. Only do this if you can afford to lose 100% of premium.
Warning: ⚠️ This is the highest risk/highest reward option. Time decay works against you every single day. You need INTU above $710 just to break even. Not for the faint of heart!
⚠️ Risk Factors
Let's be real about what could go wrong here:
🏛️ Regulatory/Political Risks:
- DOGE Tax App: If Trump administration actually builds free mobile tax app, it's game over for TurboTax consumer business (could impact 1/3 of revenue per Bloomberg Intelligence)
- IRS Direct File Expansion: Program made permanent in 2025 - could erode entry-level market share
- FTC Scrutiny: Company settled for $144M over deceptive TurboTax ads - regulatory pressure remains
📉 Execution Risks:
- Q2 Guidance Miss: Conservative guidance suggests management sees headwinds
- Consumer Segment Weakness: Warning of single-digit revenue decline in consumer segment
- AI Monetization Uncertainty: $100M+ OpenAI investment needs to show ROI
- Seasonality: Substantial revenue concentration in tax season (Feb-April) creates quarterly volatility
💰 Valuation Risks:
- Premium Multiple: 44.91x P/E prices in substantial growth - little room for error
- Near 52-Week High: Down 17.5% from peak at $813.70 but needs fresh catalyst to break out
- Insider Selling: Zero purchases vs. 181 sales in past 6 months (CEO and founder sold $310M+)
🎯 Technical Risks:
- Gamma Wall at $700: Massive call gamma means market makers will fight hard to keep price below this level
- Time Decay: Every day that passes erodes option value - theta is NOT your friend here
- Implied Vol Crush: If INTU stays range-bound, option premiums could collapse
🏢 Competitive Threats:
- Low-Cost Alternatives: TaxAct, TaxSlayer, FreeTaxUSA, Cash App Taxes competing on price
- Cloud Accounting Rivals: Xero, FreshBooks, Bill.com challenging QuickBooks
- Market Saturation: 81% small business accounting share and 67% DIY tax prep share limits growth runway
Bottom Line on Risk: This whale trade requires multiple things to go right simultaneously: tax season outperformance, DOGE threat fading, AI monetization showing early wins, and broader market cooperation. Any one of these failing could sink the trade.
🎯 The Bottom Line
Here's the deal: Someone with $9.7 million just made a calculated bet that Intuit breaks through $700 by mid-January. The z-score of 26.33 tells us this is institutional money with conviction - this happens maybe once or twice a year in INTU.
What Makes This Interesting: ✅ Timing is surgical - right into tax season ramp-up ✅ Gamma analysis confirms $700 as massive magnetic level ✅ Implied move validates path to $700+ by January OPEX ✅ AI platform launches + OpenAI partnership provide fundamental catalysts ✅ Credit Karma momentum (36% growth) offsets TurboTax headwinds ✅ Analyst consensus of $812 average PT shows Wall Street believes in upside
What Makes This Risky: ❌ DOGE threat could torpedo entire thesis overnight ❌ IRS Direct File expansion is structural headwind ❌ Conservative Q2 guidance signals management caution ❌ Heavy insider selling (CEO/founder dumped $310M) raises red flags ❌ Premium valuation (45x P/E) leaves zero margin for error ❌ Time decay erodes $1,000+ per contract in value weekly
Action Plan:
📊 If You Own INTU Stock:
- Watch $680 level closely - break above confirms whale thesis
- Consider selling $700 calls against shares to collect premium
- Mark calendar for early January tax season metrics
👀 If You're Watching:
- $680 breakout = confirmation to enter
- $670 breakdown = stay away, gamma support failing
- Monitor any DOGE news developments closely
- Wait for tax season adoption data in mid-January
😰 If You're Bearish:
- $670 level is your line in sand - break below opens $650
- Put spreads offer defined risk way to fade the whale
- Watch for weak tax season metrics in January
Real Talk: This whale knows something or thinks they do. The z-score doesn't lie - this is extremely unusual activity. But between DOGE threats, IRS Direct File expansion, and valuation concerns, there are legitimate reasons to be skeptical. The smart play is probably a defined-risk spread to piggyback the thesis with better risk management rather than full YOLO mode on naked calls.
Mark Your Calendar: January 16, 2026 - that's judgment day for this $9.7M bet. Tax season data in early January will tell us if the whale is genius or dead wrong.
⚠️ Disclaimer
This analysis is for educational and informational purposes only and should not be considered financial advice. Options trading involves substantial risk and is not suitable for all investors. You can lose your entire investment and more. Past performance does not guarantee future results.
The unusual options activity described represents single trades that may be part of complex multi-leg strategies, hedges, or portfolio adjustments. We cannot know the true intent behind these trades or the full positions held by the traders.
Key risks include:
- Total Loss Potential: Options can expire worthless, resulting in 100% loss of premium paid
- Time Decay: Option value erodes daily, especially accelerating in final 30 days
- Volatility Risk: Implied volatility changes can dramatically impact option prices
- Leverage: Options provide leverage which magnifies both gains and losses
- Complexity: Multi-leg strategies require understanding of various risk parameters
Before trading options:
- Consult with a qualified financial advisor regarding your specific situation
- Fully understand the risks and mechanics of options trading
- Only invest capital you can afford to lose completely
- Read the OCC's "Characteristics and Risks of Standardized Options"
Market conditions can change rapidly. All price targets, probabilities, and scenarios are estimates based on current information and may not reflect actual outcomes. Do your own research and trade at your own risk.
Links and Resources:
Analysis generated December 11, 2025 | Data sources: ThetaData, Polygon.io, company filings, analyst reports