:moneybag: IREN - Bitcoin Miner Turned AI Data Center Play Sees $3.4M Unusual Activity! :zap:
:calendar: January 22, 2026 | :fire: Unusual Activity Detected
:dart: The Quick Take
Two massive trades just hit the IREN tape totaling $3.4 MILLION in premium - someone closed out $2M worth of call options while simultaneously selling $1.4M in puts! This dual action on IREN (the Bitcoin miner that just landed a $9.7 billion Microsoft AI contract) signals sophisticated positioning ahead of Q2 FY26 earnings on February 11-18th. With the stock up +377% over the past year and trading near $53.88, smart money is actively managing exposure at these elevated levels. Translation: Big players are taking profits on calls while collecting premium selling puts - they think the floor is solid but the easy money has been made!
:chart_with_upwards_trend: Company Overview
IREN Limited (IREN) is a data center powerhouse at the intersection of Bitcoin mining and AI infrastructure:
- Market Cap: $17.56 Billion
- Industry: Data Centers / Bitcoin Mining / AI Infrastructure
- Current Price: $53.88 (near 52-week high of $76.87)
- 52-Week Range: $5.13 - $76.87
- Primary Business: Data center operations powering Bitcoin mining and AI/HPC workloads using renewable energy
- Headquarters: Sydney, Australia (NASDAQ-listed)
IREN has transformed from a pure Bitcoin miner into a dual-engine growth company with a landmark $9.7B Microsoft AI cloud contract, 23,000 GPU fleet, and 2.9 GW of secured power capacity. The company generates revenue through Bitcoin mining operations (50-52 EH/s hashrate) and is rapidly scaling AI cloud services targeting $3.4B annualized run-rate revenue by end of 2026.
:moneybag: The Option Flow Breakdown
The Tape (January 22, 2026):
| Date | Time | Symbol | Buy/Sell | Call/Put | Expiration | Strike | Volume | Premium | Order Type | Strategy | Z-Score | Classification |
|---|---|---|---|---|---|---|---|---|---|---|---|---|
| 2026-01-22 | 12:33:04 | IREN | BUY | CALL $55 | 2026-01-30 | $55.0 | 10,000 | $2,000,000 | BTC (Close Long Call) | Close Long Call | 5.62 | EXTREMELY_UNUSUAL |
| 2026-01-22 | 12:33:04 | IREN | SELL | PUT $48 | 2026-01-30 | $48.0 | 12,000 | $1,400,000 | STO (Short Put) | Short Put | 18.48 | EXTREMELY_UNUSUAL |
:nerd_face: What This Actually Means
This is a two-pronged profit-taking and income strategy executed at the same exact time! Here's the breakdown:
Trade 1 - Closing the $55 Calls ($2M):
- :moneybag: Premium collected: $2M to close (Buy-To-Close)
- :chart_with_upwards_trend: Structure: Someone held $55 strike calls expiring January 30th and is CLOSING the position
- :dart: Why now: Stock at $53.88 means these calls are nearly at-the-money with only 8 days to expiration - locking in profits before time decay accelerates
- :bulb: Signal: Taking chips off the table after massive rally
Trade 2 - Selling $48 Puts ($1.4M):
- :moneybag: Premium collected: $1.4M in income from selling puts
- :shield: Protection strike: $48 is 11% below current price - willing to buy at discount
- :dart: Confidence level: Trader believes IREN won't fall below $48 by January 30th
- :bulb: Signal: Bullish floor conviction, collecting premium while waiting
What's really happening here: This looks like an institution ROTATING exposure - they're closing out aggressive call bets (taking $2M off the table) while simultaneously selling puts to collect $1.4M premium. The put sale suggests they're confident IREN has support around $48 and are willing to be "put the stock" at that level if it drops. This is sophisticated risk management: reducing upside exposure after 377% yearly gain while generating income on the belief the floor is solid.
Unusual Score: :fire: EXTREMELY UNUSUAL - The put sale Z-score of 18.48 means this trade is roughly 18 standard deviations above normal activity - this happens maybe a few times per year on IREN! The call close at 5.62 Z-score is also highly unusual, representing activity 5-6x the typical daily range.
:chart_with_upwards_trend: Technical Setup / Chart Check-Up
YTD Performance Chart
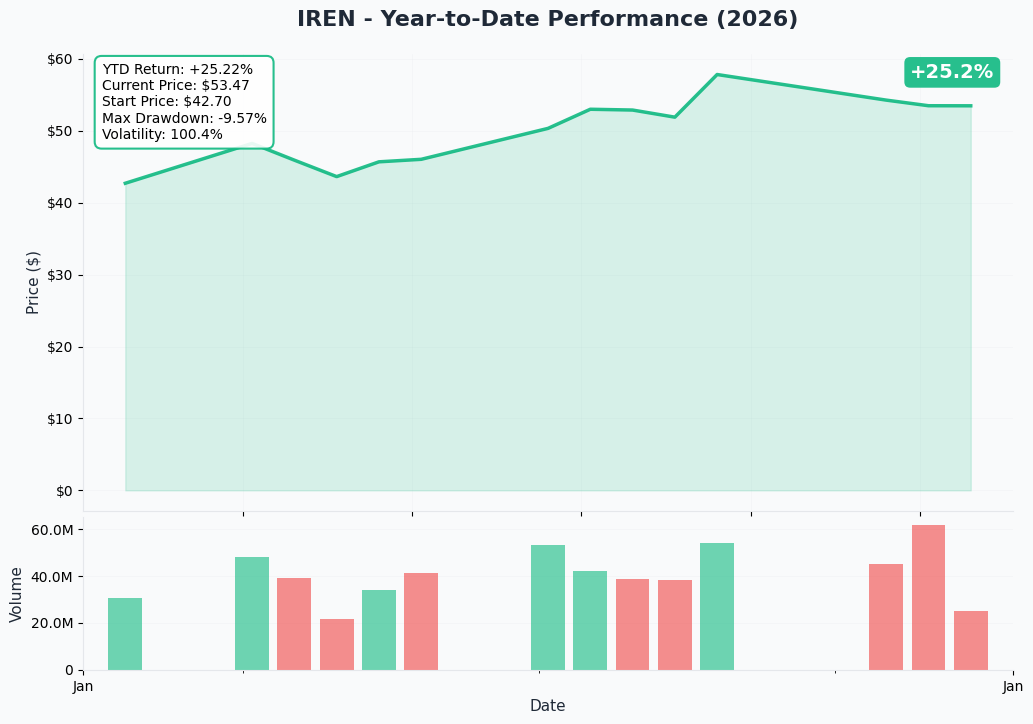
IREN has been absolutely crushing it - up +377% over the past year, transforming from a $5.13 low to highs above $76.87. The chart tells a story of transformation from pure Bitcoin miner to AI infrastructure powerhouse:
Key observations:
- :rocket: Explosive rally: Stock rocketed from ~$11 range in early 2025 to current $53.88 levels
- :chart_with_upwards_trend: Microsoft catalyst: The November 3rd announcement of the $9.7B Microsoft contract triggered massive institutional accumulation
- :roller_coaster: High volatility: Stock experienced significant swings between $43.73 (January 8th) and $56.89 (January 16th) this month alone
- :chart_with_downwards_trend: Recent consolidation: Pulled back from January highs, now consolidating around $53-54 level
- :warning: Extended territory: After 377% yearly gain, stock is vulnerable to profit-taking
Gamma-Based Support & Resistance Analysis
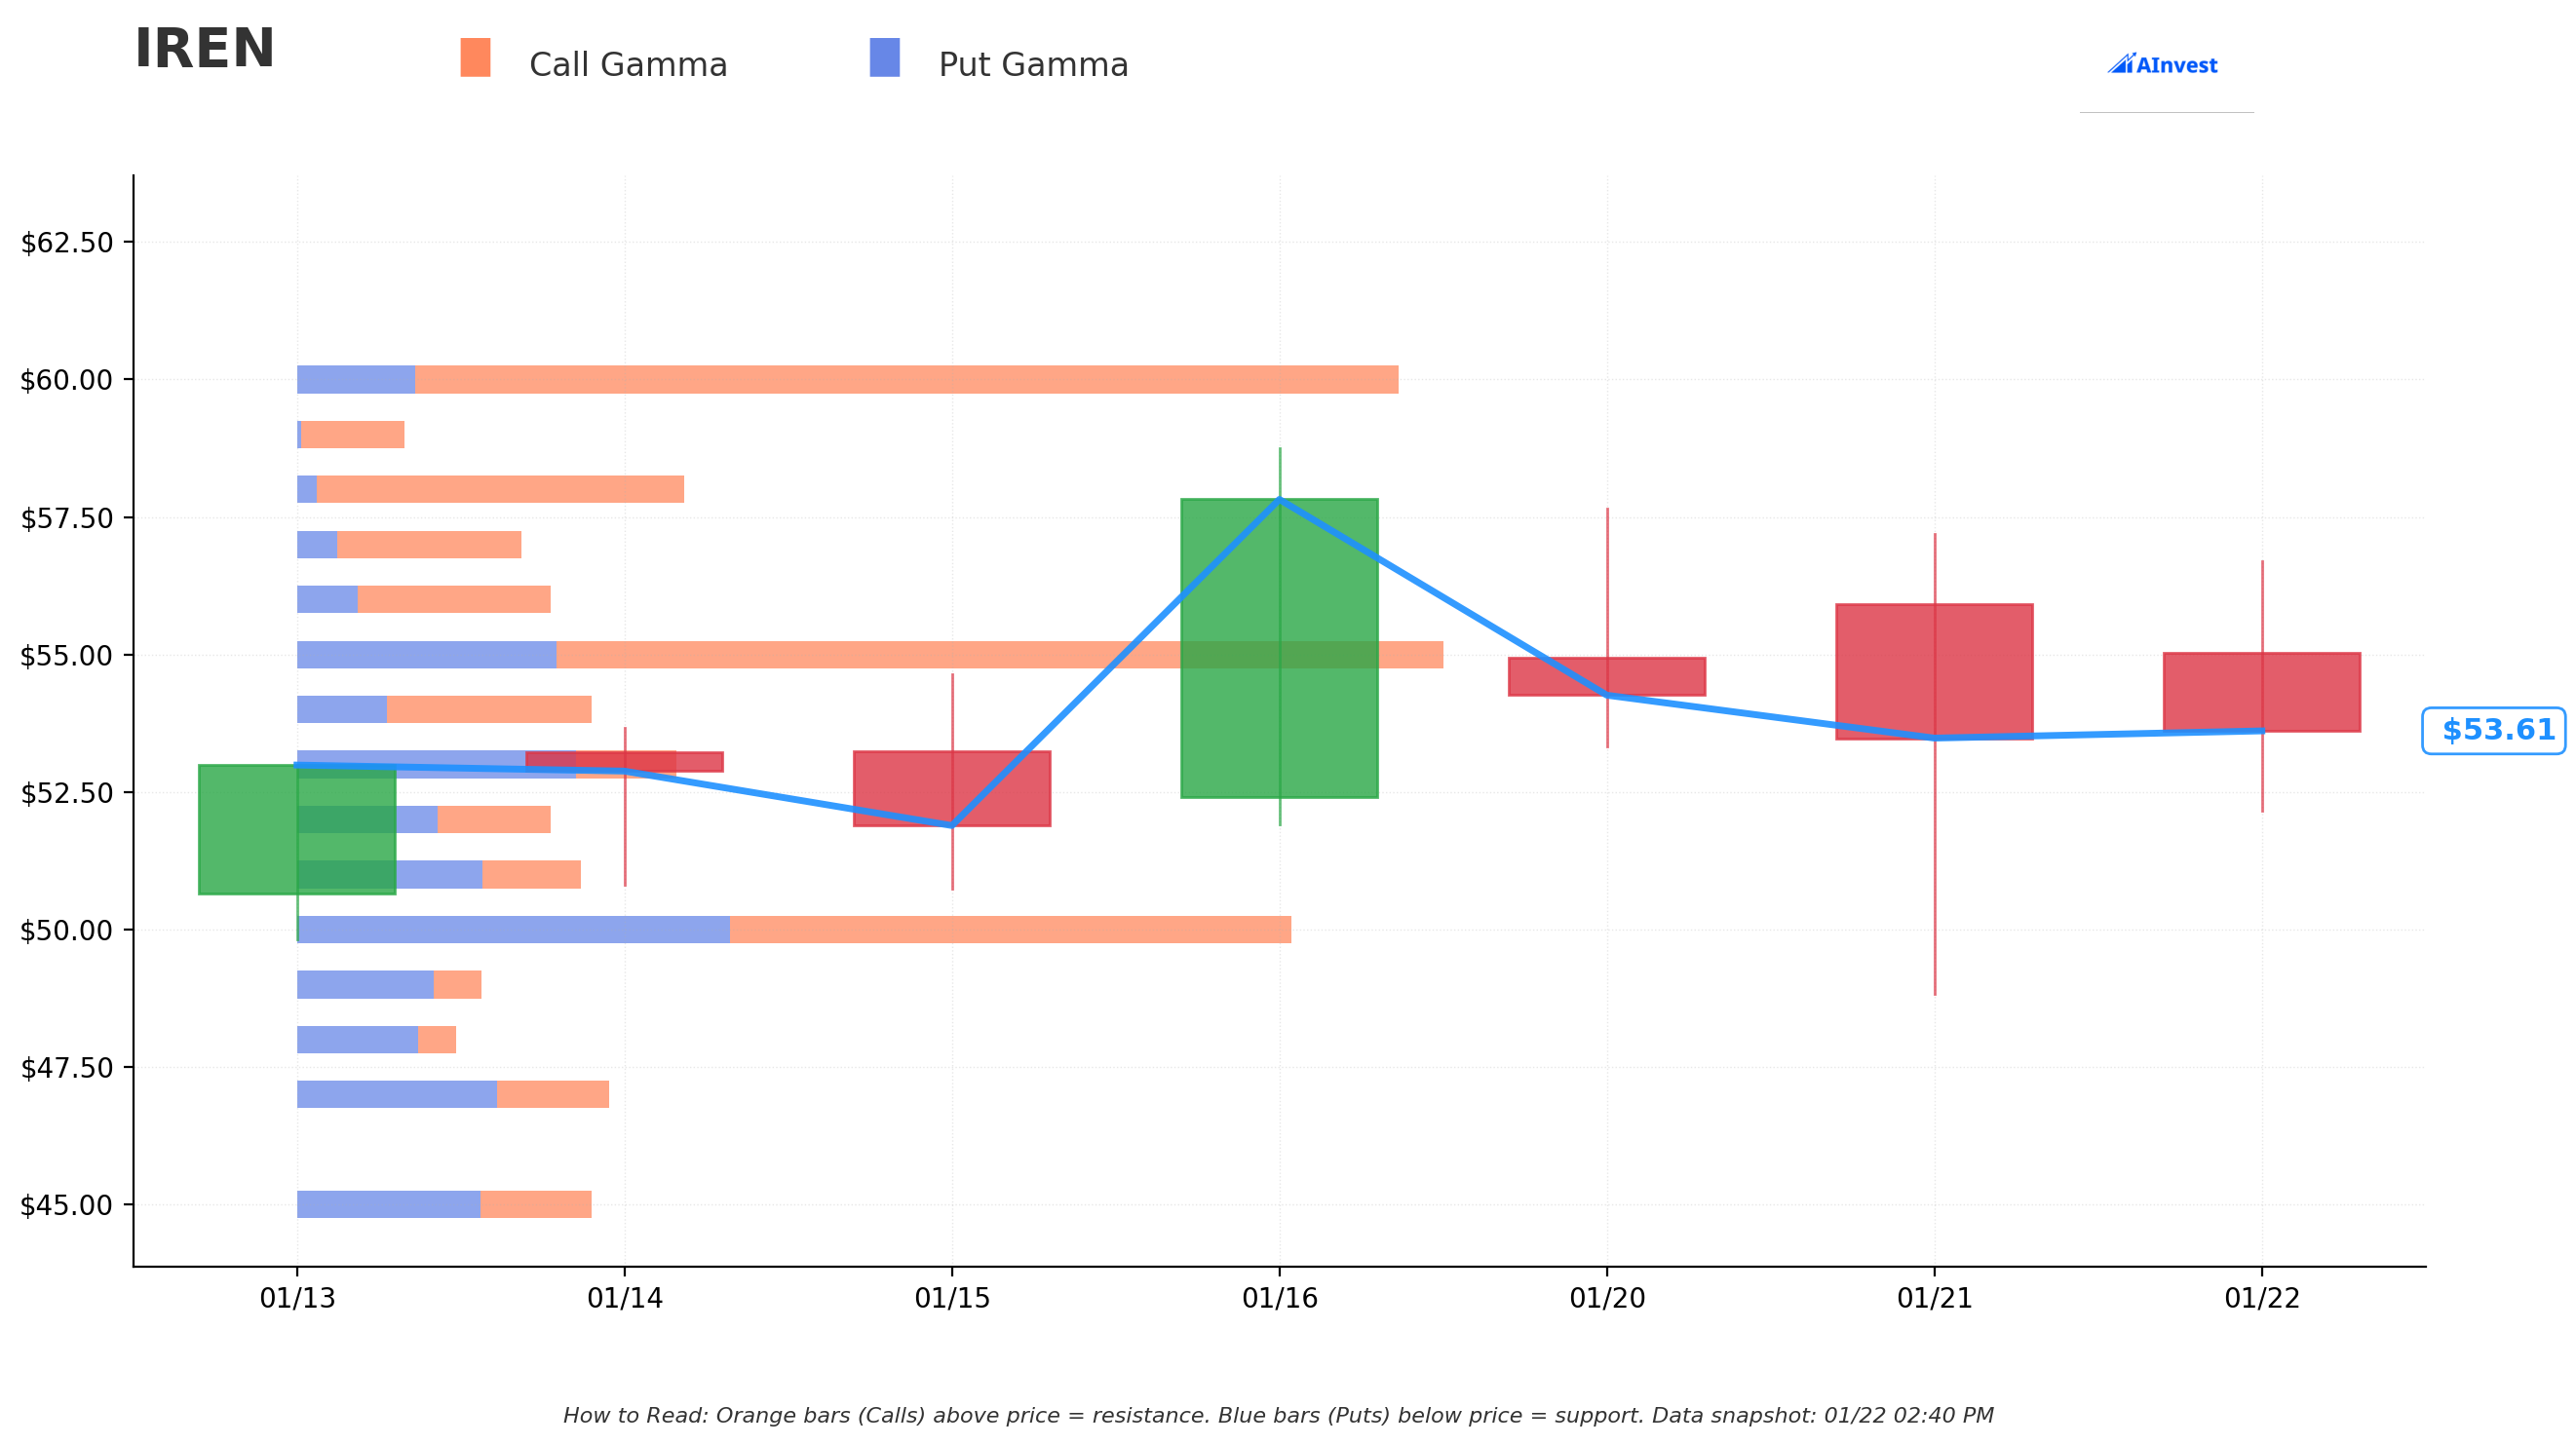
Current Price: $53.89
The gamma exposure map reveals critical price magnets and barriers that will govern near-term price action:
:blue_circle: Support Levels (Put Gamma Below Price):
- $53 - Immediate support with 4.26B total gamma (1.7% below current - FIRST LINE OF DEFENSE)
- $51 - Secondary support with 3.1B total gamma (5.4% below)
- $50 - Major structural floor with 10.98B gamma (HIGHEST TOTAL GAMMA - THE BIG SUPPORT!)
- $48 - Deep support with 3.42B gamma (PUT SALE STRIKE - not coincidental!)
- $47 - Extended support zone with 3.42B gamma (12.8% below)
- $45 - Disaster floor with 3.28B gamma (16.5% below)
:orange_circle: Resistance Levels (Call Gamma Above Price):
- $54 - Immediate ceiling with 3.23B gamma (0.2% overhead - VERY CLOSE!)
- $55 - Major resistance with 12.87B gamma (CALL CLOSE STRIKE - STRONGEST RESISTANCE!)
- $56 - Secondary resistance at 2.87B gamma (3.9% above)
- $58 - Extended resistance with 4.45B gamma (7.6% above)
- $60 - Major ceiling with 12.53B gamma (11.3% above - SECOND STRONGEST)
What this means for traders: IREN is sitting in a TIGHT range between $53 support and crushing $55 resistance. The call closer KNOWS that $55 (12.87B gamma) is the strongest resistance level - that's exactly why they're closing! Breaking above $55 would be significant, but the gamma data shows market makers holding enormous positions there creating natural selling pressure.
Notice the put sale strike? The put seller chose $48 which sits at a gamma support zone with 3.42B gamma. They're positioning just below several support levels, betting that even a pullback won't reach that far. Smart money is saying: "I'll take $48 if you give it to me, but I don't expect to see it."
Net GEX Bias: Bullish (76.33B call gamma vs 42.31B put gamma) - Overall positioning remains bullish with nearly 2:1 call-to-put gamma ratio. Market makers are positioned for upside but $55-$60 creates significant resistance.
Implied Move Analysis
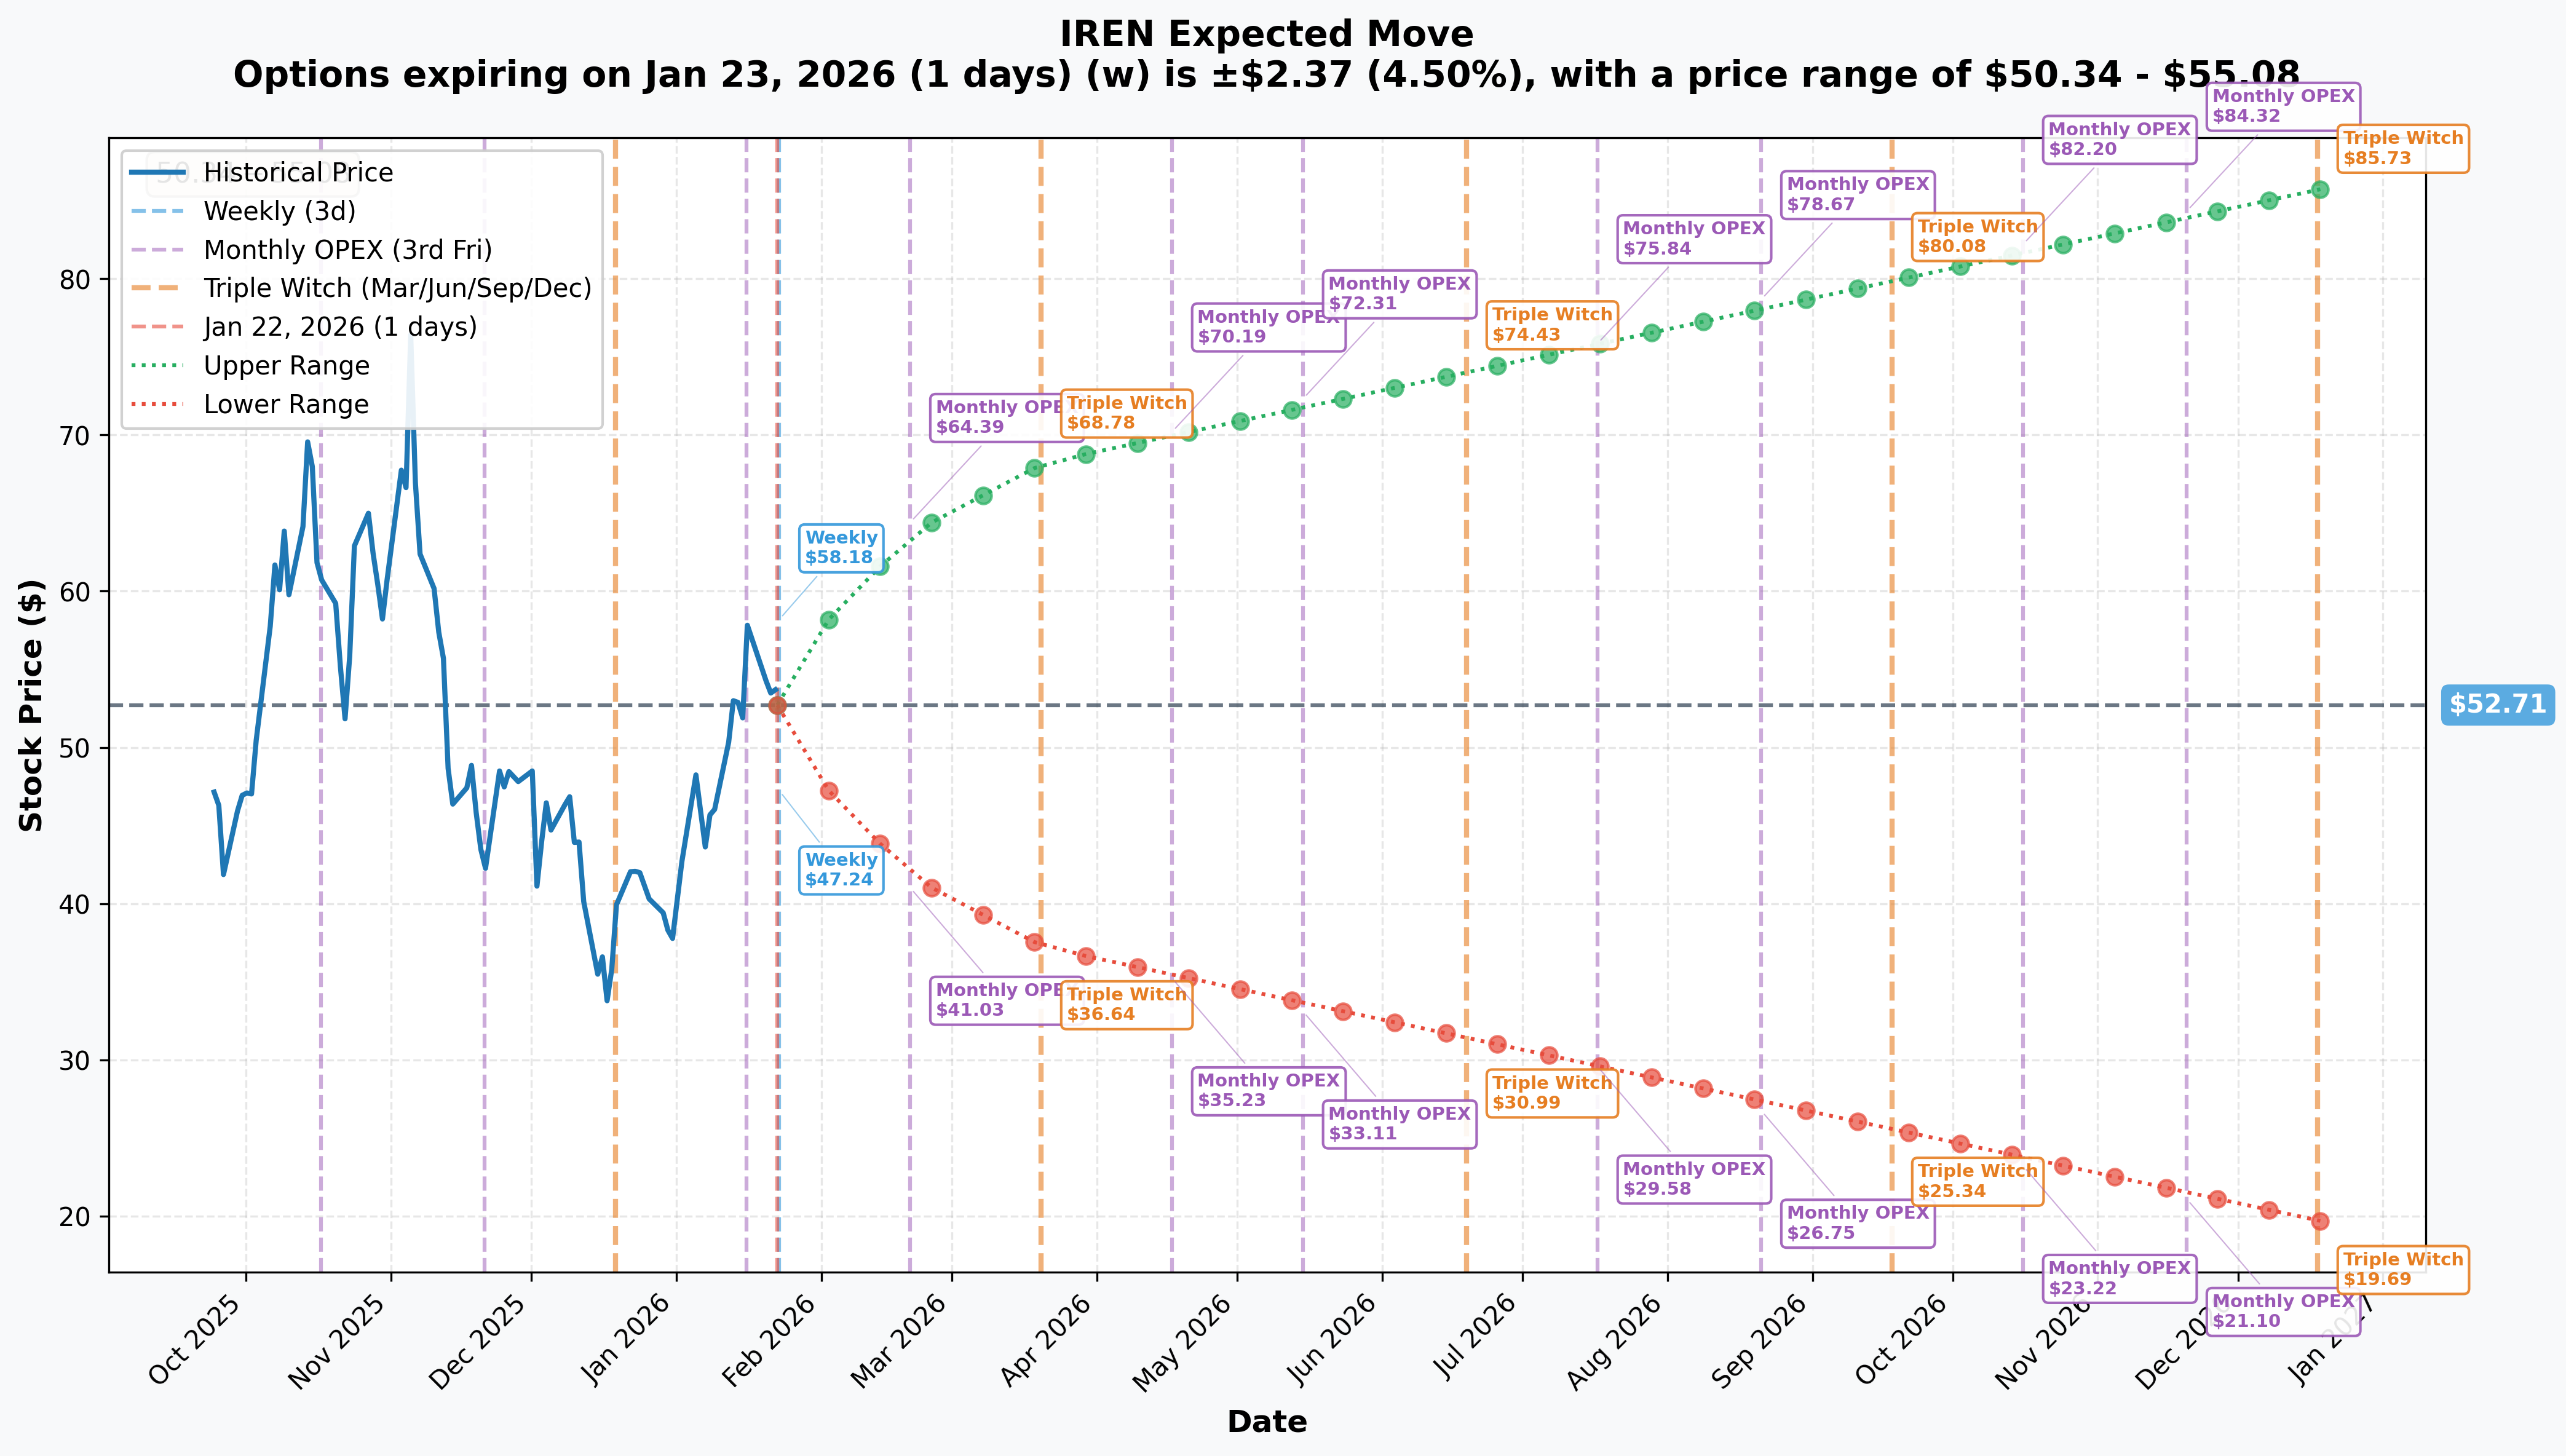
Options market pricing for upcoming expirations:
- :calendar: Weekly (Jan 23 - 1 day): +/-$2.37 (+/-4.5%) -> Range: $50.34 - $55.08
- :calendar: Monthly OPEX (Feb 20 - 29 days): +/-$11.05 (+/-21.0%) -> Range: $41.66 - $63.76
- :calendar: Quarterly Triple Witch (Mar 20 - 57 days): +/-$15.49 (+/-29.4%) -> Range: $37.22 - $68.20
- :calendar: Yearly LEAPS (Dec 18 - 330 days): +/-$33.02 (+/-62.7%) -> Range: $19.69 - $85.73
Translation for regular folks: Options traders are pricing in a 4.5% move ($2.37) by tomorrow for weekly expiration, but a MASSIVE 21% move ($11.05) through February monthly OPEX which captures the Q2 FY26 earnings on February 11-18th. The market expects FIREWORKS around earnings - that's a huge implied move for a $17.5B company!
The February expiration (when earnings hit) shows a lower range of $41.66 - meaning the market thinks there's a real possibility IREN could trade as low as $42 over the next month. This aligns with the put seller's confidence: at $48, they're selling puts ABOVE the lower implied range, suggesting they see better support than the market is pricing.
Key insight: The 21% monthly implied move reflects massive uncertainty around earnings execution. Q1 FY26 already delivered +355% revenue growth and $1.08 EPS (beat by 620%), so expectations are sky-high for continuation.
:circus_tent: Catalysts
:fire: Upcoming Catalysts
Q2 FY26 Earnings - February 11-18, 2026 (3-4 WEEKS AWAY!) :chart_with_upwards_trend:
IREN reports fiscal Q2 results in mid-February. This is THE catalyst that will validate or challenge the AI pivot thesis. Key expectations based on Q1 FY26 results:
- :chart_with_upwards_trend: Q1 set the bar HIGH: Revenue $240.3M (+355% YoY), Net Income $384.6M, EPS $1.08 vs $0.15 consensus (beat by 620%)
- :robot: AI Cloud ARR: Progress toward $500M+ target is critical
- :computer: Microsoft deployment: Updates on the $9.7B contract Phase 1-4 rollout
- :coin: Bitcoin mining: Revenue contribution at current BTC prices (~$95,000-$105,000)
- :gear: GPU scaling: Progress toward 140,000 GPU target by end of 2026
Sweetwater Texas Energization - April 2026 :zap:
- 1.4 GW substation project expected to come online
- Will enable significant GPU deployment expansion
- Potential for additional hyperscale contracts announcement
Microsoft Contract Deployment - Throughout 2026 :handshake:
- Four deployment phases (Horizon 1-4) through 2026
- 200 MW of critical IT load when fully operational
- First significant revenue contribution expected mid-2026
- ~$1.94B annualized run-rate once fully commissioned
:white_check_mark: Recent Catalysts (Already Happened)
Microsoft AI Cloud Contract - November 3, 2025 :star:
The game-changer that transformed IREN's trajectory:
- $9.7 billion over five years with 20% prepayment
- IREN to provide NVIDIA GB300 GPUs
- $5.8 billion agreement with Dell Technologies for equipment
Q1 FY26 Earnings Beat - November 6, 2025 :rocket:
- Revenue $240.3M (+355% YoY)
- EPS $1.08 vs $0.15 consensus (beat by 620%)
- Adjusted EBITDA $91.7M (+3,568% YoY)
GPU Fleet Expansion - September 2025 :gear:
- Doubled AI Cloud capacity to 23,000 GPUs
- Procured 7,100 NVIDIA B300s, 4,200 NVIDIA B200s, 1,100 AMD MI350Xs for $674M
- Customer contracts secured for ~$225M ARR
Analyst Upgrades - January 2026 :chart_with_upwards_trend:
- H.C. Wainwright upgraded from Sell to Buy, PT $80 (January 13, 2026)
- Cantor Fitzgerald PT $136 (highest on Street)
- Consensus: Moderate Buy with average PT $80-$83 implying ~50-67% upside
:game_die: Price Targets & Probabilities
Using gamma levels, implied move data, and upcoming catalysts, here are the scenarios through the January 30th expiration and beyond:
:chart_with_upwards_trend: Bull Case (30% probability)
Target: $58-$65
How we get there:
- :muscle: Earnings preview leaks or management commentary confirms AI revenue ahead of schedule
- :rocket: Bitcoin rallies above $110,000, boosting mining revenue expectations
- :handshake: New hyperscale customer announcements (beyond Microsoft)
- :chart_with_upwards_trend: Analyst upgrades citing $136 Cantor PT gain traction
- :bar_chart: Break above $55 gamma resistance triggers technical rally toward $60
- :globe_with_meridians: Broader tech rally lifts AI infrastructure names
Key gamma levels to watch:
- First target: $55 (major resistance - 12.87B gamma)
- Second target: $58 (4.45B gamma)
- Extended target: $60 (12.53B gamma - second strongest resistance)
Probability assessment: 30% because it requires MULTIPLE positive catalysts to align with stock already up 377% YTD at premium valuation. The $55 gamma wall creates significant headwind.
:dart: Base Case (45% probability)
Target: $50-$55 range (CONSOLIDATION)
Most likely scenario:
- :white_check_mark: No major news before earnings; stock digests gains
- :bar_chart: Trading range-bound between $53 gamma support and $55 resistance
- :coin: Bitcoin stays in $95,000-$105,000 range - stable but not exciting
- :robot: AI revenue tracking to plan but no surprises
- :sleeping: Volatility compression as market waits for February earnings clarity
- :shield: Put seller collects full $1.4M premium as stock stays above $48
This is the put seller's expected scenario: Stock consolidates, January 30th puts expire worthless, $1.4M premium in pocket. The call closer also benefits - they've taken $2M off the table and avoid potential decay if stock doesn't break $55.
Why 45% probability: Stock at technical inflection point after massive rally. Fundamentals strong but valuation rich. Institutions positioning for consolidation, not continuation.
:chart_with_downwards_trend: Bear Case (25% probability)
Target: $45-$50
What could go wrong:
- :worried: Microsoft contract execution concerns or delays surface
- :warning: Bitcoin drops below $80,000 (hit in November 2025), crushing mining revenue sentiment
- :chart_with_downwards_trend: Broader tech selloff drags AI infrastructure names lower
- :moneybag: Dilution fears from $660M shelf registration filed in January
- :memo: Short-seller reports resurface (remember July 2024 Culper Research report that dropped stock 24%)
- :bar_chart: Break below $50 gamma support triggers cascade toward $48, then $45
Critical support levels:
- :shield: $53: Immediate support (4.26B gamma)
- :shield: $50: Major gamma floor (10.98B - MUST HOLD)
- :shield: $48: Put sale strike (3.42B gamma) - put seller forced to buy here
- :shield: $45: Extended floor (3.28B gamma) - disaster scenario
Probability assessment: 25% because IREN's fundamentals (Microsoft contract, GPU scaling, mining margins) remain strong. However, 97% of current revenue still from volatile Bitcoin mining, creating tail risk if crypto crashes.
Put P&L in Bear Case:
- Stock at $48 on Jan 30: Puts expire at-the-money, put seller keeps ~80% of $1.4M premium
- Stock at $45 on Jan 30: Puts worth $3.00/contract, loss of ~$2.2M (12,000 x $300 - $1.4M premium)
- Stock at $42 on Jan 30: Puts worth $6.00/contract, loss of ~$5.8M
:bulb: Trading Ideas
:shield: Conservative: Cash-Secured Put Selling (Copy the Whale!)
Play: Sell cash-secured puts at support levels to collect premium or get stock at discount
Structure: Sell $48 puts expiring Feb 21 (after earnings)
Why this works:
- :moneybag: The $1.4M whale trade shows institutional confidence in $48 floor
- :bar_chart: $48 is 11% below current price AND below implied move lower range ($41.66)
- :shield: Gamma support at $48 (3.42B) and major floor at $50 (10.98B) above it
- :coin: At $48 you'd be buying IREN at <3x 2026 revenue target ($3.4B ARR) - compelling value
- :robot: Microsoft contract provides downside protection - even in selloff, fundamentals intact
- :calendar: Post-earnings timing lets you see Q2 results before committing
Estimated premium:
- :moneybag: Collect ~$1.50-$2.50 per contract depending on IV
- :dart: Breakeven: ~$45.50-$46.50 (additional 15% margin of safety!)
- :chart_with_upwards_trend: If stock stays above $48: Keep 100% premium (15-20% annualized return)
- :chart_with_downwards_trend: If assigned: Own IREN at $46-47 effective cost basis with Microsoft contract backing
Position sizing: Use only cash you're willing to tie up (100 shares = ~$4,800 capital requirement per contract)
Risk level: Moderate (must be willing to own IREN at $48) | Skill level: Intermediate
:balance_scale: Balanced: Bull Put Spread (Defined Risk)
Play: Sell put spread capturing premium with capped downside
Structure: Sell $50 puts, Buy $45 puts (February 21 expiration)
Why this works:
- :bar_chart: $50 has STRONGEST gamma support (10.98B) - most likely to hold
- :shield: $5 wide spread limits max loss to $500 per spread
- :moneybag: Targeting $1.50-$2.00 credit (~30-40% return on risk)
- :calendar: February expiration captures earnings reaction
- :dart: Breakeven ~$48-$48.50 - same zone the whale is confident about
Estimated P&L:
- :moneybag: Collect: ~$1.50-$2.00 per spread
- :chart_with_upwards_trend: Max profit: $150-$200 if IREN above $50 at expiration
- :chart_with_downwards_trend: Max loss: $300-$350 if IREN below $45
- :dart: Risk/Reward: ~1:2 to 1:2.3 - solid for defined-risk bullish play
Risk level: Moderate (defined risk) | Skill level: Intermediate
:rocket: Aggressive: Call Debit Spread Targeting $60
Play: Buy call spread betting on breakout above resistance
Structure: Buy $55 calls, Sell $60 calls (February 21 expiration)
Why this could work:
- :rocket: If Microsoft deployment accelerates or BTC rallies, $55 resistance breaks
- :bar_chart: $60 has second-strongest resistance (12.53B gamma) - natural profit target
- :chart_with_upwards_trend: Analyst consensus PT of $80-$83 implies significant upside
- :calendar: February expiration captures earnings potential beat
- :moneybag: $5 wide spread costs ~$1.50-$2.00, max profit $3.00-$3.50
Why this could fail:
- :warning: $55 gamma resistance (12.87B) is STRONGEST level - tough to break
- :chart_with_downwards_trend: Call closer just exited $55 calls - smart money pessimistic on breakout
- :moneybag: 377% rally may be exhausted - "buy the rumor, sell the news" risk
- :worried: Earnings miss could crater stock 15-20%
Estimated P&L:
- :moneybag: Cost: ~$1.50-$2.00 per spread
- :chart_with_upwards_trend: Max profit: $3.00-$3.50 if IREN above $60 at expiration (175-233% ROI)
- :chart_with_downwards_trend: Max loss: $1.50-$2.00 (entire debit) if IREN below $55
- :dart: Breakeven: ~$56.50-$57.00
CRITICAL WARNING: Only attempt if you can afford to lose entire premium. The call closer took $2M off the table at this EXACT strike for a reason.
Risk level: HIGH (directional bet against gamma resistance) | Skill level: Advanced
:warning: Risk Factors
Don't get caught by these potential landmines:
-
:calendar: Earnings binary event in 3-4 weeks: Q2 FY26 results on February 11-18th create MASSIVE volatility risk. Options pricing +/-21% implied move through February. After Q1 beat of 620%, expectations are sky-high. Any disappointment magnified at current valuation.
-
:coin: Bitcoin price correlation remains dominant: 97% of Q1 FY26 revenue still from crypto mining. Bitcoin dropped below $80,000 in November 2025 after hitting $126,000 in October. Another crypto crash could crater IREN 30-40% overnight regardless of AI pivot progress.
-
:chart_with_upwards_trend: Valuation stretched after 377% rally: Stock trading at demanding multiples based on FUTURE AI revenue projections. Current revenue still dominated by volatile mining. Limited margin for execution error.
-
:gear: GPU deployment execution risk: Scaling from 23,000 to 140,000 GPUs by end of 2026 (6x!) requires flawless execution on supply chain, infrastructure, and customer contracts. Any delays could impact projections.
-
:handshake: Microsoft contract concentration: $9.7B contract represents concentrated customer risk. Any delays, modifications, or scaling issues could significantly impact thesis.
-
:moneybag: Dilution risk from capital raises: $660.98M shelf registration filed January 2026 and $2.3B convertible notes offering create shareholder dilution concerns. Capital intensity of $5.8B Dell equipment purchase requires continued access to capital markets.
-
:memo: Short-seller history: July 2024 Culper Research report alleged data centers "unsuitable" for AI demands - stock fell 24% in one day. New short reports could resurface.
-
:balance_scale: Competition from established players: Hyperscale data center operators (Equinix, Digital Realty) and cloud providers have deeper pockets and established relationships. Bitcoin mining consolidation post-halving pressuring industry margins.
:dart: The Bottom Line
Real talk: Someone just executed a sophisticated two-part trade on IREN - closing $2M in call options while simultaneously selling $1.4M in puts. This isn't random retail activity - this is institutional risk management after a 377% yearly gain. They're taking profits on aggressive upside bets while expressing confidence in the $48 floor.
What these trades tell us:
- :dart: Smart money thinks the easy money has been made (closing calls at $55 resistance)
- :shield: But they're NOT bearish - willing to buy at $48 if given the opportunity (selling puts)
- :bar_chart: The timing (8 days before January 30 expiration) shows they see limited near-term upside
- :calendar: Real action comes at February earnings - these are positioning trades, not conviction bets
If you own IREN:
- :white_check_mark: Consider trimming 20-30% at current $53-54 levels (lock in gains from 377% rally)
- :bar_chart: Set MENTAL STOP at $50 (major gamma support) to protect remaining position
- :calendar: Hold core position through earnings if you believe in Microsoft contract thesis
- :shield: Consider selling covered calls at $55-$60 to generate income while waiting
If you're watching from sidelines:
- :calendar: February 11-18th is the moment of truth - wait for earnings clarity!
- :dart: Post-earnings pullback to $48-$50 would be EXCELLENT entry (10-15% below current)
- :bar_chart: Looking for: Microsoft deployment updates, AI Cloud ARR progress toward $500M, Bitcoin mining revenue stability
- :shield: The put-selling strategy makes sense here: collect premium or get stock at discount
If you're bearish:
- :dart: Wait for break below $50 gamma support before shorting
- :bar_chart: Put spreads ($50/$45) offer defined-risk downside play
- :warning: Bitcoin crash below $80,000 would be the catalyst for 20-30% correction
- :calendar: Be cautious fighting 377% momentum - timing is everything
Mark your calendar - Key dates:
- :calendar: January 30 - Current options expiration (trades analyzed today)
- :calendar: February 11-18 - Q2 FY26 earnings (MAIN EVENT!)
- :calendar: February 20 - Monthly OPEX (+/-21% implied move window)
- :calendar: April 2026 - Sweetwater Texas 1.4 GW energization
- :calendar: Throughout 2026 - Microsoft contract Phase 1-4 deployments
Final verdict: IREN represents a fascinating intersection of Bitcoin mining and AI infrastructure - the $9.7B Microsoft contract is transformative and the GPU scaling roadmap to 140,000 units is ambitious. BUT, after 377% gains with 97% revenue still from volatile Bitcoin mining, the risk/reward favors PATIENCE over aggression. The institutional trades today confirm this view: take some chips off the table, sell puts to collect premium, and wait for earnings clarity.
The Microsoft contract isn't going anywhere. Neither is the AI infrastructure build-out. But chasing after a 377% rally into earnings uncertainty is how retail traders lose money. Be smart. Be patient. Let the institutions show you where the floor really is.
Disclaimer: Options trading involves substantial risk of loss and is not suitable for all investors. This analysis is for educational purposes only and not financial advice. Past performance doesn't guarantee future results. IREN remains highly correlated with Bitcoin price movements, creating significant volatility risk. The Z-scores (5.62 and 18.48) reflect these specific trades' size relative to recent IREN history - they do not imply the trades will be profitable or that you should follow them. Always do your own research and consider consulting a licensed financial advisor before trading.
About IREN Limited: IREN Limited operates data centers powering the future of Bitcoin, AI, and beyond utilizing renewable energy. With a market cap of $17.56 billion, the company has transformed from a pure Bitcoin miner (50-52 EH/s hashrate) into an AI infrastructure powerhouse through its $9.7B Microsoft partnership and GPU scaling to 23,000+ units targeting $3.4B annualized run-rate revenue by end of 2026.