JBL Unusual Options Activity: $8.6M Complex 4-Leg Strategy Signals Institutional Positioning Ahead of AI Catalyst
January 13, 2026 | Unusual Activity Detected
The Quick Take
Someone just placed an $8.6M complex 4-leg options position on Jabil - and they did it all at once at 11:23 AM. This isn't a typical directional bet; it's a sophisticated institutional structure with collared risk and multiple expirations. With JBL riding the AI data center wave and sitting near all-time highs, this smart money is positioning for the next leg of the story.
Company Overview
Jabil Inc. (NYSE: JBL) is a global manufacturing solutions provider with a $24.3B market cap. The company operates across three segments: Intelligent Infrastructure (AI/cloud/data centers), Regulated Industries (automotive, healthcare), and Connected Living & Digital Commerce. Their SIC classification is Printed Circuit Boards, but today's Jabil is much more than that - they're a critical supplier for AI infrastructure buildout.
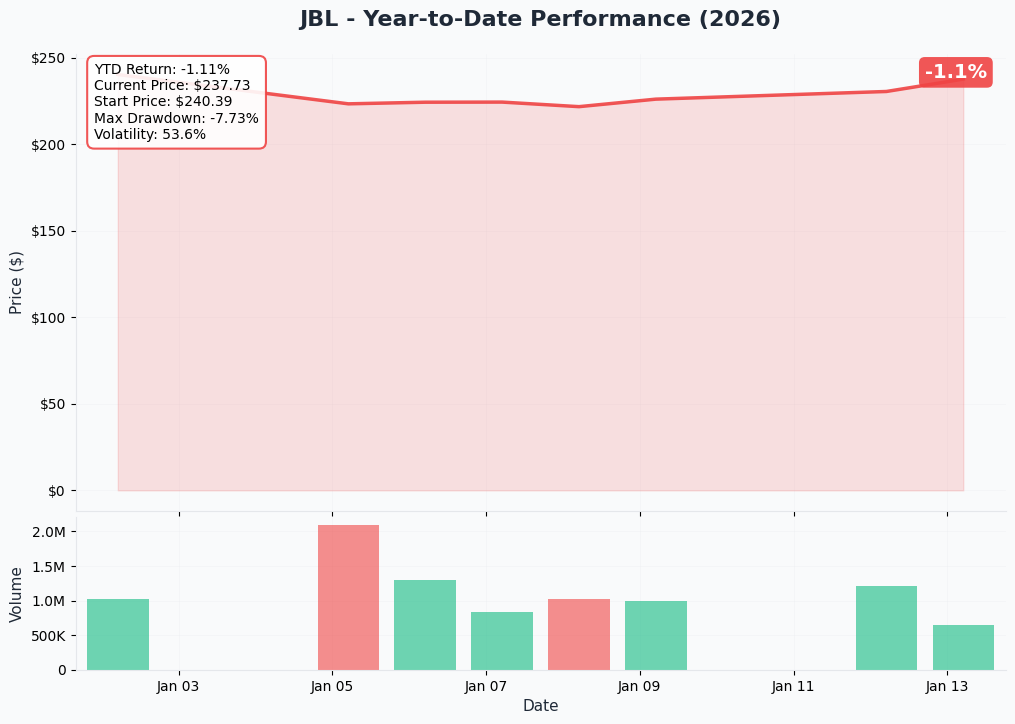
Current Price: $240.09 (at time of trades)
For more details, visit JBL on Ainvest.
The Option Flow Breakdown
What Just Happened
At exactly 11:23:30 AM, a trader executed a coordinated 4-leg options strategy:
| Time | Direction | Type | Expiration | Strike | Volume | Premium | Option Link |
|---|---|---|---|---|---|---|---|
| 11:23:30 | BUY | CALL | 2026-01-16 | $230 | 3,200 | $3.70M | JBL260116C230 |
| 11:23:30 | BUY | CALL | 2026-02-20 | $250 | 3,100 | $2.10M | JBL260220C250 |
| 11:23:30 | BUY | PUT | 2026-02-20 | $230 | 3,100 | $1.90M | JBL260220P230 |
| 11:23:30 | SELL | PUT | 2026-02-20 | $210 | 6,200 | $0.92M | JBL260220P210 |
Total Premium Deployed: $8.62M (net: ~$6.78M after short put credit)
What This Actually Means
This is a Custom 4-Leg Structure with two distinct time frames:
Leg 1 - Near-Term Directional (Jan 16 Expiry):
- Deep in-the-money $230 calls purchased for $3.7M
- With stock at $240, these are ~$10 ITM
- Only 3 days to expiration - this is immediate upside capture
Legs 2-4 - Collared Position (Feb 20 Expiry):
- Long $250 calls: upside participation above $250
- Long $230 puts: downside protection starting at $230
- Short $210 puts: reduces cost by selling far OTM puts (accepting risk below $210)
Translation: This trader wants immediate upside exposure through this week's expiration, while building a collared position into February that profits if JBL stays above $230, with capped losses between $210-$230.
Z-Score Analysis: All four legs show EXTREMELY_UNUSUAL activity:
- The $210 put sale had a Z-score of 435.73 (volume 64x normal)
- The $230 put buy had a Z-score of 263.27 (volume 54x normal)
- The $250 call buy had a Z-score of 58.84 (volume 8x normal)
This level of coordinated volume hitting at the same second screams institutional execution.
Technical Setup
YTD Chart Analysis
JBL has been on a remarkable run, gaining +47% over the past year and hitting an all-time high of $249 on January 5, 2026. The stock is currently consolidating just below those highs.
Key observations:
- Stock is trading in the upper portion of its recent range
- All-time high at $249 provides near-term resistance
- Strong uptrend intact since mid-2025
Gamma-Based Support & Resistance Analysis
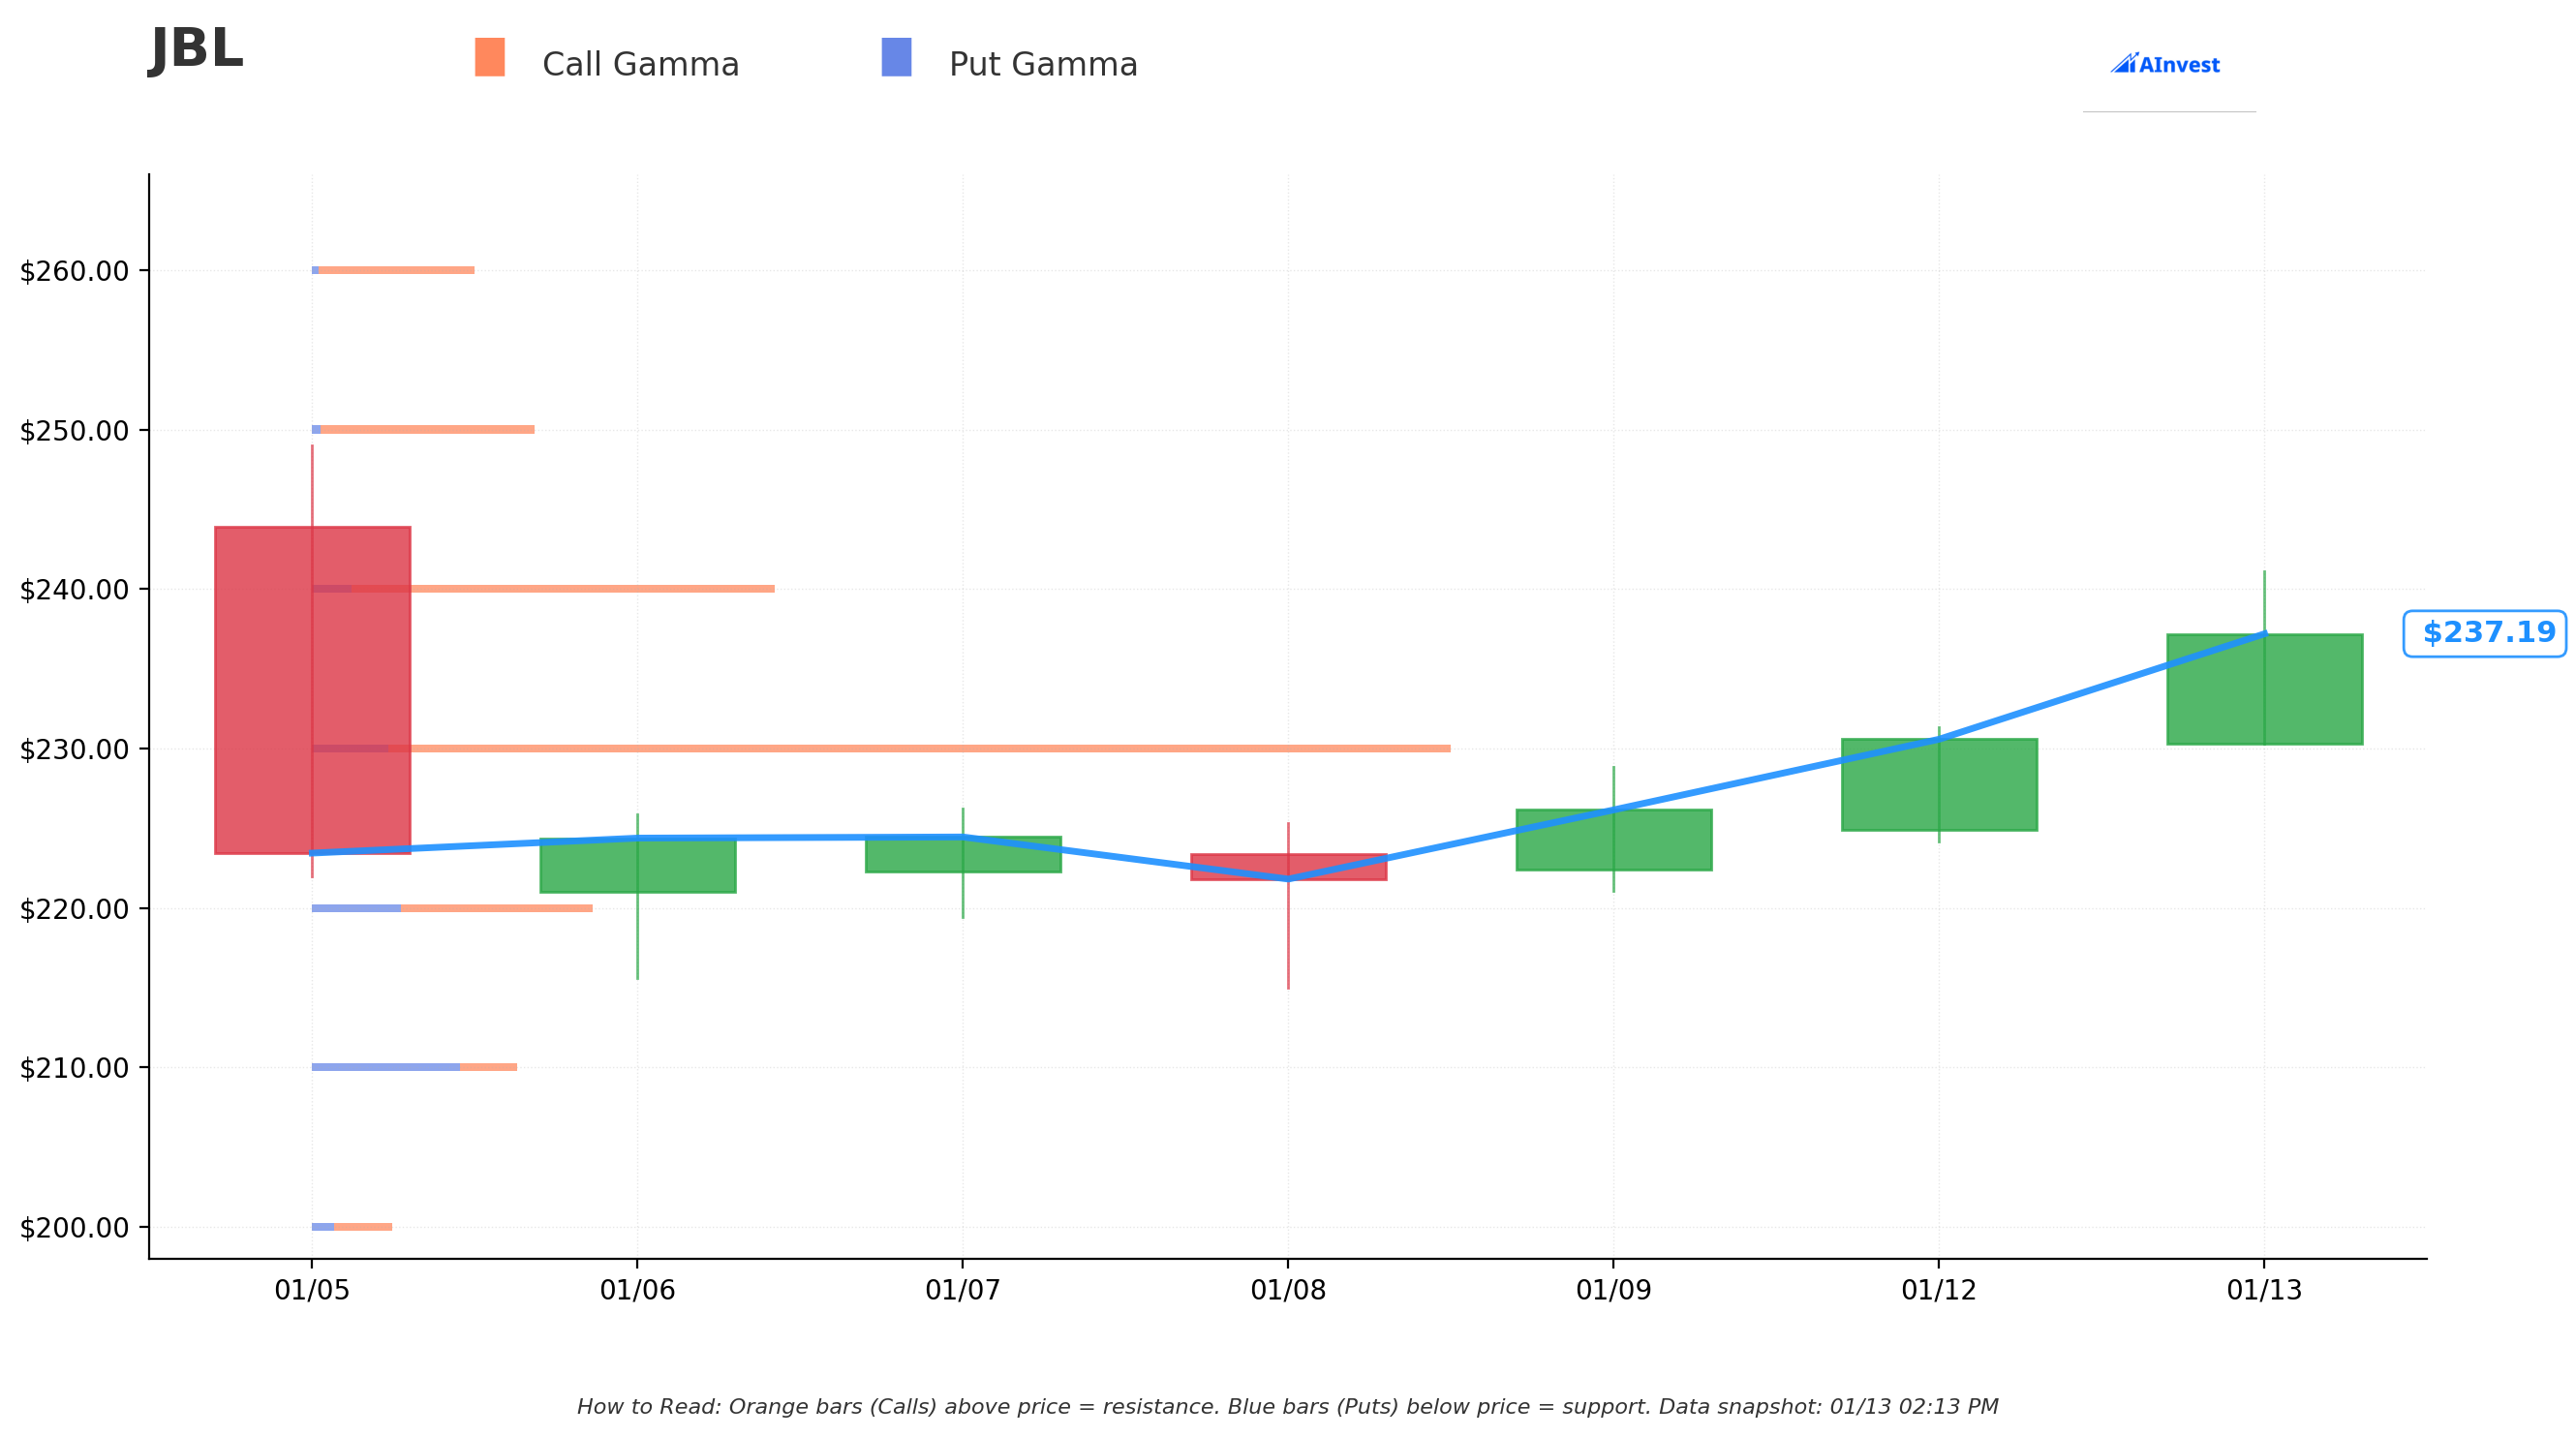
Based on current options positioning, here are the key gamma levels:
Resistance Levels (Call Gamma):
- $240 - Nearest resistance with 1.32 call GEX (1.4% above current price)
- $250 - Secondary resistance with 0.67 call GEX (5.6% above current price)
- $260 - Upper target with 0.49 call GEX (9.8% above current price)
Support Levels (Put Gamma):
- $230 - Strongest support with 3.36 call GEX and active put interest (2.8% below)
- $220 - Secondary support (7.1% below current price)
- $210 - Key floor with elevated put gamma (11.3% below)
Net GEX Bias: Bullish - Total call gamma (7.59) significantly exceeds put gamma (1.66), suggesting market makers are positioned for upward price movement.
The $230 strike is critical - it's where the trader placed protective puts and where gamma is concentrated. If JBL holds above $230, expect continued buying pressure.
Implied Move Analysis
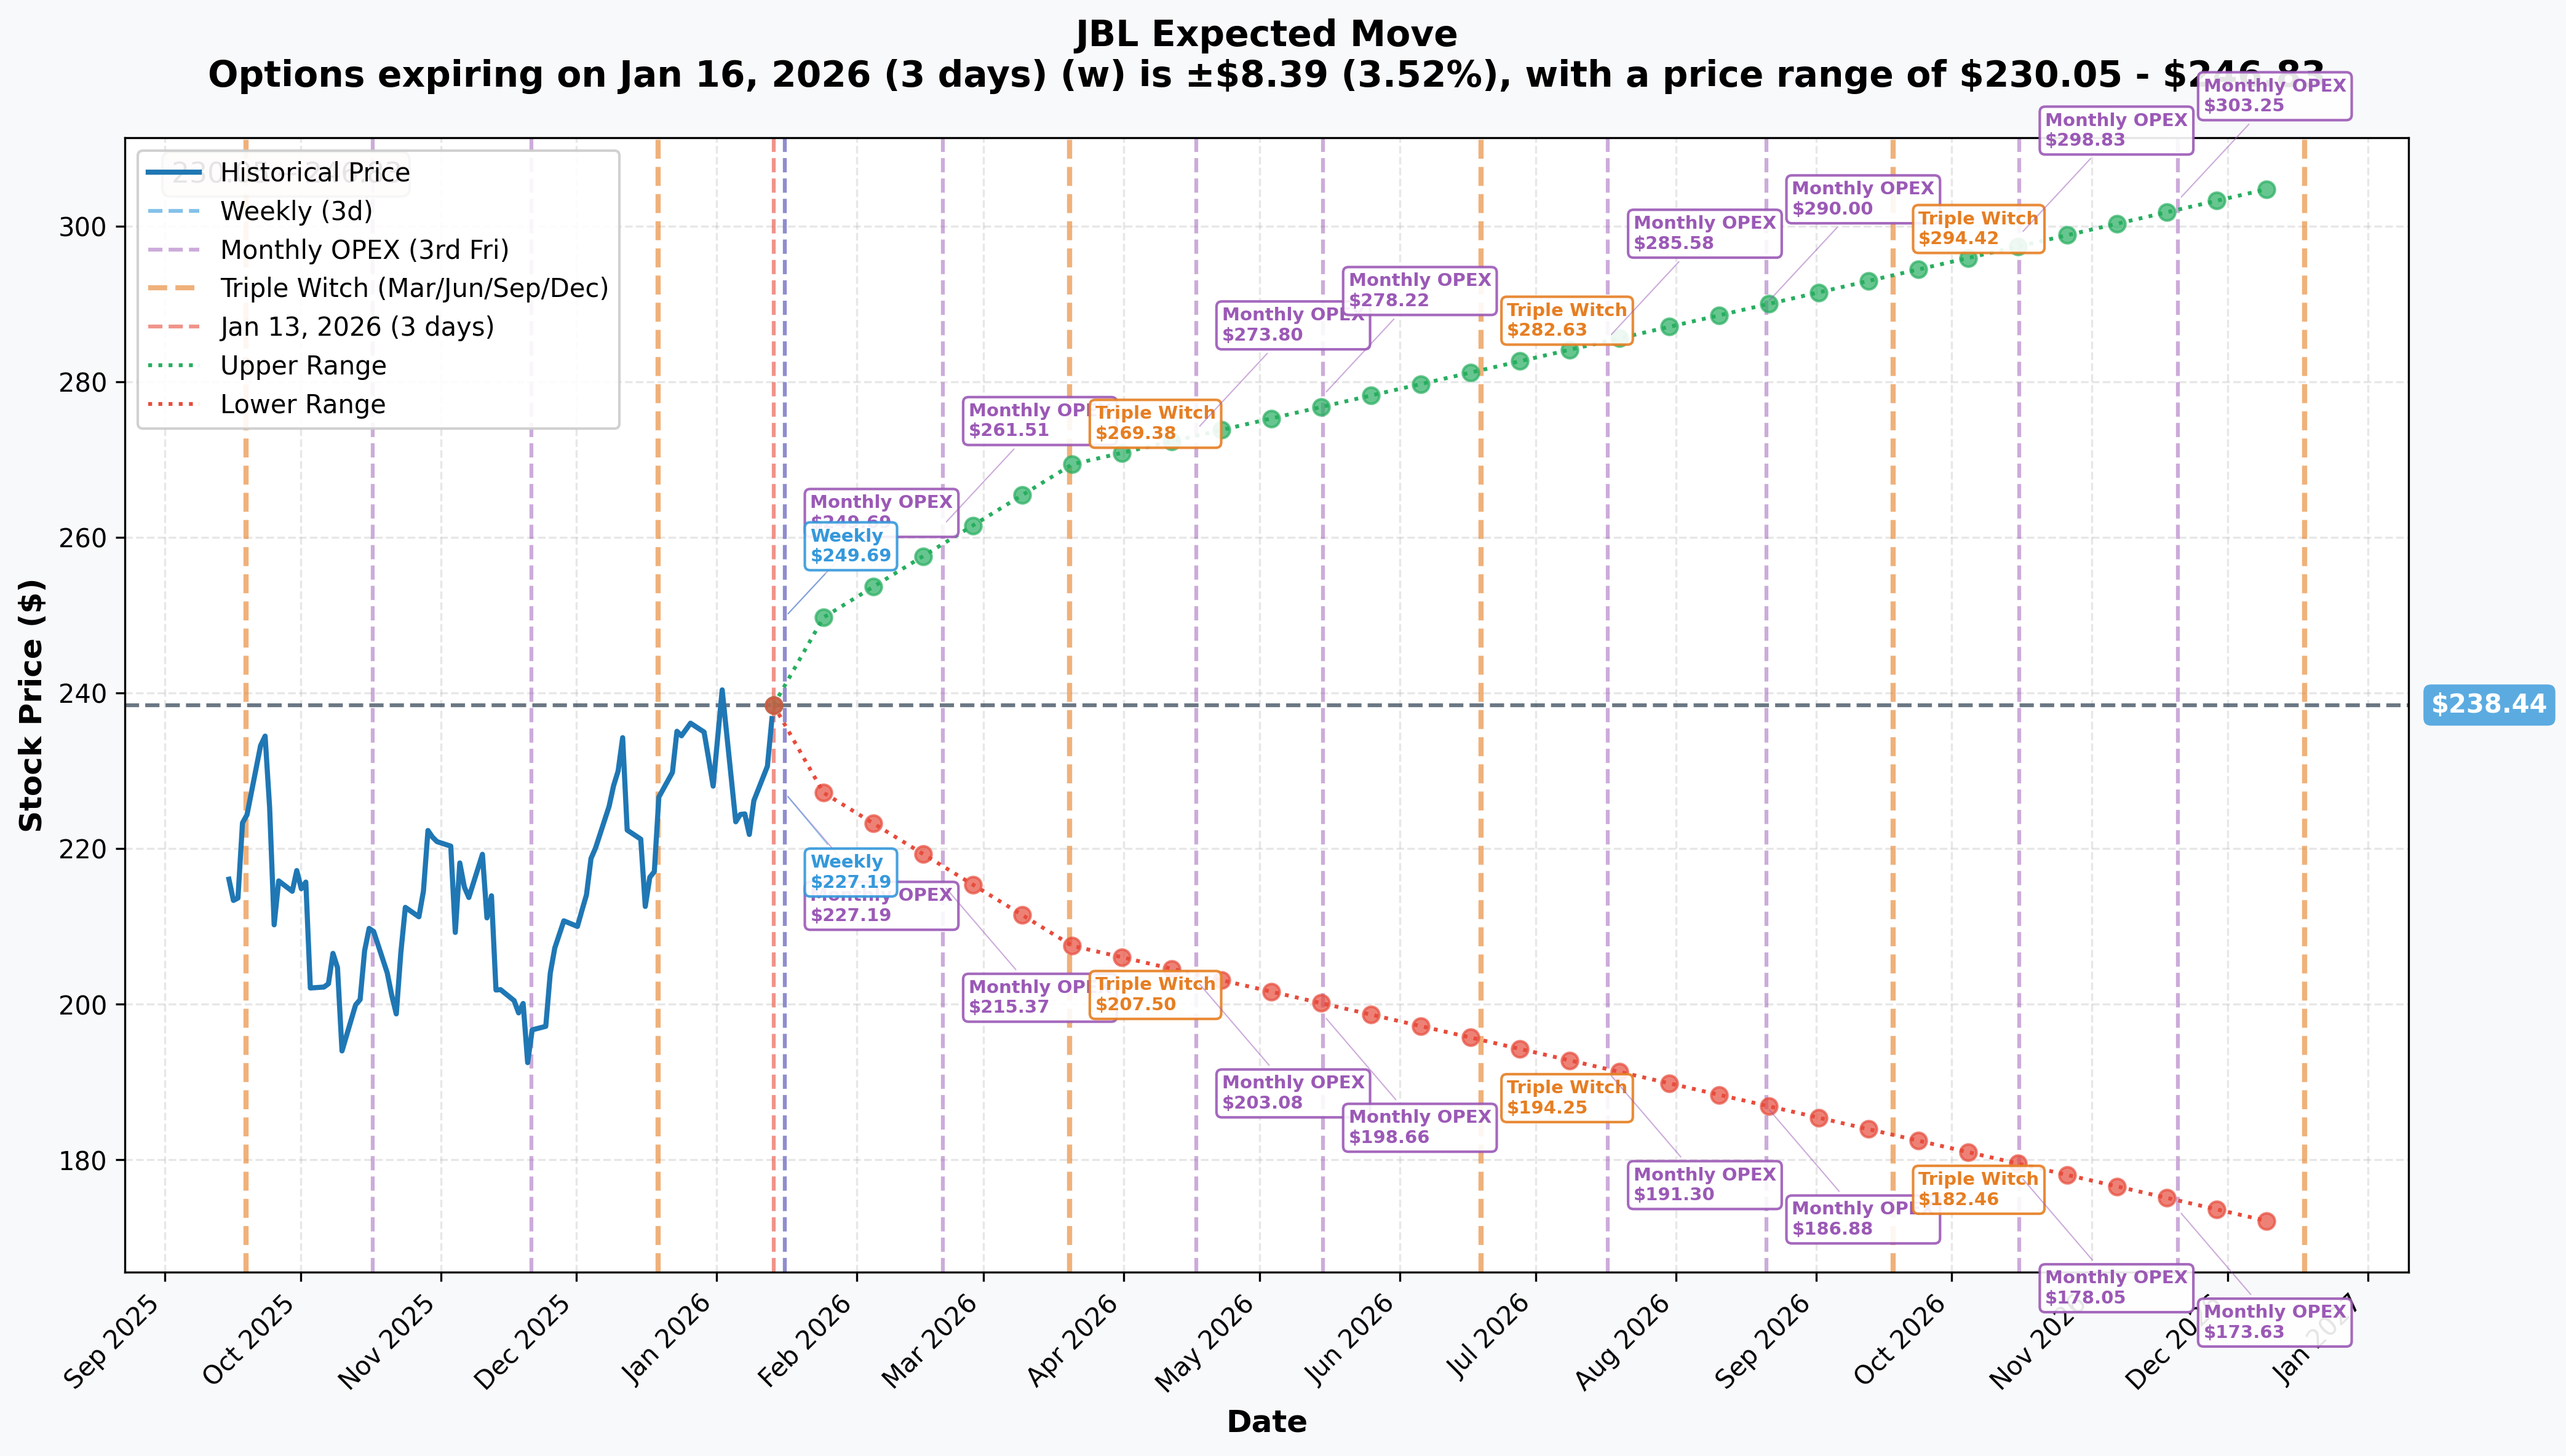
The options market is pricing the following expected moves:
| Timeframe | Expiry | Implied Move | Upper Range | Lower Range |
|---|---|---|---|---|
| Weekly | 2026-01-16 | 3.52% | $246.83 | $230.05 |
| Monthly | 2026-02-20 | 9.7% | $261.51 | $215.37 |
| Quarterly | 2026-03-20 | 12.98% | $269.38 | $207.50 |
Key Insight: The Feb 20 expiration (where 3 of 4 legs are positioned) implies the market expects JBL could move between $215-$261. The trader's structure profits best if JBL stays in the $230-$250+ zone - right in line with market expectations.
Catalysts
Upcoming Events
-
Q2 FY2026 Earnings - Expected March 2026
- Guidance: Revenue $7.5-8.0B, Core EPS $2.27-2.67
- Intelligent Infrastructure segment projected +42% YoY
- Source: Investing.com
-
Salisbury, NC AI Facility - Mid-2026
- $500M investment in AI/cloud infrastructure manufacturing
- Source: Jabil Investor Relations
Recent Catalysts (Already Happened)
-
Q1 FY2026 Earnings Beat - December 17, 2025
- Revenue: $8.31B vs $8.07B consensus (+$240M beat)
- Core EPS: $2.85 vs $2.70 consensus
- Intelligent Infrastructure: +54% YoY growth
- Source: BusinessWire
-
Hanley Energy Acquisition Completed - January 2, 2026
- $725M deal to bolster data center power management
- Adds $350-400M projected annual revenue
- Source: BusinessWire
-
Raised FY2026 Guidance
- Revenue raised to $32.4B (from $31.3B)
- Core EPS raised to $11.55 (from $11.00)
- AI revenue projection: $12.1B (+35% YoY)
- Source: Tokenist
Price Targets & Probabilities
Based on gamma levels, implied move data, and catalyst timing:
Bull Case: $260-$270 (15-20% probability by Feb 20)
- Break above $250 resistance triggers momentum buying
- JP Morgan price target at $270 (raised Jan 2, 2026)
- Requires AI demand narrative to accelerate
- Source: Investing.com
Base Case: $235-$250 (55-60% probability by Feb 20)
- Stock consolidates between gamma support/resistance
- In line with implied move expectations
- Trader's structure maximally profitable in this range
Bear Case: $210-$225 (20-25% probability by Feb 20)
- Breaks below $230 support triggers hedging flows
- Insider selling ($16M in past month) creates negative sentiment
- Connected Living segment continues to drag (-11% Q2 outlook)
- Source: Markets Daily
Trading Ideas
Conservative: "Sleep Well" Put Credit Spread
Structure: Sell $220/$210 put spread (Feb 20 expiry)
- Max profit: ~$0.50-0.70 credit per spread
- Max risk: $9.30-9.50 per spread
- Breakeven: ~$219
- Why it works: JBL has strong support at $220-$230. You're getting paid to bet the stock doesn't fall 10%+ in 5 weeks. The institutional trader essentially did this as part of their structure.
Balanced: Defined Risk Call Spread
Structure: Buy $240/$260 call spread (Feb 20 expiry)
- Estimated cost: ~$6.00-7.00
- Max profit: $13.00-14.00 if JBL above $260
- Breakeven: ~$246-247
- Why it works: Participate in upside if JBL pushes toward new highs without paying full premium for naked calls. Limited downside to cost of spread.
Aggressive: Follow the Whale
Structure: Buy $250 calls (Feb 20 expiry)
- Estimated cost: ~$6.85 (based on today's trades)
- Break-even: $256.85
- Max profit: Unlimited above $257
- Why it works: The institutional trader bought 3,100 of these. If they're right about continued AI momentum, you ride the same wave. High risk/reward setup.
Risk Factors
- Valuation Stretched: P/E of 32.5x vs industry average of 25.5x - priced for perfection
- Insider Selling: Chairman sold $16M worth of stock in past month near highs
- Customer Concentration: Top 3 customers represent ~35% of revenue
- Tariff Exposure: ~$360B in electronic tariffs affect supply chain
- Segment Weakness: Connected Living segment declining 11% YoY
- Capacity Utilization: Only 75% vs 85% historical average
The Bottom Line
Real talk: An institutional desk just deployed $8.6M on a sophisticated options structure that says they expect JBL to hold the $230 floor while having room to run toward $250+. This isn't a gamble - it's a calculated position with defined risk and multiple profit scenarios.
Action Plan:
- If you're bullish: The Feb 20 $240/$260 call spread offers defined risk participation in continued AI-driven momentum
- If you're watching: Wait for a pullback to $230 gamma support for a better entry; that's where the big money placed their protective puts
- If you're cautious: The insider selling and stretched valuation warrant skepticism; consider waiting for Q2 earnings clarity in March
Mark your calendar: Q2 FY2026 earnings in March is the next major catalyst. The Feb 20 options expire before then, so this trade is about riding momentum into earnings anticipation, not the event itself.
Unusualness Score: 8.5/10
The Z-scores on these trades (ranging from 58x to 435x normal volume) indicate this is genuinely rare institutional activity - not everyday flow. Volume-to-open-interest ratios exceeding 50x on multiple strikes suggest these are almost certainly new positions being established.
Disclaimer: Options trading involves substantial risk and is not appropriate for all investors. The information provided is for educational purposes only and should not be considered investment advice. Past performance does not guarantee future results. Always do your own research and consider your risk tolerance before trading.
For more options flow analysis, visit Ainvest.