MNDY $9.8M Put Closing - Institutional Player Exits Pre-Earnings Protection!
February 5, 2026 | Unusual Activity Detected
The Quick Take
Someone just closed out $9.8 MILLION in MNDY puts at 10:38:58! This institutional trader bought-to-close 2,938 contracts of the $130 strike puts expiring February 20th - unwinding downside protection just 4 days before Monday.com's critical Q4 2025 earnings on February 9th. With MNDY trading at $98.25 (down ~60% from 52-week highs of $342.64), this massive position exit suggests the institutional player believes the worst may be priced in - or they're rotating capital elsewhere ahead of the earnings catalyst.
Company Overview
Monday.com Ltd. (MNDY) is a leading work management platform that enables teams to collaborate more effectively across organizations:
- Market Cap: $5.4 Billion
- Industry: Software-as-a-Service (SaaS) / Work Management
- Current Price: $98.25 (near 52-week low of $95.08)
- 52-Week High: $342.64
- Primary Business: SaaS platform for project management, workflow automation, and team collaboration
- Customer Base: Over 245,000 customers globally
- Business Model: Per-seat subscription pricing across multiple tiers
The Option Flow Breakdown
What Just Happened
The Tape (February 5, 2026 @ 10:38:58):
| Date | Time | Symbol | Buy/Sell | Type | Expiration | Premium | Strike | Volume | OI | Size | Spot | Option Price |
|---|---|---|---|---|---|---|---|---|---|---|---|---|
| 2026-02-05 | 10:38:58 | MNDY | BUY | PUT $130 | 2026-02-20 | $9.8M | $130 | 2,900 | 3,200 | 2,938 | $98.25 | $33.20 |
Trade Classification Details:
| Metric | Value |
|---|---|
| Order Type | Buy-to-Close (BTC) |
| Confidence | MEDIUM |
| Z-Score | 6.84 |
| Z Classification | EXTREMELY_UNUSUAL |
| Volume/OI Ratio | 0.906 (HIGH_ACTIVITY) |
| Strategy Type | Closing Put (STANDALONE) |
What This Actually Means
This is a position exit - someone closing out existing put protection! Here's the breakdown:
- Massive premium paid to close: $9.8M ($33.20 per contract x 2,938 contracts)
- Deep in-the-money puts: $130 strike is 32.3% above current stock price of $98.25
- Strategic timing: 4 days before Q4 earnings (February 9th) and 15 days to expiration
- Size matters: 2,938 contracts represents 293,800 shares worth ~$28.9M of downside protection
- Volume/OI ratio of 0.906: Nearly all open interest traded - this is a full position exit
What's really happening here:
This trader likely established put protection weeks or months ago when MNDY was trading significantly higher. With the stock now down ~60% from 52-week highs and sitting near 52-week lows at $98.25, these $130 puts are now deep in-the-money with $31.75 of intrinsic value. The trader is locking in profits on what was likely a defensive hedge that paid off handsomely during the selloff.
The timing is interesting - closing BEFORE earnings rather than waiting to see if the stock drops further suggests either:
- The trader believes the bottom is in and wants to take profits before a potential earnings bounce
- They're rotating capital to other opportunities
- They're reducing exposure to time decay (theta) on the remaining 15 days
Unusual Score: EXTREMELY UNUSUAL (Z-Score: 6.84) - This type of activity happens only a few times per year. A Z-score above 6 indicates the trade size is roughly 6+ standard deviations above normal activity levels - institutional-grade positioning.
Technical Setup / Chart Check-Up
YTD Performance Chart
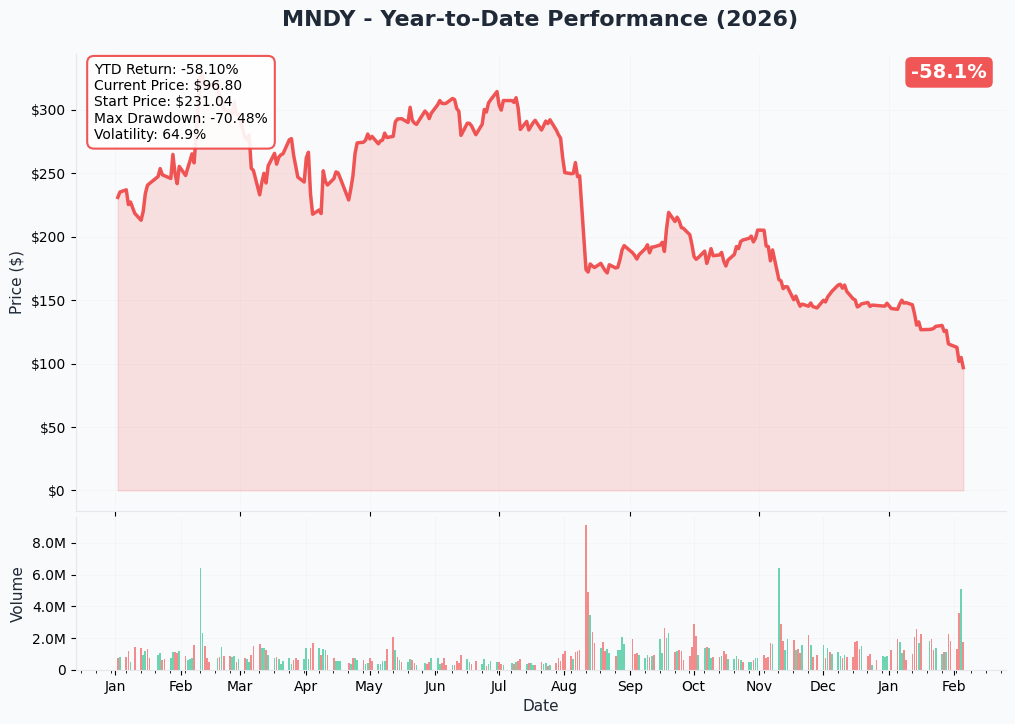
MNDY has been absolutely crushed - trading at $98.25 after falling roughly 60% from the 52-week high of $342.64. The stock has been battered by growth deceleration fears, AI disruption concerns, and a brutal SaaS sector rotation despite strong fundamentals.
Key observations:
- Approaching 52-week low of $95.08 - critical support zone
- Massive drawdown from October 2025 highs
- Volume likely elevated as weak hands capitulate
- Near-term oversold conditions possible given extent of selloff
- Earnings on February 9th could serve as the "clearing event" Morgan Stanley notes
Gamma-Based Support & Resistance Analysis
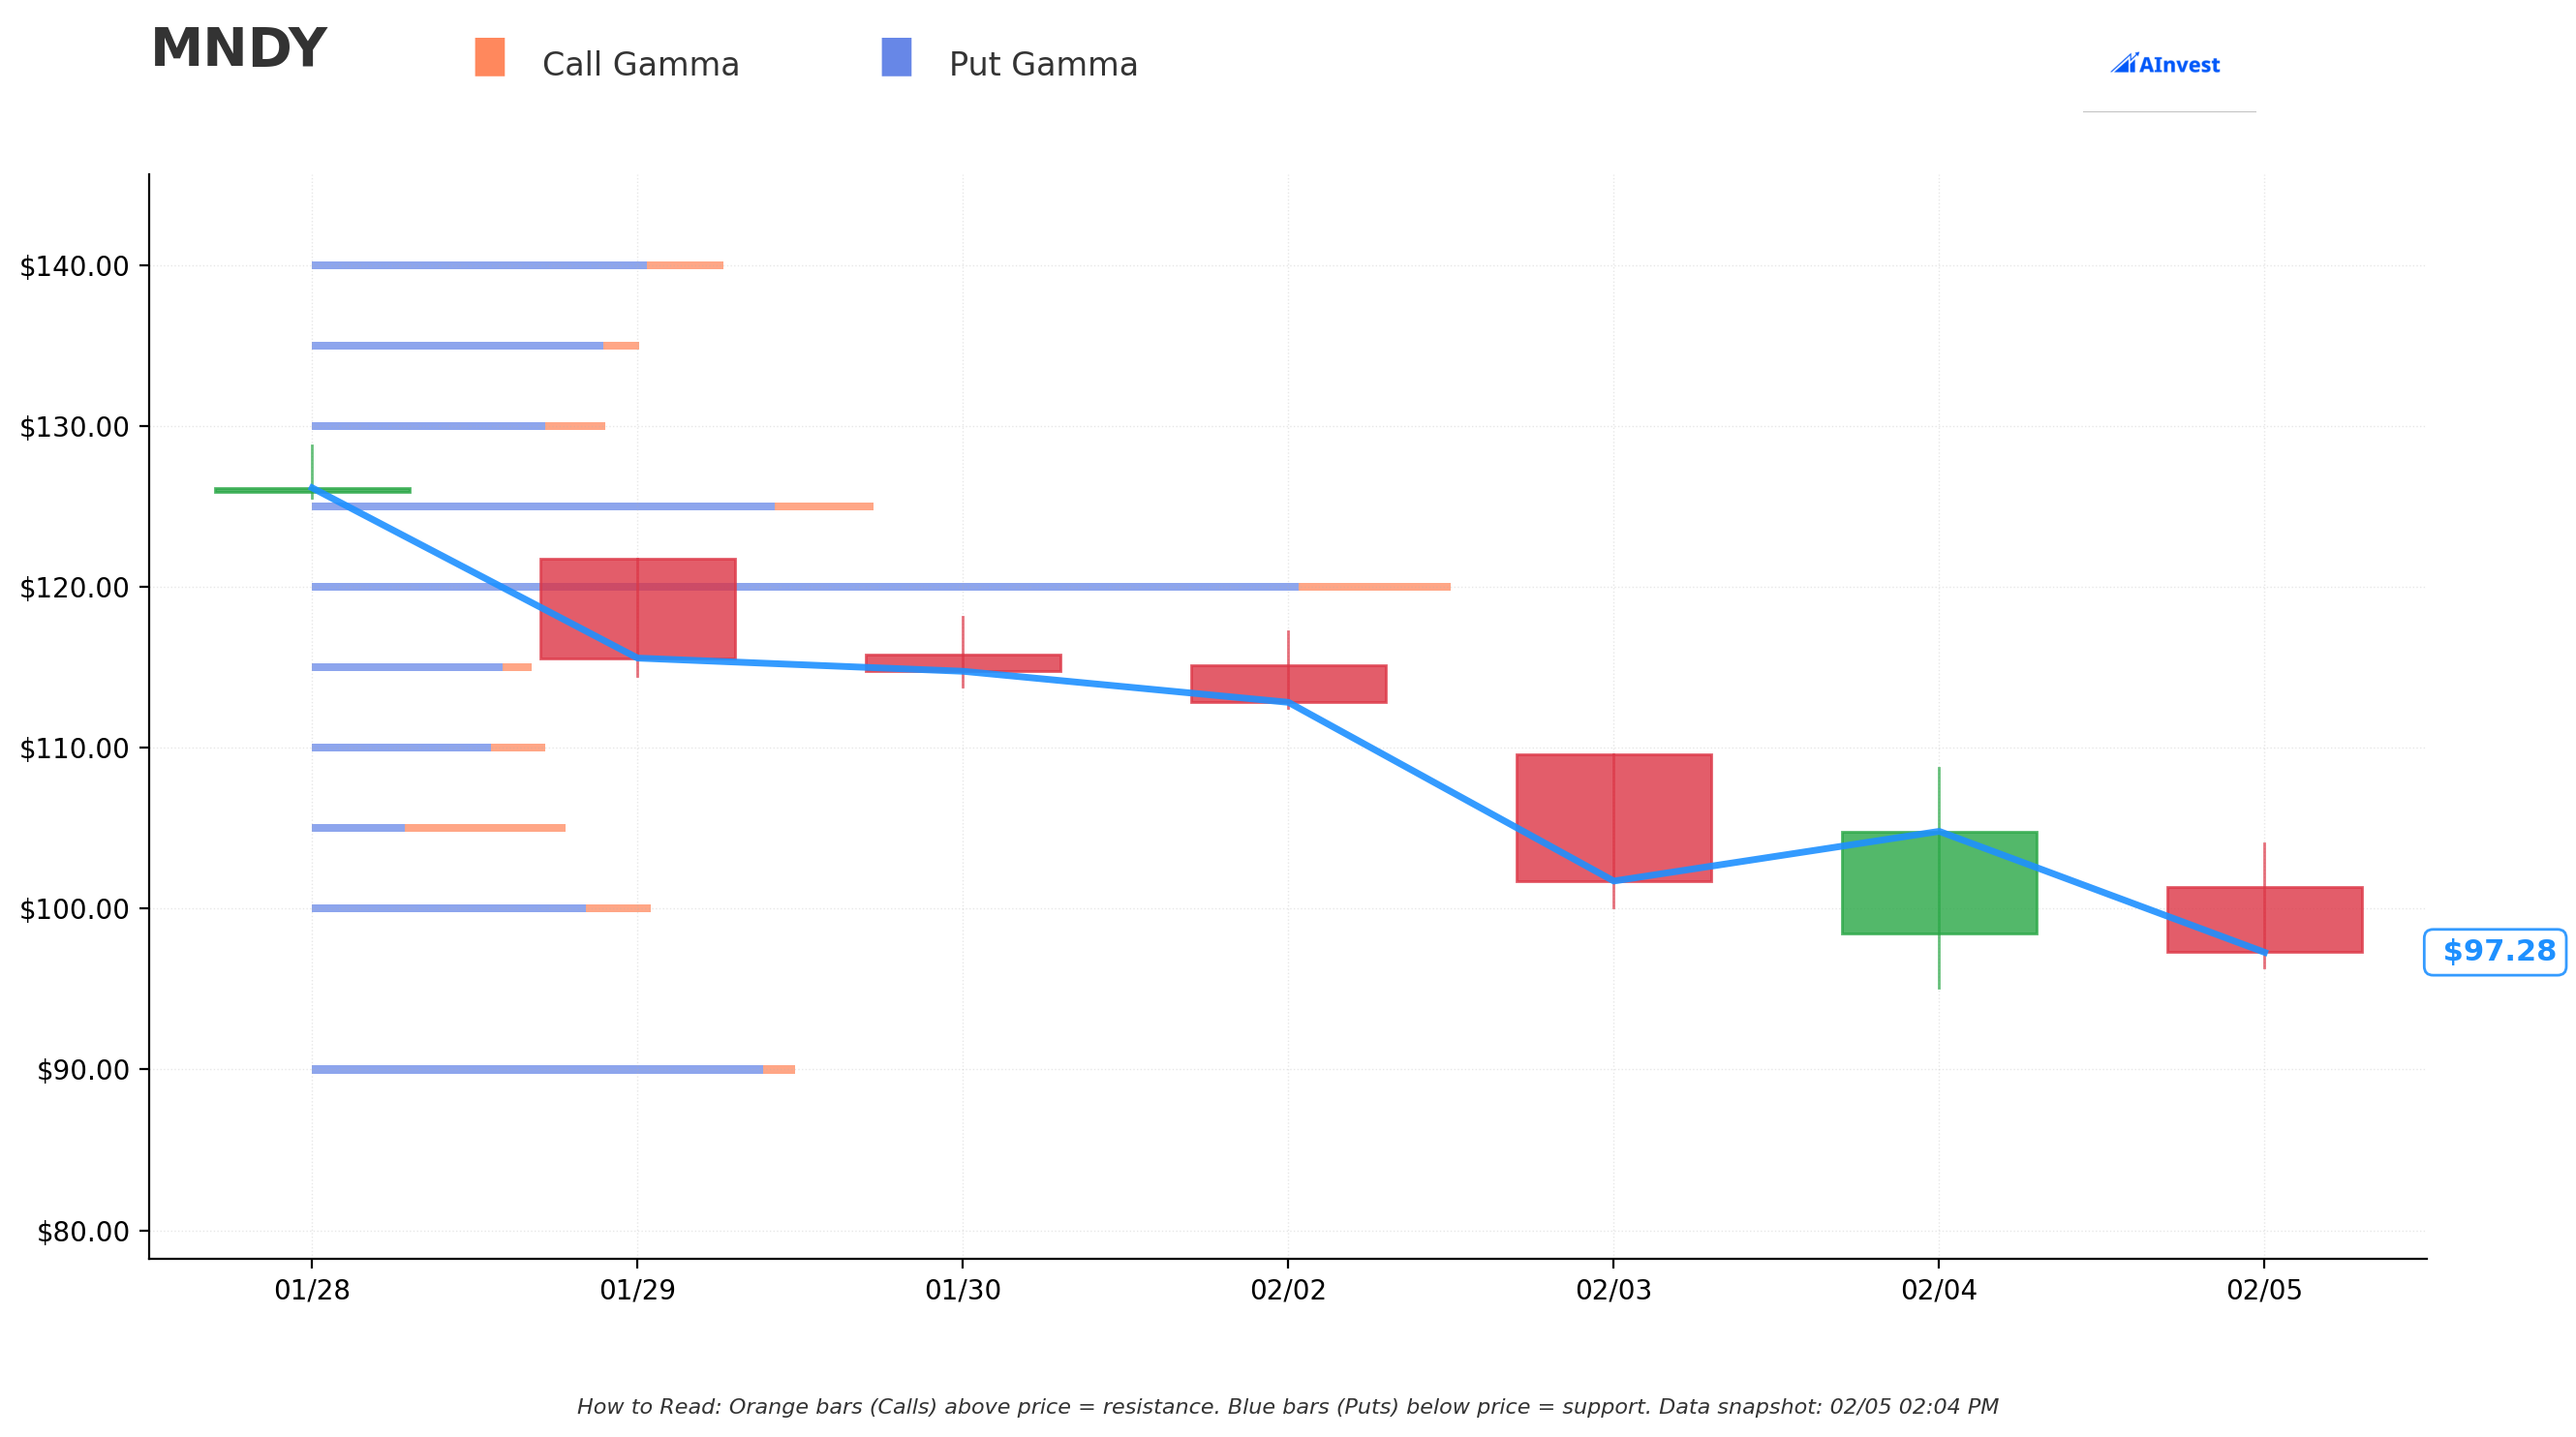
Current Price: $97.21
The gamma exposure map reveals critical price magnets and barriers that will govern near-term price action:
Support Levels (Put Gamma Below Price):
- $95 - Immediate support with 3.5% total gamma exposure (closest floor, 2.3% below current)
- $90 - Major structural floor with 22.6% gamma (strongest put support - 7.4% below current)
- $85 - Secondary support at 2.5% gamma (12.6% below current)
- $80 - Deep disaster support at 4.5% gamma (17.7% below current)
Resistance Levels (Call Gamma Above Price):
- $100 - Immediate ceiling with 15.7% total gamma exposure (psychological resistance, 2.9% above)
- $105 - First major resistance at 11.7% gamma (8% above current)
- $110 - Secondary resistance at 10.9% gamma (13.2% above)
- $115 - Extended upside target at 10.2% gamma (18.3% above)
What this means for traders:
MNDY is trading in a critical zone between $95 support and $100 psychological resistance. The gamma data shows:
- Strongest support at $90 with 22.6% gamma concentration - this is the LINE IN THE SAND
- $100 psychological resistance with 15.7% gamma will require catalyst to break
- Net GEX Bias: Bearish (Total Put GEX: 1.66 vs Total Call GEX: 0.94)
The bearish gamma bias suggests dealers are positioned defensively, which typically creates selling pressure on rallies and buying pressure on dips. With earnings in 4 days, a break of either $95 support or $100 resistance could trigger accelerated moves.
Notice the trade structure: The put buyer who opened these positions chose $130 strike - way above current trading levels. This was protection established when the stock was trading much higher (likely $140-180 range), now being closed as the thesis played out.
Implied Move Analysis
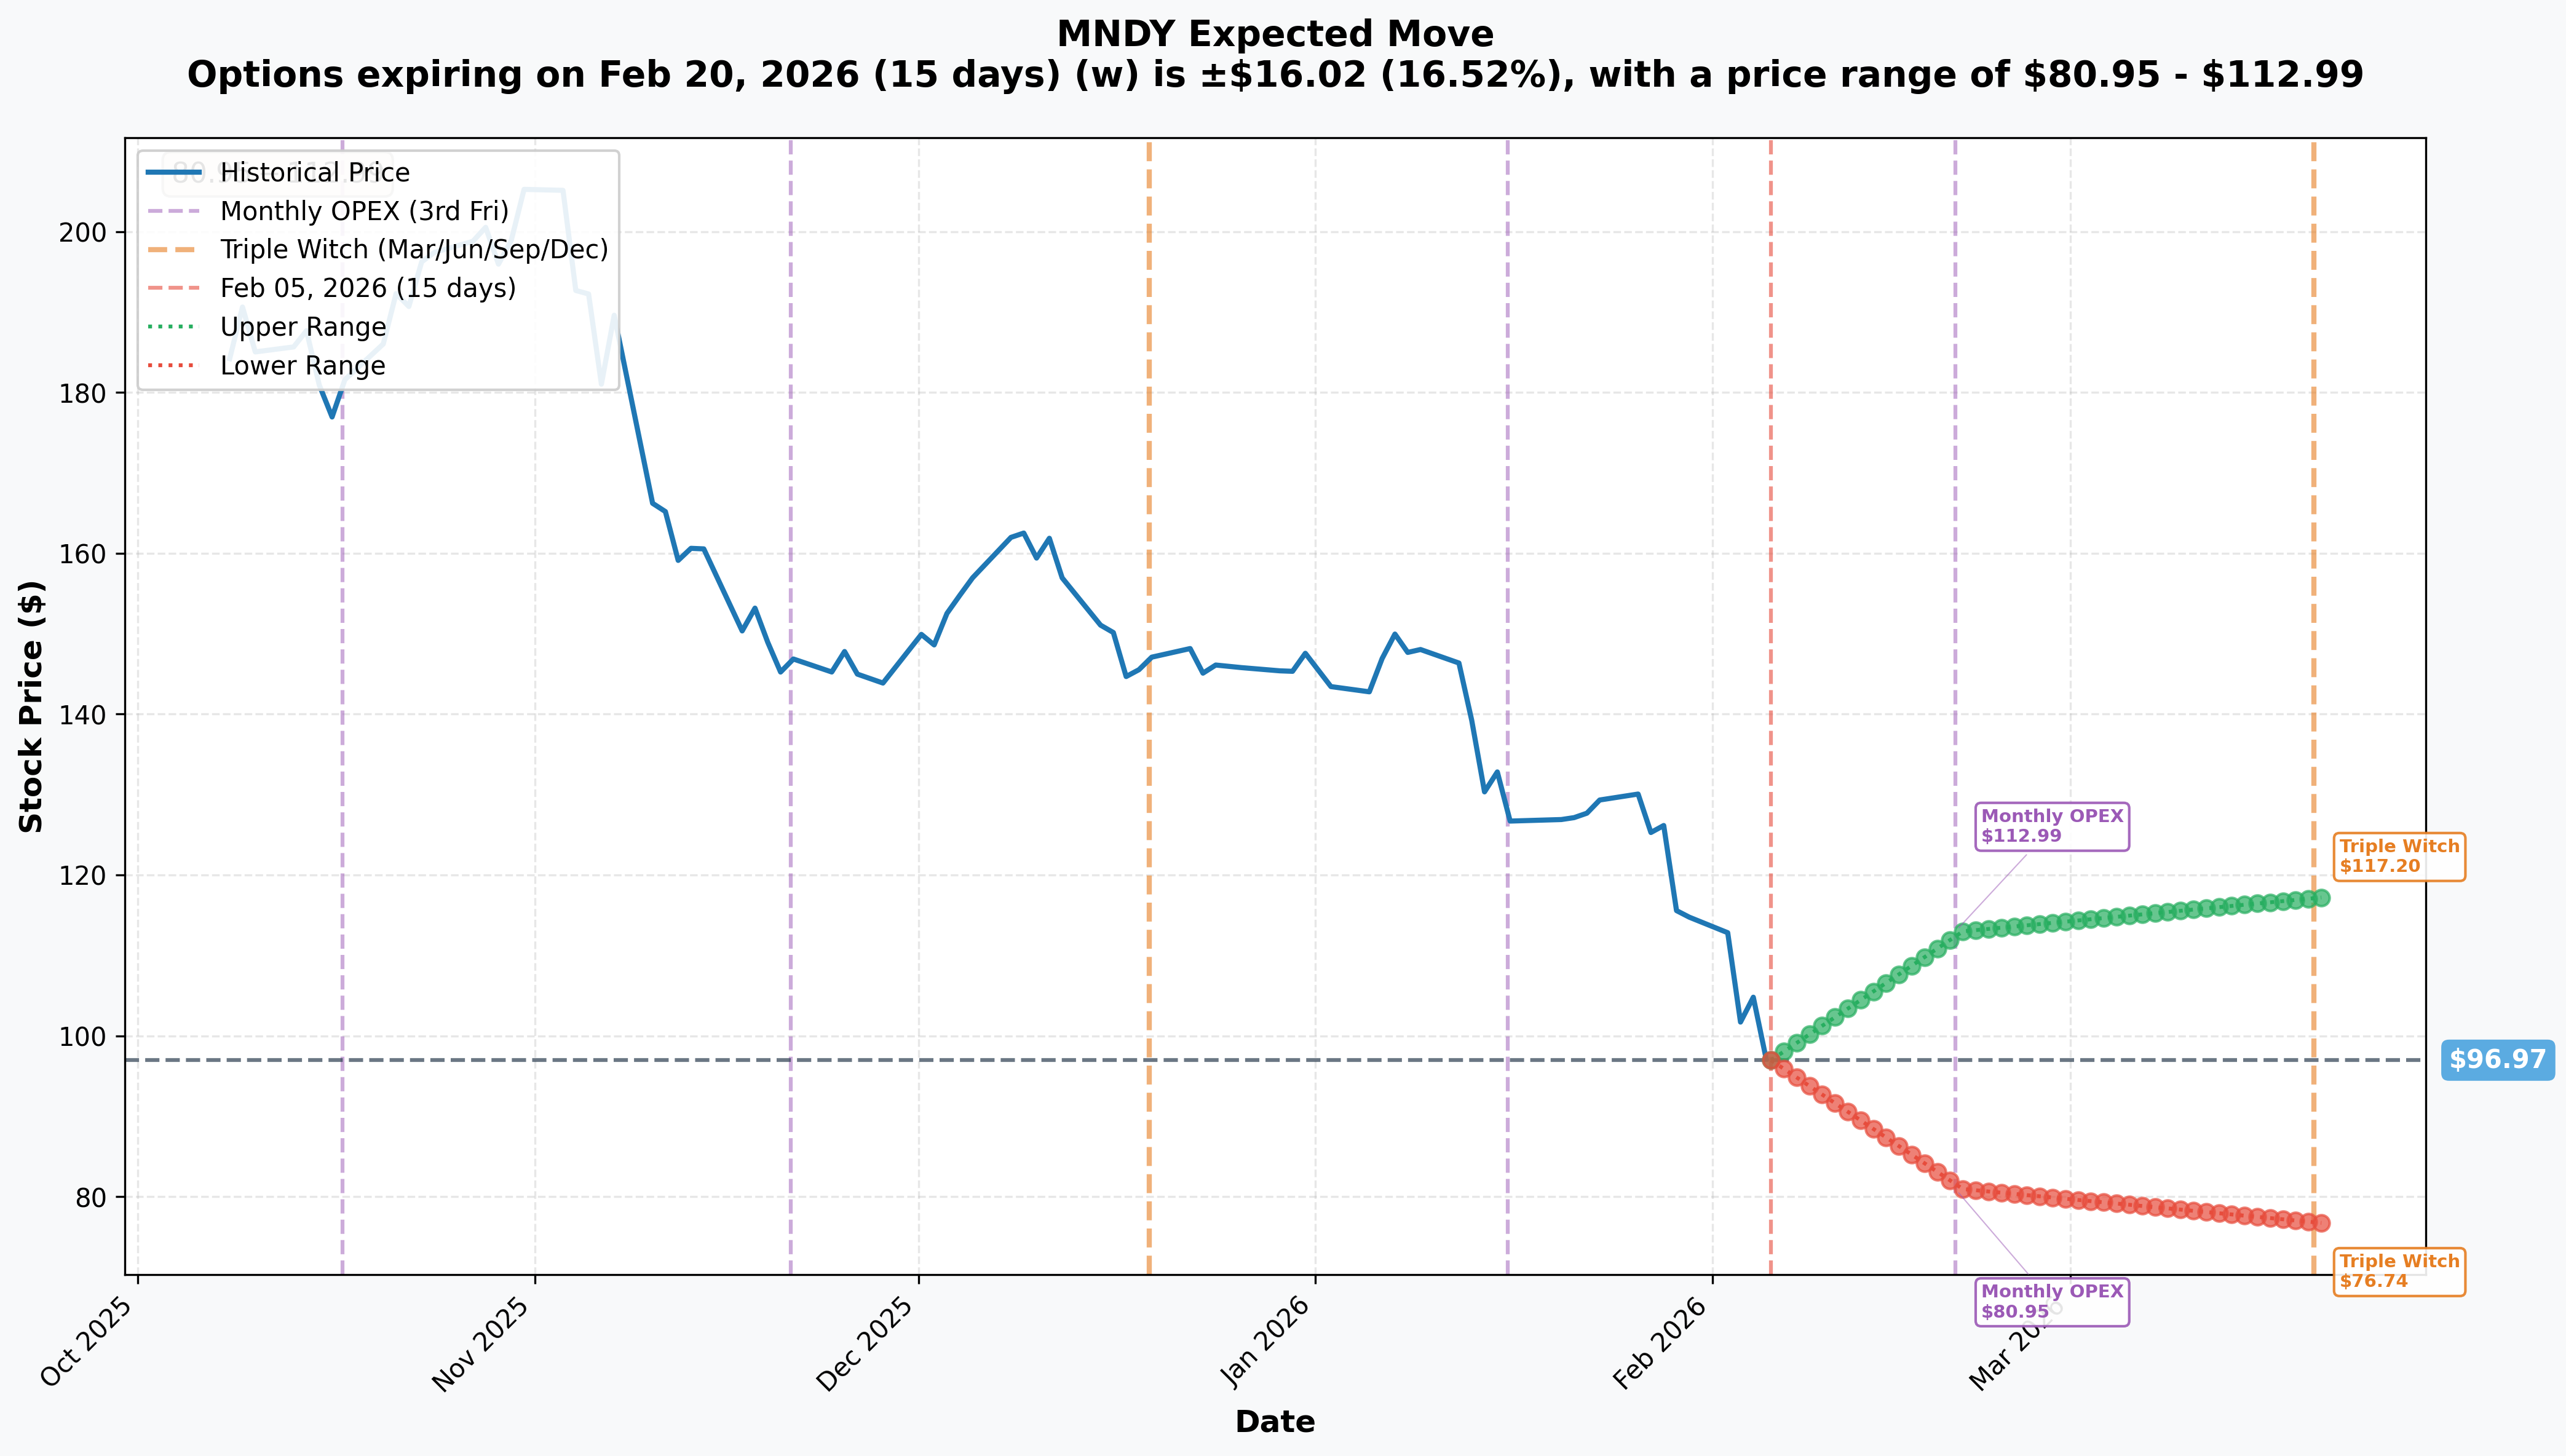
Options market pricing for upcoming expirations:
- Monthly OPEX (Feb 20 - 15 days): +/-$16.02 (+/-16.52%) - Range: $80.95 - $112.99
- Quarterly Triple Witch (Mar 20 - 43 days): +/-$20.23 (+/-20.86%) - Range: $76.74 - $117.20
Translation for regular folks:
Options traders are pricing in a MASSIVE 16.5% move (+/-$16) through February OPEX which includes earnings on February 9th. For a $5.4B market cap stock, this is significant expected volatility - the market expects FIREWORKS around earnings!
Key insight: The implied move range of $80.95 - $112.99 through February 20th means:
- Bull case: Stock could rally to $113 (15% upside from current)
- Bear case: Stock could drop to $81 (17.5% downside from current)
- This aligns with the gamma support at $90 and resistance at $105-110
The institutional player closing these puts may believe the $80-85 downside scenario is less likely now, hence taking profits before time decay erodes remaining value.
Catalysts
Immediate Catalysts (4 DAYS AWAY!)
Q4 2025 Earnings Release - February 9, 2026 (Business Wire)
This is THE catalyst that could make or break the recent bottom. Wall Street expectations:
| Metric | Consensus Estimate |
|---|---|
| Revenue | $328-330 million |
| EPS | $0.92 |
Key Focus Areas:
- FY2026 revenue guidance - analysts concerned may be below consensus
- Q1 2026 outlook
- Enterprise customer growth trajectory (currently 48% YoY growth in >$100K ARR customers)
- AI product adoption metrics (monday Expert launching March 2026)
- Net dollar retention trends (117% for enterprise customers)
Critical Context: Morgan Stanley explicitly notes that "2026 guidance likely to serve as clearing event" for the stock. BofA Securities has flagged concerns that potential revenue guidance for 2026 may fall below market expectations.
Near-Term Catalysts (Q1-Q2 2026)
monday Expert AI Agent Launch - March 2026 (VentureBeat)
Monday.com's first AI agent is scheduled for launch next month:
- Help onboard new users to the platform
- Build solutions for specific user needs autonomously
- Create relevant workflows, boards, and automations based on plain English descriptions
- Critical test of AI monetization strategy
AI Agent Ecosystem Expansion (H1 2026)
Beyond monday Expert, planned specialized AI agents for:
- Analyzing project risks
- Unlocking stuck sales deals
- Identifying recurring customer service issues
Recent Catalysts (Past 3 Months)
Q3 2025 Earnings Results (November 10, 2025) (Monday.com IR)
Strong Q3 results that exceeded expectations:
| Metric | Q3 2025 | Q3 2024 | YoY Change |
|---|---|---|---|
| Revenue | $316.9M | $251.5M | +26% |
| Operating Income | $47.5M | $32.2M | +47% |
| Operating Margin | 15% | 13% | +200 bps |
| Net Income | $61.9M | $45.0M | +38% |
Enterprise Customer Traction:
- Customers >$50K ARR: 3,993 (+37% YoY), representing 40% of total ARR
- Customers >$100K ARR: 1,603 (+48% YoY), representing 27% of total ARR
- Net dollar retention for enterprise: 117%
Triple Gartner Magic Quadrant Leadership (Monday.com PR, Additional Source)
Monday.com achieved an unprecedented milestone - the ONLY work management platform recognized as a Leader in THREE 2025 Gartner Magic Quadrant reports:
- Collaborative Work Management (3rd consecutive year)
- Adaptive Project Management and Reporting (4th consecutive year)
- Marketing Work Management Platforms
Analyst Activity (November 2025 - February 2026):
Multiple analysts reduced price targets while maintaining positive ratings (Stock Analysis):
| Firm | New PT | Previous PT | Rating |
|---|---|---|---|
| Canaccord Genuity | $190 | $230 | Buy |
| Morgan Stanley | $200 | $236 | - |
| KeyCorp | $220 | $270 | Overweight |
| Barclays | $194 | $202 | Overweight |
| BofA Securities | $157 | - | - |
Current Consensus: 27 Buy ratings, 4 Hold ratings, 0 Sell ratings with average price target of $237.68 - implying ~129% upside from current levels.
Price Targets & Probabilities
Using gamma levels, implied move data, and upcoming catalysts, here are the scenarios through February 20th expiration:
Bull Case (30% probability)
Target: $110-$117
How we get there:
- Q4 earnings BEAT on revenue ($330M+) and EPS ($0.95+)
- FY2026 guidance meets or exceeds consensus expectations
- monday Expert AI launch receives positive early reception
- Enterprise customer metrics continue strong trajectory (>50% growth in $100K+ ARR)
- Short covering rally as stock has been heavily pressured
- Break above $100 psychological resistance triggers momentum to $105-110 gamma resistance zone
- Triple Witch implied move upper bound: $117.20
Probability assessment: 30% because despite strong fundamentals, the market is clearly worried about growth deceleration and AI disruption. Stock would need to reclaim significant technical levels and earnings guidance must be solid.
Base Case (45% probability)
Target: $90-$105 range (CHOPPY CONSOLIDATION)
Most likely scenario:
- Solid earnings meeting consensus (~$328-330M revenue, $0.92 EPS)
- FY2026 guidance slightly disappointing but not catastrophic
- Stock bounces off $95 support, faces resistance at $100-105
- Market digests news, waits for AI product execution proof points
- Implied volatility crushes post-earnings, reducing option premiums
- Trading range-bound between gamma support ($90-95) and resistance ($100-105)
This aligns with the closing trade: The institutional player closing puts may believe the $90 floor holds and stock consolidates in this zone post-earnings rather than breaking to new lows.
Bear Case (25% probability)
Target: $80-$90 (TEST THE LOWS)
What could go wrong:
- FY2026 guidance significantly below consensus (confirming deceleration fears)
- AI monetization strategy unclear or timeline pushed out
- Enterprise customer growth slows below 30% YoY
- Microsoft competitive pressure intensifies
- Break below $95 triggers cascade to $90 gamma floor
- Break below $90 opens path to $80-85 disaster scenario
- Implied move lower bound: $80.95
Probability assessment: 25% because stock has already declined 60% - much bad news priced in. However, if guidance disappoints significantly, there's still room for 15-20% further downside.
Trading Ideas
Conservative: Wait-and-See Through Earnings
Play: Stay on sidelines until after February 9th earnings clears
Why this works:
- Binary earnings event in 4 DAYS creates extreme uncertainty
- Implied volatility at 16.5%+ move expected - too dangerous to position ahead
- Stock at 52-week lows but could still drop 15%+ on bad guidance
- Better entry likely post-earnings once IV crushes and direction clarifies
- The institutional put closing suggests smart money reducing exposure - follow their lead
Action plan:
- Watch February 9th earnings closely for: FY2026 guidance (critical), enterprise customer metrics, AI product commentary
- Look for pullback to $90 gamma support OR breakout above $105 for entry signal
- If stock drops to $85-90 zone with solid fundamentals, consider accumulating
- If stock rallies above $105 on guidance beat, consider momentum entry
Risk level: Minimal (cash position) | Skill level: Beginner-friendly
Balanced: Post-Earnings Call Spread (If Stock Rallies)
Play: After earnings, if stock bounces, sell call spread for income
Structure: Sell $110/$120 call spread (March 20 expiration) if stock rallies to $100-105 post-earnings
Why this works:
- Captures elevated IV post-earnings even after crush
- $110 strikes sits at gamma resistance level
- Defined risk ($10 wide = $1,000 max risk per spread)
- Takes advantage of expected consolidation in $90-110 range
- Time decay works in your favor over 43 days to Triple Witch
Estimated P&L:
- Collect ~$2.50-3.50 net credit per spread (adjust based on post-earnings IV)
- Max profit: Credit received if MNDY stays below $110
- Max loss: $6.50-7.50 if MNDY above $120
- Breakeven: ~$112.50-113.50
Entry timing:
- Wait 1-2 days post-earnings for IV to settle
- Only enter if stock trading $100-108 range (gives room to work)
- Skip if stock already above $110 or below $95
Risk level: Moderate (defined risk, neutral-bearish) | Skill level: Intermediate
Aggressive: Earnings Strangle (Bet on Volatility)
Play: Buy strangle betting on post-earnings move exceeding implied
Structure: Buy $90 puts + $110 calls (February 20 expiration)
Why this could work:
- Implied move is 16.5% but earnings could easily generate 20%+ move
- FY2026 guidance is make-or-break catalyst (Morgan Stanley "clearing event")
- Stock at inflection point near 52-week lows - could explode either direction
- If guidance disappoints: stock tests $80 (implied lower bound)
- If guidance beats: stock rallies to $113+ (implied upper bound)
Critical Risks:
- EXPENSIVE: Strangle likely costs $12-15 ($1,200-1,500 per strangle)
- IV CRUSH: Even with 15% move, IV collapse could result in loss
- Need 18-20%+ move to profit after IV crush factored in
- Time decay burns quickly with only 15 days to expiration
Estimated P&L:
- Cost: ~$12-15 per strangle
- Profit scenario: Stock moves to $75 or $120 (20%+ move) = $5-10 gain
- Loss scenario: Stock ends $88-108 range = lose $6-12 (50-80% loss)
- Total loss: Stock flat at $98 = lose entire premium
Risk level: EXTREME (can lose 100% of premium) | Skill level: Advanced only
Risk Factors
Don't get caught by these potential landmines:
-
Earnings binary event in 4 days: Results Monday February 9th create MASSIVE volatility risk. FY2026 guidance is the key variable - Morgan Stanley explicitly calls it a "clearing event". Stock could gap 15%+ either direction based on guidance quality.
-
Growth deceleration concerns: Revenue growth has been solid at 26% YoY, but analysts are worried about potential slowdown. Cantor Fitzgerald trimmed 2026 revenue estimates by 1.5%. Any guidance miss could confirm deceleration thesis.
-
Valuation still stretched: Despite 60% decline, MNDY still trades at P/E ratio of 118.8x compared to estimated fair ratio of 43.6x. Premium valuation requires flawless execution.
-
AI disruption threat: SaaS companies face existential questions about AI disruption. While MNDY is investing heavily in AI capabilities (monday Expert, monday magic, monday sidekick), monetization strategy remains unclear.
-
Microsoft competitive pressure: Microsoft's bundled work management solutions (Teams, Planner, Project) benefit from distribution advantage. As AI becomes standard across productivity software, MNDY faces pressure to differentiate.
-
Broader SaaS headwinds: Median SaaS revenue growth fell to 12.2% by Q4 2025 with forecasts pointing to further slowdown. Industry-wide headwinds could pressure MNDY regardless of execution.
-
Technical breakdown risk: Stock trading near 52-week low of $95.08. Break below this level could trigger accelerated selling to $90 gamma support, then potentially $80-85 if sentiment deteriorates further.
-
Institutional exit signal: The $9.8M put closing we're analyzing suggests sophisticated money is reducing exposure ahead of earnings. When institutions take profits on hedges rather than maintaining protection, it could signal uncertainty about near-term direction.
The Bottom Line
Real talk: Someone just closed out $9.8 MILLION in MNDY put protection 4 days before the most critical earnings report of the year. This isn't necessarily bullish or bearish - it's a sophisticated player locking in gains on a hedge that paid off during MNDY's 60% decline from highs.
What this trade tells us:
- Deep in-the-money $130 puts with $31.75 intrinsic value being closed = profit-taking
- Timing (4 days pre-earnings) suggests reduced conviction in further downside OR desire to avoid time decay
- The 0.906 volume/OI ratio means this was nearly a FULL position exit
- Z-score of 6.84 (EXTREMELY UNUSUAL) indicates significant institutional activity
This is NOT a "buy the dip" signal - it's a "hedge unwinding" that requires context.
If you own MNDY:
- Earnings Monday February 9th is make-or-break
- Set mental stop at $90 (major gamma support) to protect remaining value
- Consider trimming if stock rallies to $105-110 resistance zone pre-earnings
- FY2026 guidance is THE variable - consensus expects ~20% growth
If you're watching from sidelines:
- Monday February 9th after close is the moment of truth - DO NOT enter before earnings
- Post-earnings pullback to $85-90 would be EXCELLENT entry (gamma support + implied move lower bound)
- Looking for confirmation of: FY2026 guidance meeting expectations, enterprise customer momentum, AI product execution timeline
- Current analyst consensus of $237.68 implies 129% upside - but only if execution delivers
If you're bearish:
- Wait for earnings before initiating shorts - stock already down 60%
- First support at $95 (52-week low), major support at $90 (gamma floor)
- Post-earnings put spreads ($95/$85 or $90/$80) offer defined-risk way to play downside
- Watch for break below $90 - that triggers cascade to $80-85
Mark your calendar - Key dates:
- February 9 (Monday) - Q4 FY2025 earnings report (4 DAYS!)
- February 10 (Tuesday) - Post-earnings price action and analyst reactions
- February 20 - Monthly OPEX (current put trade expiration, +/-16.5% implied move window closes)
- March 2026 - monday Expert AI agent launch
- March 20 - Quarterly Triple Witch (+/-20.9% implied move)
- October 28-29, 2026 - Elevate 2026 Conference at Javits Center, NYC
Final verdict: MNDY's long-term story remains compelling - 26% revenue growth, 117% enterprise net dollar retention, triple Gartner Magic Quadrant leadership, and aggressive AI roadmap. BUT, with FY2026 guidance concerns looming and stock at critical technical levels near 52-week lows, the risk/reward is NOT favorable for new positioning ahead of earnings.
The $9.8M institutional put closing signals smart money is taking profits on protection - but that doesn't mean you should rush in. Let earnings clear. Let the "clearing event" happen. If guidance beats, you'll have plenty of time to enter on the breakout. If guidance disappoints, you'll get a better entry at $85-90.
Be patient. The SaaS revolution will still be here next week. Your capital won't be if you gamble on a 50/50 earnings coin flip.
Disclaimer: Options trading involves substantial risk of loss and is not suitable for all investors. This analysis is for educational purposes only and not financial advice. Past performance doesn't guarantee future results. The Z-score of 6.84 reflects this specific trade's unusual size relative to recent MNDY history - it does not imply the trade will be profitable or that you should follow it. Always do your own research and consider consulting a licensed financial advisor before trading. Earnings create binary event risk with potential for 15%+ gaps either direction.
About Monday.com Ltd.: Monday.com provides a work management platform that enables teams to collaborate more effectively. Their SaaS-based solution lets organizations track project progress, build automated workflows, and handle approval processes. The company serves over 245,000 customers globally with a market cap of $5.4 billion.