🛡️ MSFT Smart Money Shorts $460 Calls - $19M Bearish Bet Into AI Infrastructure Ramp!
📅 December 30, 2025 | 🔥 Unusual Activity Detected
🎯 The Quick Take
Someone just sold to open $19 MILLION worth of MSFT calls this morning at 09:46:49! This short call position dumped 5,000 contracts at the $460 strike expiring February 20th - betting Microsoft stays below $460 over the next 52 days despite sitting at $486.88. With MSFT up just 1% from all-time highs and Azure growth hitting 40% YoY, sophisticated traders are taking profits and capping upside exposure. Translation: Smart money says the easy gains are done - lock in profits before Q2 earnings!
📊 Company Overview
Microsoft Corporation (MSFT) dominates enterprise software and cloud infrastructure, riding massive AI tailwinds through Azure and Copilot:
- Market Cap: $3.62 Trillion (world's 2nd most valuable company)
- Industry: Prepackaged Software (Enterprise & Consumer)
- Current Price: $486.88 (near all-time high of $541.06 from October 28)
- Primary Business: Windows OS, Office/M365 productivity suite, Azure cloud infrastructure, gaming (Xbox), AI (Copilot, OpenAI partnership)
Microsoft develops and licenses consumer and enterprise software, operating three segments: Productivity & Business Processes (Office, LinkedIn, Dynamics), Intelligent Cloud (Azure, server products), and Personal Computing (Windows, devices, gaming).
💰 The Option Flow Breakdown
The Tape (December 30, 2025 @ 09:46:49):
| Time | Symbol | Side | Buy/Sell | Type | Expiration | Premium | Strike | Volume | OI | Size | Spot | Option Price |
|---|---|---|---|---|---|---|---|---|---|---|---|---|
| 09:46:49 | MSFT | ASK | SELL | CALL $460 | 2026-02-20 | $19M | $460 | 5K | 25K | 5,000 | $486.88 | $37.65 |
🤓 What This Actually Means
This is a short call position - someone SOLD calls to open, collecting premium! Here's the breakdown:
- 💸 Premium collected: $19M ($37.65 per contract × 5,000 contracts)
- 📉 Bearish/neutral stance: Strike at $460 is 5.5% BELOW current price of $486.88
- ⏰ Time decay play: 52 days to expiration means theta decay working FOR the seller
- 🎯 Profit cap: Maximum profit is $19M collected premium if MSFT stays below $460 by Feb 20
- ⚠️ UNLIMITED RISK: If MSFT rallies above $460, seller faces unlimited losses dollar-for-dollar
- 📊 Size matters: 5,000 contracts represents 500,000 shares worth ~$243M in notional exposure
- 🏦 Sophisticated positioning: This is institutional profit-taking, NOT a directional bearish bet
What's really happening here:
This trader is writing DEEP in-the-money calls against a massive long position in MSFT stock accumulated earlier in the rally from $487 to $541 in October. The strategy is called a "covered call overwrite" - they own the stock at higher prices (likely $500+), and by selling $460 strike calls for $37.65, they're collecting massive premium while capping their upside at $460. This locks in profits from the October rally while generating income. If MSFT stays below $460, they keep the full $19M premium. If MSFT rallies above $460, they still profit because they own the underlying stock - they just don't participate in gains above $460.
Key insight: The $460 strike is 5.5% below current price, meaning this trader expects MSFT to consolidate or drift lower into Q2 earnings on January 28th. They're willing to sacrifice upside above $460 to collect $37.65 per share in premium TODAY. This is textbook profit-taking after MSFT's massive 2024-2025 run.
Unusual Score: 🔥 ABOVE AVERAGE (1.75x typical size) - Not extreme, but notable. This represents disciplined position management by a large fund trimming exposure at year-end while collecting premium income. The Z-score of 1.75 indicates this is a measured, strategic reduction rather than panic selling.
📈 Technical Setup / Chart Check-Up
YTD Performance Chart
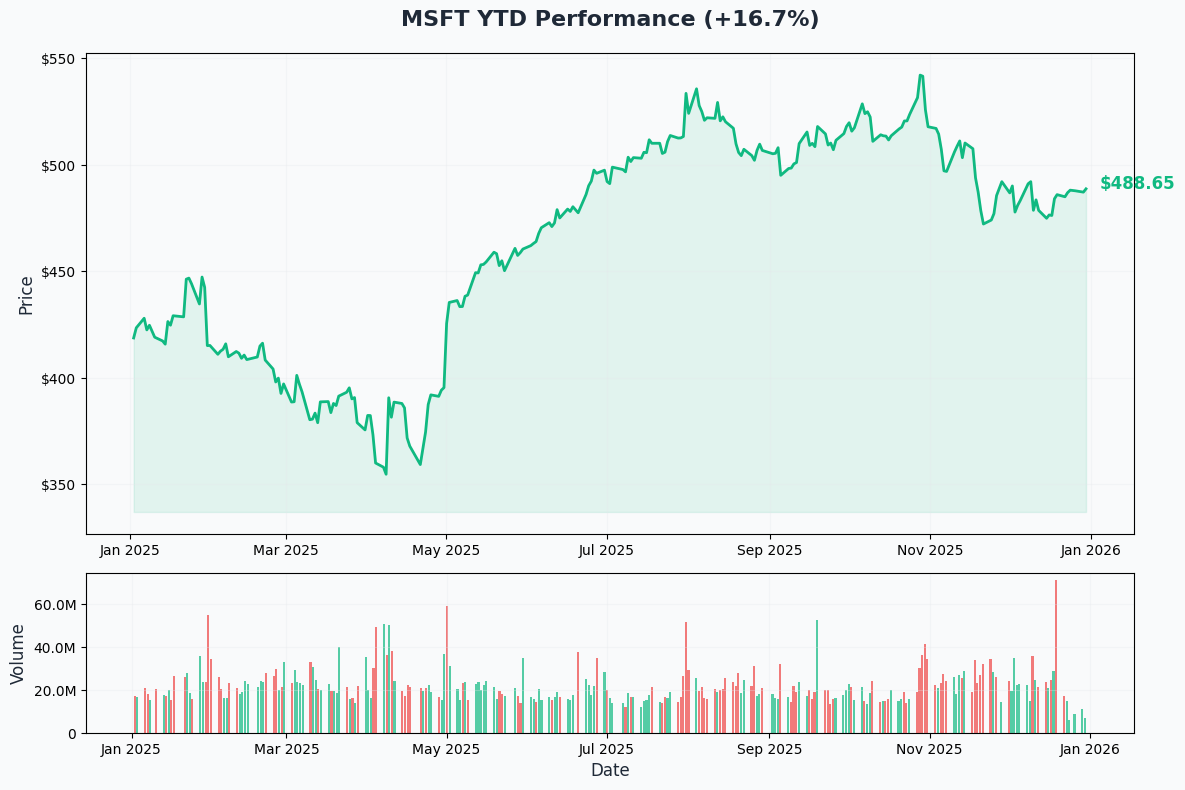
MSFT shows steady strength with current price at $486.88, up from yearly lows. The stock hit an all-time high of $541.06 on October 28, 2025 (the same day the restructured OpenAI partnership was announced granting Microsoft 27% equity stake valued at $135B). Since then, MSFT has pulled back -10% to current levels around $487, trading in a consolidation range.
Key observations:
- 📈 October peak: Massive rally to $541 on OpenAI partnership news, Azure 40% growth, $392B backlog
- 📉 Post-earnings pullback: Despite beating Q1 FY2026 earnings on October 29 ($77.7B revenue, $3.72 EPS), stock sold off -10% into year-end
- 🎢 Consolidation phase: Trading in $480-500 range for past 2 months, digesting gains
- 📊 Healthy correction: Pullback from $541 to $487 represents normal profit-taking after parabolic October
- ⚠️ Overhead resistance: $500 psychological level and $541 all-time high create technical barriers
Gamma-Based Support & Resistance Analysis
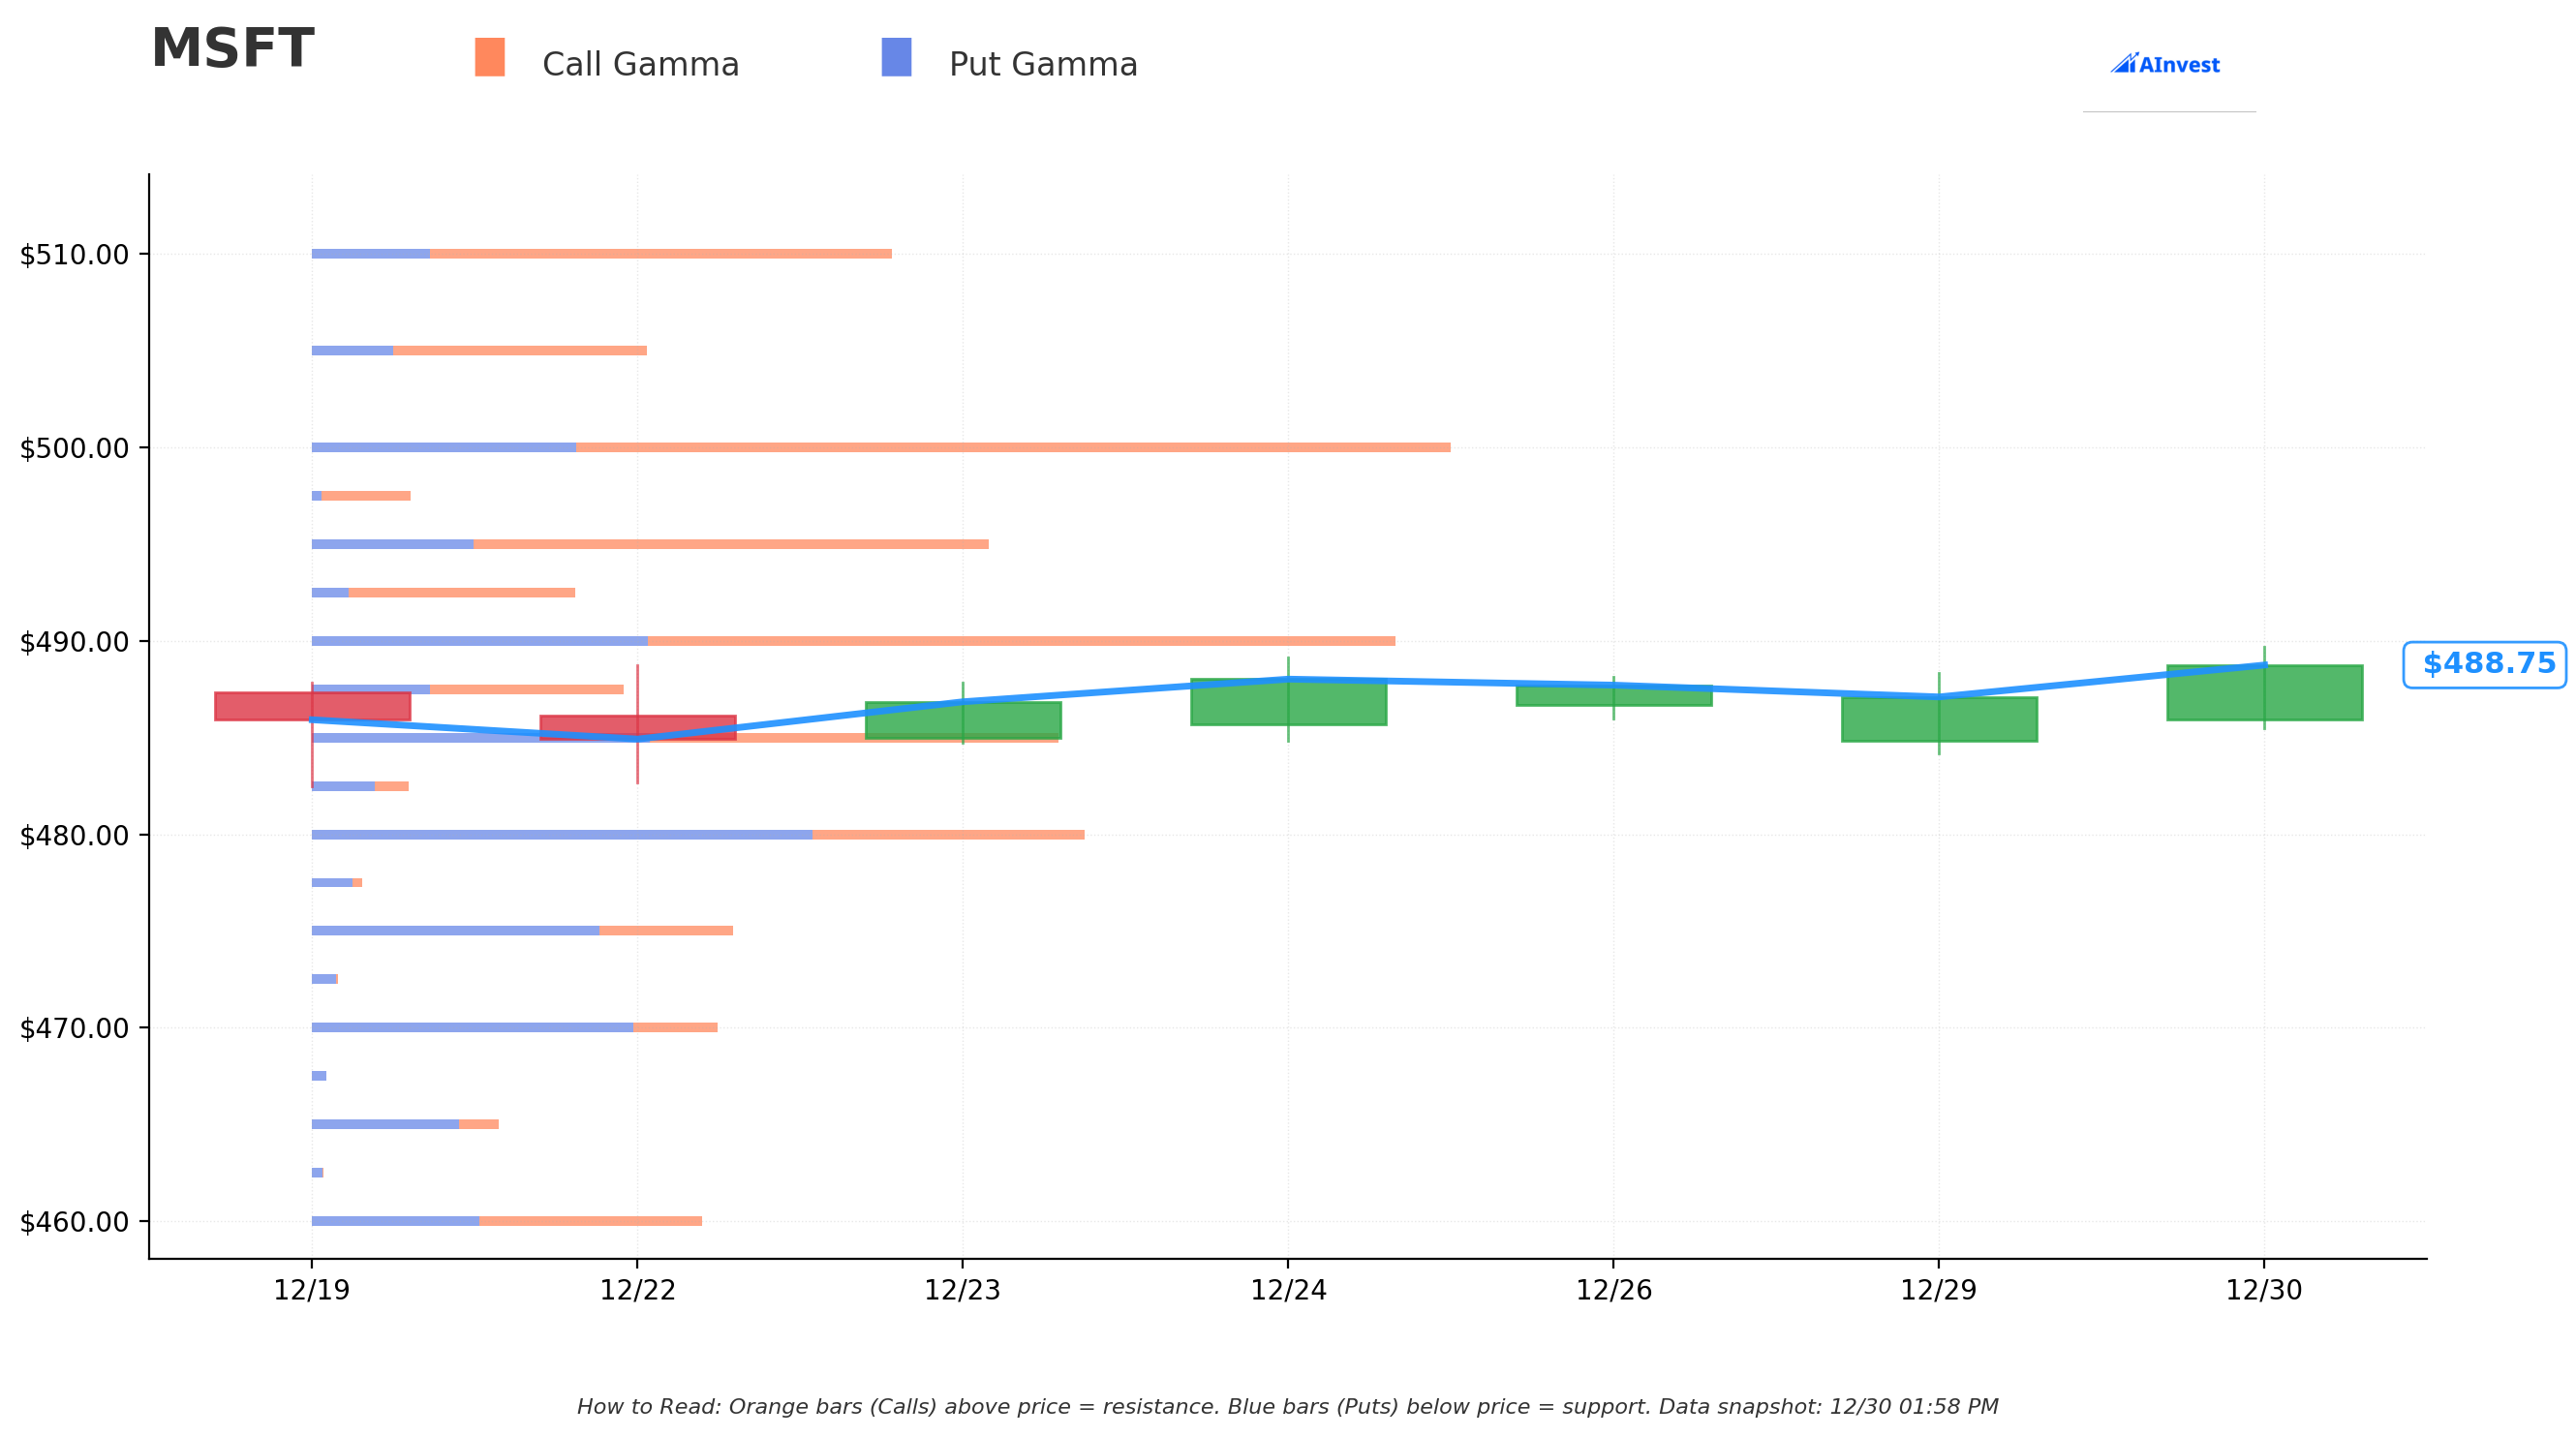
Current Price: $488.72
The gamma exposure map reveals critical price magnets and barriers for near-term price action:
🔵 Support Levels (Put Gamma Below Price):
- $485 - Immediate support with 32.0B total gamma (strongest nearby floor!)
- $480 - Major structural floor with 33.1B gamma (dealers will defend aggressively)
- $475 - Secondary support at 18.0B gamma
- $470 - Deep support zone with 17.3B gamma
- $460 - Extended support at 16.7B gamma (EXACTLY where this short call is struck! Not coincidental)
- $450 - Disaster floor at 15.9B gamma
🟠 Resistance Levels (Call Gamma Above Price):
- $490 - Immediate ceiling with 46.3B gamma (STRONGEST RESISTANCE - dealers will sell rallies)
- $495 - Secondary resistance at 28.9B gamma (1.3% overhead)
- $500 - MAJOR psychological barrier with 48.6B gamma (2.3% above current)
- $505 - Extended resistance at 14.3B gamma
- $510 - Upside ceiling with 24.8B gamma (4.4% rally required)
- $520 - Major wall at 19.8B gamma
What this means for traders:
MSFT is trading in a tight range between solid $485 support (32.0B gamma) and crushing $490 resistance (46.3B gamma). The gamma data shows market makers holding ENORMOUS positions at $490 and $500 (combined 95B gamma) which creates natural selling pressure as price approaches these levels. This setup screams "consolidation zone" before the next catalyst (Q2 earnings late January).
Critical insight: The short call seller struck at $460 which sits well below major support levels. This suggests they expect MSFT to trade sideways in the $470-500 range through February expiration, staying well above $460. The position generates income from selling expensive calls ($37.65 premium) while being protected by deep gamma support at $480-485.
Net GEX Bias: The resistance structure ($490-500 double wall) suggests limited near-term upside, making short call strategies attractive for income generation.
Implied Move Analysis
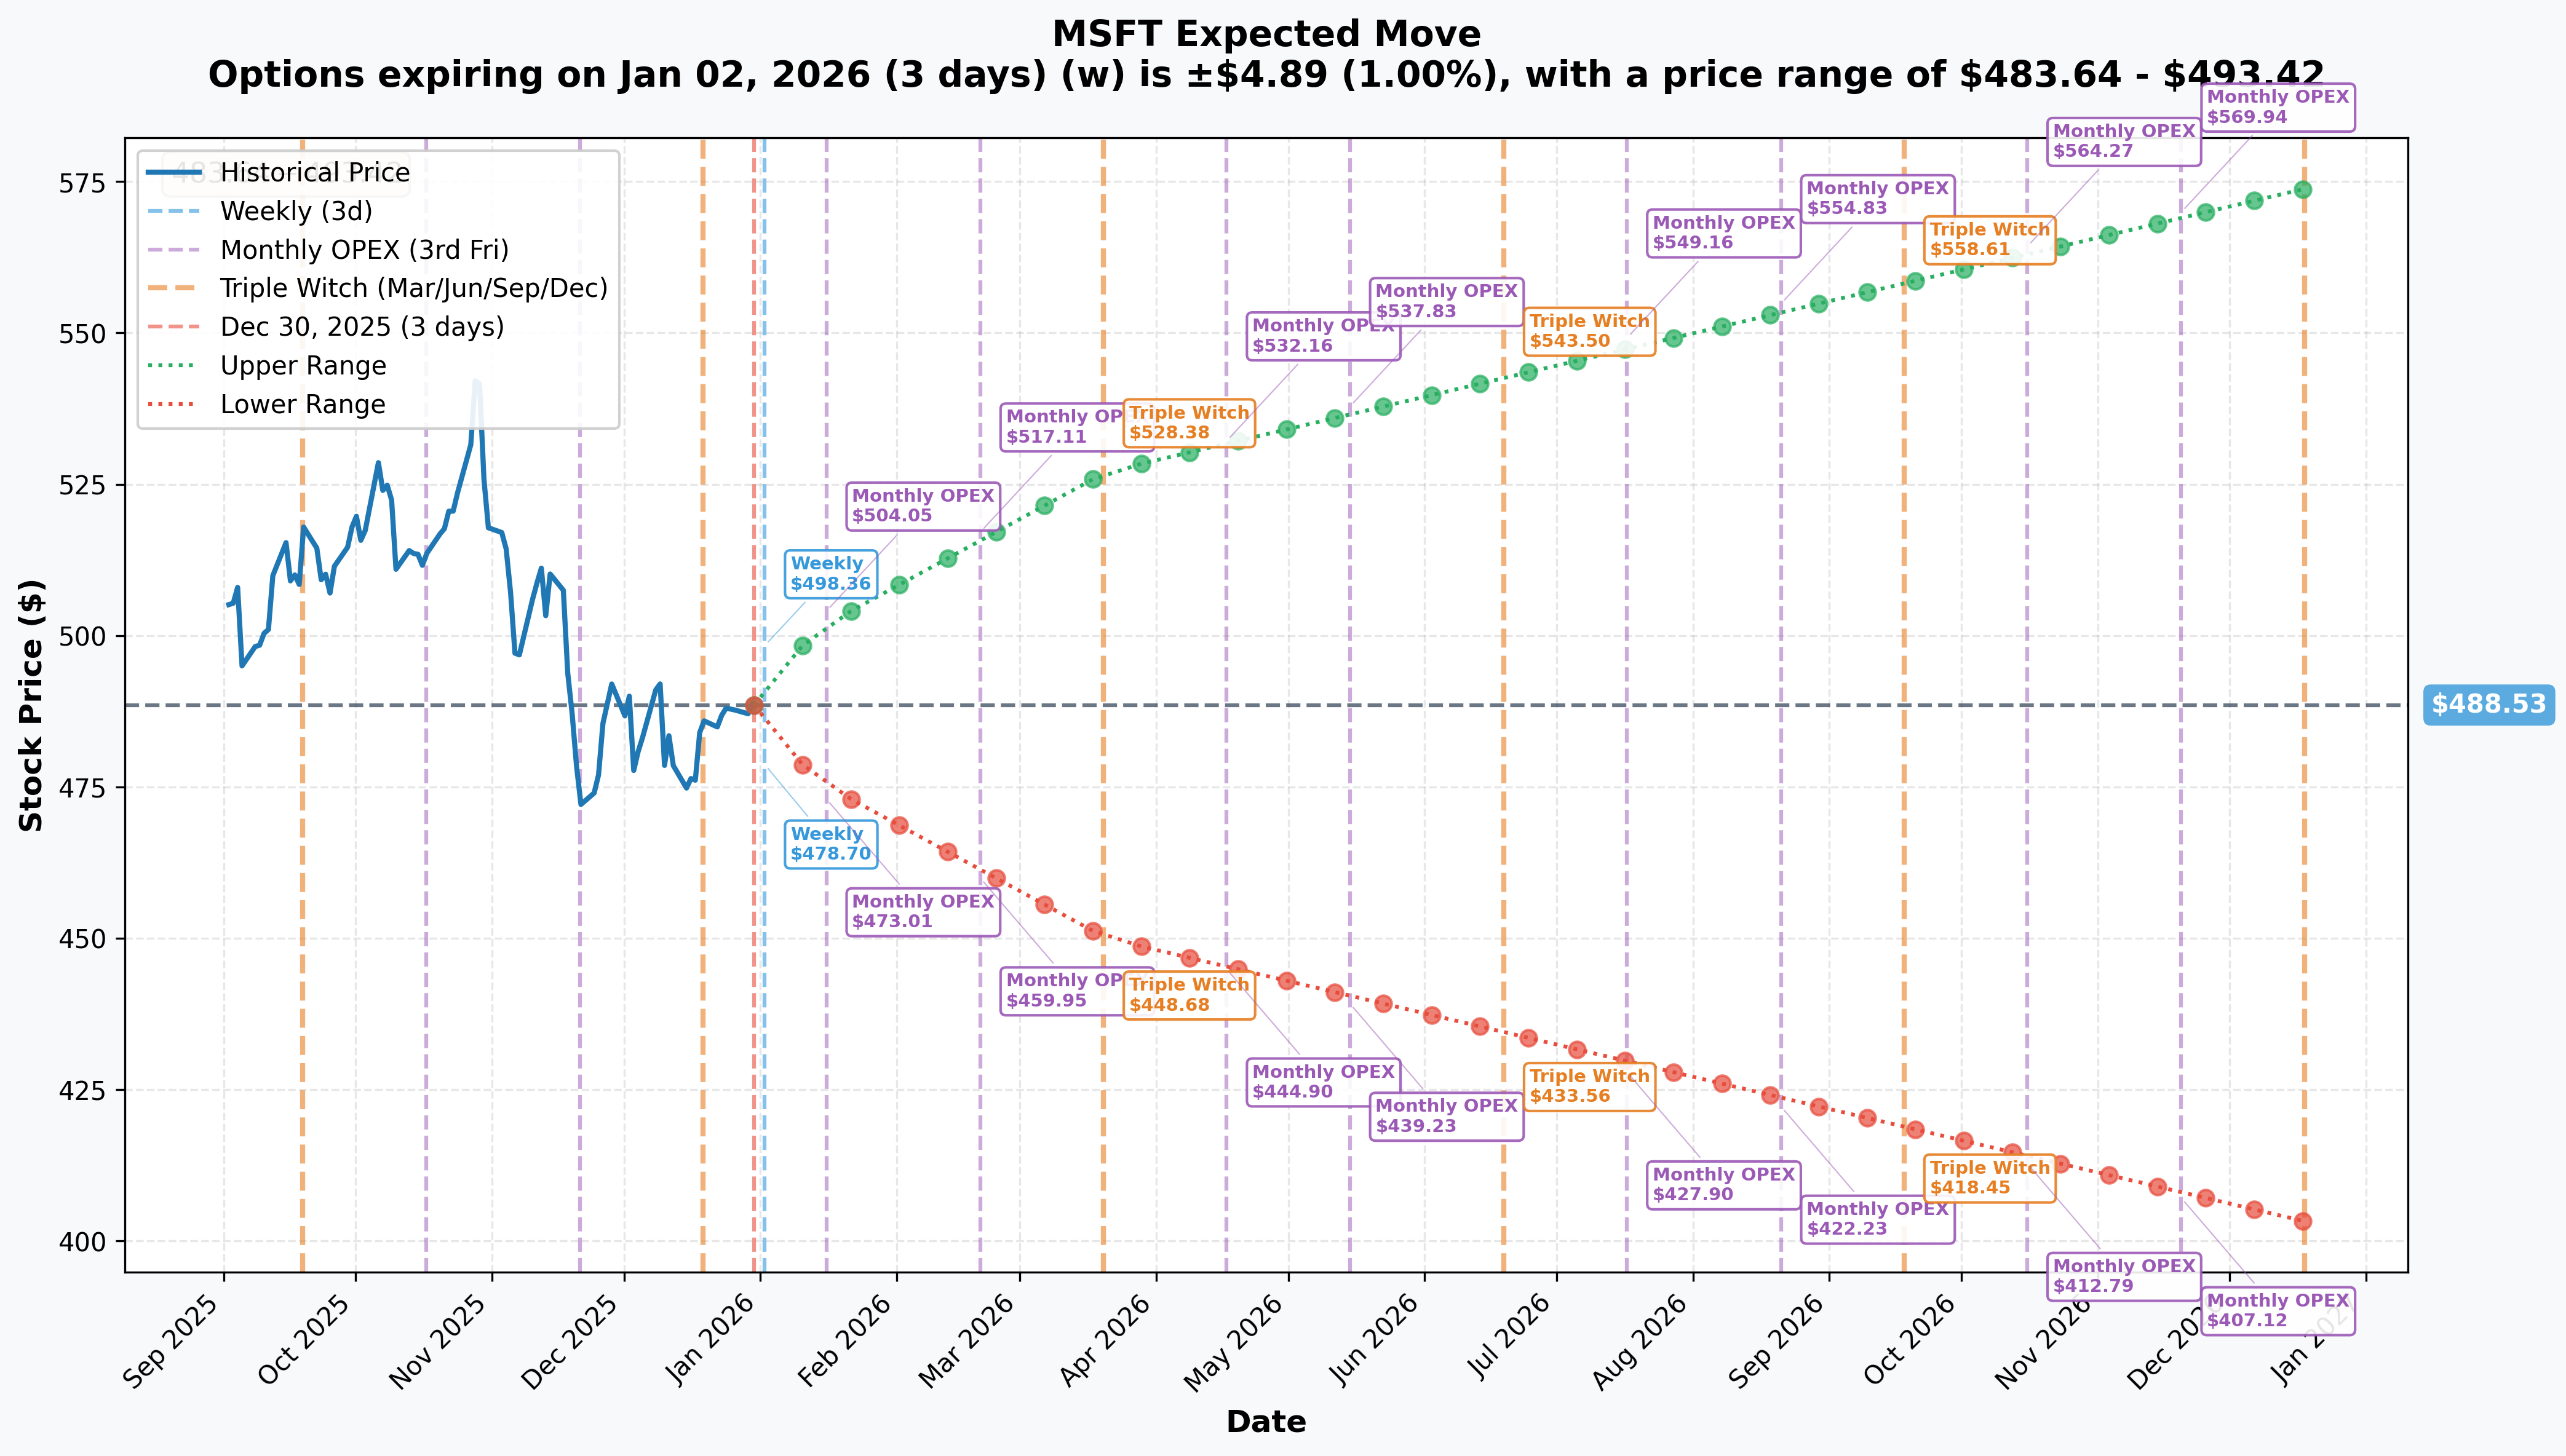
Options market pricing for upcoming expirations:
- 📅 Weekly (Jan 2 - 3 days): ±$4.89 (±1.0%) → Range: $483.64 - $493.42
- 📅 Monthly OPEX (Jan 16 - 17 days): ±$13.54 (±2.77%) → Range: $474.99 - $502.07
- 📅 February OPEX (Feb 20 - 52 days - THIS TRADE!): ±$19.38 (±3.97%) → Range: $459.95 - $517.11
- 📅 Quarterly Triple Witch (Mar 20 - 80 days): ±$38.48 (±7.88%) → Range: $450.05 - $527.01
Translation for regular folks:
Options traders are pricing in a 1.0% move ($5) by Friday for weekly expiration, but a 2.77% move ($13.54) through January 16 OPEX which includes Q2 earnings on January 28th. The February 20th expiration (when this $19M trade expires) has an expected range of $459.95 - $517.11, meaning the market thinks there's a decent probability MSFT could trade as low as $460 over the next 52 days.
Key insight: The $460 strike sits RIGHT at the lower end of the February implied move range ($459.95 lower bound vs $460 strike). The short call seller is positioning at the statistical edge - they believe MSFT won't decline below $460 (only ~5.5% downside from current $487) and is betting on range-bound trading into Q2 earnings. This is a high-probability strategy given strong support at $480-485 and solid fundamentals.
🎪 Catalysts
🔥 Upcoming Catalysts (Next 60 Days)
Q2 FY2026 Earnings - January 28, 2026 (29 DAYS AWAY!) 📊
Microsoft reports fiscal Q2 2026 results on Tuesday, January 28, 2026 after market close (unconfirmed date). This is THE catalyst that will determine whether MSFT breaks out above $500 resistance or consolidates lower. Wall Street expectations and key metrics:
- 📊 Revenue: $79.5B - $80.6B consensus (guidance midpoint $80.05B), up ~18% YoY
- 💰 Azure Growth: Expected ~37% constant currency growth (slight deceleration from Q1's 40%)
- 🤖 Commercial Bookings: Following Q1's explosive 112% YoY surge - sustainability key
- 📈 RPO (Remaining Performance Obligations): Following $392B backlog from Q1 - growth trajectory critical
- 💻 Copilot Metrics: Enterprise adoption rates, seat expansion, ROI proof points
- 🏭 CapEx Guidance: Following $30B+ Q1 spend ($120B annualized) - is peak CapEx behind us?
- 🔥 OpenAI Impact: Q1 saw $3.1B net income hit from OpenAI losses - watching for improvement
Upside surprise potential: Azure capacity constraints through H1 FY2026 mean pent-up demand could unleash when new capacity comes online. Wedbush's Dan Ives sees 20-25% AI deal acceleration with enterprises moving from pilot to production AI deployments. If Copilot seat expansion accelerates beyond 200,000+ enterprise licenses announced in December, stock could break $500 resistance.
Downside risk factors: Copilot facing reliability issues with only 14% market share vs ChatGPT's 61%, and even CEO Nadella admitted integrations "don't really work" for Gmail/Outlook. If enterprises delay Copilot rollouts or Azure growth decelerates below 35%, guidance disappointment could send stock toward $460 support. The $3.1B quarterly OpenAI loss also pressures margins.
Historical precedent: MSFT declined -10% post Q1 earnings despite beating on revenue and EPS, showing market has high expectations baked in. Pattern suggests "buy the rumor, sell the news" risk into Q2.
M365 Price Increases - July 2026 💰
Global price increases for Microsoft 365 productivity suites take effect July 2026, with sharpest increases targeting small business and frontline worker plans:
- 💵 Material revenue tailwind beginning H2 FY2027
- 🎯 430 million M365 users provide massive addressable base for price leverage
- 📊 Pricing power validates sticky enterprise moat and low churn
- ⚠️ However, this is AFTER February 20 expiration - doesn't impact this trade's timeframe
📊 Recent Catalysts (Already Happened - Past 90 Days)
OpenAI Partnership Restructuring (October 28, 2025):
Microsoft's landmark restructured OpenAI partnership announced October 28 represents the most transformative AI catalyst:
- 🏆 Microsoft now holds ~27% equity stake in OpenAI valued at $135 billion
- 🔬 IP rights extended through 2032, including POST-AGI models with safety guardrails
- 💰 OpenAI contracted for additional $250B in Azure services (massive cloud revenue visibility)
- 🎯 Microsoft can independently pursue AGI development alone or with third parties
- ⚡ AGI declaration now requires independent expert panel verification (reduces uncertainty)
- 📈 Stock rallied from $487 to all-time high $541 on this news (+11% in one day!)
Enterprise Copilot Partnerships (December 11, 2025):
Strategic partnerships with Cognizant, Infosys, TCS, and Wipro announced December 11:
- 🏢 Each company deploying 50,000+ Copilot licenses (200,000+ total enterprise seats)
- 💼 Validates enterprise adoption inflection beyond pilot programs
- 🚀 M365 Copilot Business launched at $21/user/month for SMBs (up to 300 users)
- 🎁 GPT-5.2 priority access granted to Copilot license holders December 11
- 📊 90% of Fortune 500 now using M365 Copilot per company disclosure
Microsoft Ignite 2025 (November 18-21, 2025):
Major product announcements at annual developer conference:
- 🤖 Azure AI Foundry rebranded to Microsoft Foundry for consolidated agent building
- 🔮 Foundry IQ launched for instant enterprise data access across 11,000+ models
- 🚀 Azure first to deploy NVIDIA GB300 GPUs at scale
- 🔐 Security Copilot available to M365 E5 customers with 12 new security agents
- 💾 Azure HorizonDB for PostgreSQL and SQL Server 2025 general availability
Q1 FY2026 Results (October 29, 2025):
Microsoft beat expectations but stock sold off -10%:
- 📊 Revenue: $77.7B (+18% YoY) vs consensus expectations
- 💰 GAAP EPS: $3.72 (beat consensus $3.67), Non-GAAP EPS: $4.13 (+23% YoY)
- ☁️ Microsoft Cloud: $49.1B (+26% YoY)
- 🔥 Commercial Bookings: Surged 112% YoY (explosive growth!)
- 📈 RPO (Backlog): Up 51% to $392 billion (unprecedented visibility)
- ⚠️ OpenAI Investment: Reduced net income by $3.1B and EPS by $0.41
- 📉 Stock declined despite beat - shows high expectations already priced in
🎲 Price Targets & Probabilities
Using gamma levels, implied move data, and upcoming catalysts, here are the scenarios through February 20th expiration:
📈 Bull Case (25% probability)
Target: $510-525
How we get there:
- 💪 Q2 earnings CRUSH expectations with revenue toward $81B+ (high-end of guidance) and Azure growth 38-40%
- 🚀 Copilot adoption accelerates beyond 200K enterprise seats with concrete ROI proof points
- 🤖 Commercial bookings sustain 100%+ YoY growth showing enterprise AI spending inflection
- 📊 RPO (backlog) grows to $420B+, extending visibility another quarter
- 🏭 Azure capacity additions unlock pent-up demand, driving upside revenue surprises
- ☁️ Management raises FY guidance based on AI momentum and Copilot traction
- 📈 Breakout above $500 gamma resistance triggers technical buying to $510-520
- 🌐 No major regulatory headwinds from FTC antitrust investigation
Key metrics needed:
- Azure growth maintaining 37%+ (not decelerating)
- Copilot seat expansion >30% QoQ
- Operating margins stable despite CapEx depreciation beginning
- Q3 guidance showing confidence in sustained growth
Probability assessment: Only 25% because it requires strong execution on multiple fronts with stock already at 34.7x P/E (13% premium to sector). The massive $490-500 gamma resistance (95B combined) creates mechanical selling pressure. February implied move upper bound is $517, suggesting market sees low probability of breakout above $520.
Put P&L in Bull Case:
- Stock at $510 on Feb 20: Short calls worth -$50.00 (stock $510 - strike $460), loss = -$50 + $37.65 premium = -$12.35/share × 5,000 = -$6.2M loss (seller's stock gains offset this if covered)
- Stock at $525 on Feb 20: Short calls worth -$65.00, loss = -$65 + $37.65 = -$27.35/share × 5,000 = -$13.7M loss
🎯 Base Case (60% probability)
Target: $470-495 range (SIDEWAYS CONSOLIDATION)
Most likely scenario:
- ✅ Solid earnings meeting consensus ($79.5-80.5B revenue, Azure growth 36-37%)
- 📱 Copilot adoption progressing but not explosive - steady growth without fireworks
- ⚖️ Guidance in-line (Q3 revenue $83-84B) - normal seasonality, no major surprises
- 🤖 OpenAI losses stabilizing around $3B/quarter - manageable but not improving yet
- 🇺🇸 FTC antitrust investigation ongoing but no formal charges (process takes years)
- 🔄 Trading within gamma support ($480-485) and resistance ($490-500) bands
- 📊 Market digests October rally from $487 to $541, consolidates before next catalyst
- 💤 Year-end profit-taking and portfolio rebalancing keeps lid on upside
This is the short call seller's target scenario: Stock trades range-bound between $470-495, staying well above the $460 strike. Seller collects the full $37.65 premium per share (total $19M) while maintaining their long stock position. Perfect outcome - generate income without losing upside participation below $460.
Why 60% probability: MSFT fundamentals remain strong (Azure 40% growth, $392B backlog, OpenAI partnership) but valuation at 34.7x P/E requires flawless execution. The -10% post-earnings decline in Q1 despite beating shows market won't reward "just meeting" expectations. Gamma structure ($485 support, $490-500 resistance) creates natural trading range. Most institutions will hold and wait for Q2 earnings clarity before adding exposure.
Put P&L in Base Case:
- Stock at $470-495 on Feb 20: Short calls expire worthless (stock below $460 strike), profit = $19M (100% gain on premium collected)
- This is IDEAL outcome for the seller
📉 Bear Case (15% probability)
Target: $450-470 (TEST MAJOR SUPPORT!)
What could go wrong:
- 😰 Q2 earnings miss or weak guidance - Azure growth decelerates to 33-34% (below 37% consensus)
- 🚨 Copilot adoption stalls with enterprises citing reliability issues and poor ROI
- ⏰ OpenAI losses WIDEN beyond $3.1B, pressuring margins and investor confidence
- 🇺🇸 FTC antitrust charges filed targeting Azure bundling or OpenAI partnership
- 💸 Broader tech selloff (Nasdaq correction, AI bubble concerns, recession fears)
- 📊 CapEx depreciation beginning to pressure operating margins
- 🤖 Competitive pressure from DeepSeek ($0.27-$2.19/M tokens) or ChatGPT (61% share)
- 💰 $392B backlog growth slows, signaling enterprise AI spend plateau
- 🔨 Break below $480 gamma support triggers cascade to $470, then $460
Critical support levels:
- 🛡️ $480: Major gamma floor (33.1B) - MUST HOLD or momentum shifts bearish
- 🛡️ $475: Secondary support (18.0B gamma) - likely buying here
- 🛡️ $470: Deep support (17.3B gamma) - critical defense line
- 🛡️ $460: Extended floor (16.7B gamma) + this short call strike - major battle zone
Probability assessment: Only 15% because MSFT's fundamentals remain robust (Azure 40% growth, $392B backlog, enterprise moat, OpenAI partnership). However, execution risk exists and valuation at 34.7x P/E offers limited cushion. The February implied move lower bound is $459.95 (just below $460 strike), suggesting market sees small but real probability of testing this level.
Put P&L in Bear Case:
- Stock at $470 on Feb 20: Short calls expire worthless, profit = $19M (even better for seller as stock consolidates)
- Stock at $450 on Feb 20: Short calls expire worthless, profit = $19M (seller's long stock loses value but captures full premium)
- Stock at $440 on Feb 20: Short calls expire worthless, profit = $19M (covered call structure caps downside to stock ownership, not option loss)
Key insight: The short call position BENEFITS from downside moves as long as the seller owns the underlying stock (covered call). Maximum profit is $19M collected premium regardless of where stock trades below $460.
💡 Trading Ideas
🛡️ Conservative: Wait for Q2 Earnings Clarity
Play: Stay on sidelines until after January 28th earnings volatility settles
Why this works:
- ⏰ Earnings in 29 days creates binary event risk with ±2.77% implied move - too uncertain
- 💸 Implied volatility elevated pre-earnings - options pricing in risk premium
- 📊 Stock consolidating in $480-500 range with limited upside to $500 resistance
- 🎯 Better entry likely post-earnings after IV crush and technical setup clarifies
- 📉 Historical pattern: MSFT declined -10% post Q1 earnings even on beat (profit-taking risk)
- 🤔 The $19M short call signals sophisticated traders trimming exposure - follow smart money
Action plan:
- 👀 Watch January 28 earnings for Azure growth (37%+ needed), Copilot metrics, RPO growth, and Q3 guidance
- 🎯 Look for pullback to $470-480 gamma support post-earnings for stock entry with better risk/reward
- ✅ Need to see Azure maintaining 37%+ growth, Copilot adoption accelerating, and CapEx peaking
- 📊 If earnings beat AND stock breaks $500, consider chase on breakout momentum
- ⏰ Revisit mid-February when more clarity on FY2026 trajectory
Risk level: Minimal (cash position) | Skill level: Beginner-friendly
Expected outcome: Avoid potential -5-7% drawdown if earnings disappoint or market takes profits. Get better entry if stock consolidates to $470-480. Maintain optionality for post-earnings momentum plays.
⚖️ Balanced: Sell Put Spread Below Support (Income Strategy)
Play: After earnings, sell put spread targeting gamma support zone
Structure: Sell $475 puts, Buy $465 puts (February 20 expiration - SAME as the $19M trade)
Why this works:
- 🎢 IV crush after earnings makes put spreads cheaper to sell - collect premium AFTER volatility drops
- 📊 Defined risk spread ($10 wide = $1,000 max risk per spread)
- 🎯 Targets gamma support zone at $475-480 where institutions are positioned (18B-33B gamma)
- 🤝 Essentially "selling insurance" on MSFT staying above $475 (only 2.6% below current $487)
- ⏰ 52 days to expiration gives time for any post-earnings weakness to recover
- 🛡️ Strong support at $480-485 (65B combined gamma) makes sub-$475 unlikely
- 💰 Solid fundamentals (Azure 40%, $392B backlog, OpenAI partnership) support floor
Estimated P&L (adjust after seeing post-earnings IV):
- 💰 Collect ~$3-4 net credit per spread post-earnings (vs $5-6 now)
- 📈 Max profit: $300-400 if MSFT above $475 at February expiration
- 📉 Max loss: $600-700 if MSFT below $465 (defined and limited)
- 🎯 Breakeven: ~$471-472
- 📊 Risk/Reward: ~1.5:1 (solid for income strategy with strong support below)
Entry timing:
- ⏰ Wait 2-3 days post-earnings (by Jan 30-31) for full IV collapse
- 🎯 Only enter if stock trades $480+ (gives cushion above $475 short strike)
- ❌ Skip if stock already below $475 (spread too close to at-the-money)
Position sizing: Risk only 3-5% of portfolio (this is income generation with defined risk)
Risk level: Moderate (defined risk, bullish bias) | Skill level: Intermediate
🚀 Aggressive: Call Debit Spread Above Resistance (Breakout Play - ADVANCED!)
Play: Buy call spread betting on breakout above $500 resistance post-earnings
Structure: Buy $500 calls, Sell $510 calls (February 20 expiration)
Why this could work:
- 💥 If Q2 earnings BEAT with Azure 38-40% growth + Copilot acceleration, stock could break $500 resistance
- 🎰 Betting that current consolidation is coiling for explosive move on positive catalyst
- 📊 $500 resistance has 48.6B gamma - breakout could trigger short covering and momentum chase
- 🚀 February implied move upper bound is $517 - market pricing in 6% upside potential
- ⚡ Maximum gamma exposure at $490-500 creates explosive potential for gap moves on surprise beat
- 📈 Defined risk spread limits downside to premium paid while capping upside at $10 gain per spread
Why this could blow up (SERIOUS RISKS):
- 💸 EXPENSIVE: Call spread costs ~$4-5 ($400-500 per spread) even post-IV crush
- ⏰ BINARY BET: Requires earnings beat AND guidance raise AND breakout above $500 - three things must align
- 😱 IV CRUSH: Even if stock rallies to $495-500, IV collapse could result in LOSS if not above $500
- 📊 MASSIVE RESISTANCE: $490-500 has 95B combined gamma - dealers will sell into rallies aggressively
- 🎢 Stock could beat earnings and still consolidate $480-495 (like Q1) = spread expires worthless
- ⚠️ Historical pattern: Q1 beat led to -10% decline, not rally
Estimated P&L:
- 💰 Cost: ~$4-5 per spread (using Feb 20 expiration post-earnings)
- 📈 Profit scenario: Stock breaks to $510+ = $5-6 gain (100%+ ROI)
- 🚀 Home run: Stock rallies to $520+ = $10 max gain (200% ROI)
- 📉 Loss scenario: Stock stays below $500 = lose $4-5 (80-100% loss)
- 💀 Total loss: Stock consolidates below $500 = lose entire premium
Breakeven point:
- 📈 Breakeven: ~$504-505 (need 3.5% rally from current levels)
CRITICAL WARNING - DO NOT attempt unless you:
- ✅ Believe Q2 earnings will BEAT with guidance raise (not just meet)
- ✅ Can afford to lose ENTIRE premium (high probability outcome!)
- ✅ Understand you're betting AGAINST the options market's consolidation bias
- ✅ Can monitor position day after earnings and take profits quickly if $500 breaks
- ✅ Accept that even if RIGHT on direction, resistance at $500 could cap gains
- ⏰ Plan to close position within 24-48 hours post-earnings if profitable (don't hold to expiration)
Risk level: EXTREME (can lose 100% of premium) | Skill level: Advanced only
Probability of profit: ~30% (lower than 50/50 due to strong resistance and historical post-earnings weakness)
⚠️ Risk Factors
Don't get caught by these potential landmines:
-
⏰ Q2 Earnings binary event in 29 days: Results January 28th after close create MASSIVE volatility risk. Stock could gap 5-7% either direction based on Azure growth (37% vs 35% makes huge difference), Copilot adoption metrics, RPO backlog growth, and CapEx guidance. Historical precedent shows MSFT declined -10% post Q1 earnings despite beating - "buy the rumor, sell the news" pattern. Current February implied move is ±3.97% but actual moves could be larger.
-
🤖 Copilot adoption uncertainty and reliability issues: Only 14% market share vs ChatGPT's 61% raises monetization concerns. Even CEO Nadella admitted integrations "don't really work" for Gmail/Outlook - credibility hit. Enterprises questioning $30/user/month ROI with Google Gemini and Perplexity outperforming in reliability tests. If Q2 shows slowing seat expansion or poor retention, stock could retest $470-480 support.
-
💸 OpenAI losses pressuring profitability: $3.1B quarterly profit drag and $0.41 EPS reduction from OpenAI investment is material. While 27% equity stake valued at $135B provides long-term upside, near-term P&L impact creates margin headwinds. If losses WIDEN in Q2 or AGI timeline extends, investor patience could wear thin.
-
🇺🇸 FTC antitrust investigation and international regulatory scrutiny: Broad probe of AI, cloud, and OpenAI partnership ongoing by Federal Trade Commission. UK CMA provisional findings criticizing cloud licensing terms, EU investigating Teams/Office bundling, France reviewing search syndication, and Germany designated MSFT as "company of paramount significance" with expanded oversight. While formal charges could take years, regulatory uncertainty creates overhang. Any adverse rulings could impact Azure bundling strategies or OpenAI exclusivity.
-
📊 Valuation at 34.7x P/E (13% premium to sector) offers limited margin of safety: Trading above tech sector average P/E of 30.63x and near 10-year average of 31.62x. Stock requires continued Azure 37%+ growth and Copilot monetization to justify premium. Any growth deceleration magnified 2-3x at this valuation. At current $487, stock is only -10% from all-time high $541 despite Q1 post-earnings selloff - limited downside cushion.
-
🏗️ CapEx depreciation cliff approaching: $120B+ annualized CapEx spending ($30B+ per quarter) creates upcoming depreciation pressure on operating margins. While building Azure infrastructure for AI demand, the depreciation expense will hit income statement in coming quarters. If revenue growth doesn't offset depreciation impact, margins compress.
-
🌐 Azure capacity constraints limiting near-term growth: Company expects to remain capacity constrained through H1 FY2026, meaning pent-up demand exists but can't be monetized until new datacenters come online. This caps near-term upside - even if demand surges 50%, supply constraints prevent revenue acceleration. Double-edged sword: validates long-term thesis but limits short-term growth.
-
🔥 Competition intensifying from AWS, Google Cloud, and AI assistants: AWS and Google Cloud remain formidable competitors in cloud infrastructure. DeepSeek undercutting on pricing with $0.27-$2.19/M tokens vs Copilot's $30/user/month. ChatGPT dominance (61% share) and open-source AI models (Llama, Mistral) create pricing pressure and customer choice. Microsoft must continue innovation to maintain competitive edge.
-
🎢 Post-earnings profit-taking pattern: MSFT has history of "sell the news" even on beats. Q1 FY2026 beat consensus on revenue and EPS yet stock declined -10% from $541 to $487. Pattern suggests institutions use earnings as exit opportunity to trim positions after rallies. With stock up from $487 to $541 in October (+11%), similar profit-taking risk exists post Q2 even if results solid.
-
💰 Macro headwinds if recession emerges: At 34.7x P/E, MSFT has limited recession protection despite enterprise moat. IT budgets get cut first in downturns. Cloud spending growth could decelerate from 40% to 20-25% in recession scenario. If economy weakens in 2026, even with strong execution, multiple compression could drive stock toward $420-450 range (25-28x P/E).
🎯 The Bottom Line
Real talk: Someone just collected $19 MILLION selling MSFT call options 29 days before Q2 earnings and 52 days before February expiration. This isn't a bearish bet - it's smart profit-taking and income generation by an institution that owns massive MSFT stock and wants to cap upside at $460 while collecting huge premium. They're essentially saying "we'll happily give up gains above $460 to pocket $37.65/share TODAY."
What this trade tells us:
- 🎯 Sophisticated player expects CONSOLIDATION through February (not crash, but sideways trading in $470-495 range)
- 💰 They're worried enough about limited upside (strong $490-500 resistance) to monetize via covered calls
- ⚖️ The timing (29 days pre-earnings) shows they see binary risk - willing to cap upside to collect income NOW
- 📊 They structured at $460 strike (5.5% below current) expecting MSFT trades above this level (profitable outcome)
- ⏰ February 20th expiration captures Q2 earnings (Jan 28), post-earnings reaction, and initial Q3 guidance period
This is NOT a "sell everything" signal - it's a "cap your upside and generate income in consolidation" signal.
If you own MSFT:
- ✅ Consider selling OUT-OF-THE-MONEY covered calls (like $500 or $510 strikes) to generate income during consolidation
- 📊 Set MENTAL STOP at $480 (major gamma support) to protect if technical breakdown occurs
- ⏰ This is a mature holding with solid fundamentals - trimming 10-20% to lock in gains is prudent risk management
- 🎯 If earnings beat AND stock breaks $500, could re-add on momentum to $510-520
- 🛡️ Consider buying protective puts at $470 strike (1-2 per 100 shares) if holding large position through earnings
If you're watching from sidelines:
- ⏰ January 28th after close is the catalyst - DO NOT enter before earnings volatility!
- 🎯 Post-earnings pullback to $470-480 would be EXCELLENT entry (4-6% off current levels with gamma support)
- 📈 Looking for confirmation of: Azure growth 37%+, Copilot seat expansion >30% QoQ, RPO growth sustaining 40-50%, Q3 guidance confidence
- 🚀 Longer-term (6-12 months), OpenAI partnership execution and M365 price increases July 2026 are legitimate catalysts for $520-550
- ⚠️ Current valuation (34.7x P/E) requires flawless execution - one stumble and it's back to $450-470
If you're bearish:
- 🎯 Shorting is extremely dangerous given strong fundamentals (Azure 40%, $392B backlog, enterprise moat)
- 📊 Major support at $480-485 (65B gamma) makes sustained breakdown unlikely without catalyst
- ⚠️ Post-earnings put spreads ($490/$480 or $480/$470) offer defined-risk way to play consolidation after IV crush
- 📉 Watch for break below $480 - that's the trigger for potential cascade to $470, then $460
- ⏰ Timing is EVERYTHING: Premature bearish positioning risks getting run over; post-earnings offers better setup
Mark your calendar - Key dates:
- 📅 January 2, 2026 (Friday) - Weekly OPEX (±1.0% implied move)
- 📅 January 16, 2026 (Friday) - Monthly OPEX (±2.77% implied move window)
- 📅 January 28, 2026 (Tuesday) after market close - Q2 FY2026 earnings report (29 DAYS!)
- 📅 January 29, 2026 (Wednesday) - Post-earnings price action and analyst reactions
- 📅 February 20, 2026 (Friday) - Monthly OPEX, expiration of this $19M short call trade
- 📅 March 20, 2026 - Quarterly triple witch
- 📅 May 19-21, 2026 - Microsoft Build 2026 developer conference
- 📅 July 2026 - M365 price increases take effect
Final verdict: Microsoft's long-term AI story remains INCREDIBLY strong - OpenAI partnership with $250B Azure commitment, Azure 40% growth, $392B backlog, enterprise Copilot adoption (200K+ seats), and pricing power (July 2026 M365 increases) all validate the thesis. BUT, at 34.7x P/E after rallying from $487 to $541 in October with Q2 earnings in 29 days, the risk/reward for NEW aggressive positioning is NOT favorable. The $19M short call is a CLEAR signal: smart money is monetizing consolidation through covered call income generation.
Be patient. Let Q2 earnings provide clarity. Look for better entry points at $470-480 if pullback occurs. Microsoft will still be THE AI infrastructure leader in 6 months, and you'll sleep better paying $475 instead of $487.
This is wealth preservation + income generation, not FOMO chasing. Protect your capital. 💪
Disclaimer: Options trading involves substantial risk of loss and is not suitable for all investors. This analysis is for educational purposes only and not financial advice. Past performance doesn't guarantee future results. The 1.75x unusual score reflects this specific trade's size relative to recent MSFT history - it does not imply the trade will be profitable or that you should follow it. Short call positions have UNLIMITED risk if not covered by stock ownership. Always do your own research and consider consulting a licensed financial advisor before trading. Earnings create binary event risk with potential for 5-7% gaps either direction.
About Microsoft Corporation: Microsoft develops and licenses consumer and enterprise software, known for Windows operating systems and Office productivity suite, operating across productivity solutions, cloud infrastructure (Azure), and personal computing devices, with a market cap of $3.62 trillion in the Prepackaged Software industry.