🚨 MSFT: $18M Call Position CLOSED - Smart Money Taking Profits!
📅 December 31, 2025 | 🔥 Unusual Activity Detected
🎯 The Quick Take
Someone just unloaded $18 MILLION worth of MSFT call options in a single block trade! This isn't some retail trader panic-selling - this is a sophisticated institutional player closing out a profitable long position on the Feb 2026 $460 calls. With MSFT trading at $485.50, these calls are deeply in-the-money, suggesting a smart profit-taking move as we head into the new year.
🏢 Company Overview
Microsoft Corporation (NASDAQ: MSFT)
- Market Cap: $3.62 Trillion (yes, with a T!)
- Sector: Software and IT Services
- Business: The tech giant behind Windows, Office 365, Azure cloud services, LinkedIn, Xbox, and now Activision Blizzard. Microsoft is positioned at the epicenter of enterprise AI adoption with Azure AI and Copilot.
What They Do: Microsoft develops and licenses software for consumers and enterprises across three major divisions: productivity and business processes (Office 365, LinkedIn, Dynamics), intelligent cloud services (Azure, Windows Server), and personal computing (Windows, Xbox, Surface devices).
💰 The Option Flow Breakdown
📊 Full Trade Details
| Time | Symbol | Buy/Sell | C/P | Expiration | Premium | Strike | Volume | OI | Size | Spot | Option Price | Option Symbol |
|---|---|---|---|---|---|---|---|---|---|---|---|---|
| 09:48:36 | MSFT | SELL | CALL | 2026-02-20 | $18,000,000 | $460 | 5,000 | 20,000 | 5,000 | $485.50 | $36.15 | MSFT20260220C460 |
🤓 What This Actually Means
This trade is classified as "Close Long CALL" with MEDIUM confidence. Here's what that tells us:
The Trade Breakdown:
- 🔵 Trade Type: Someone sold to close (STC) a long call position
- 🔵 Premium Value: $18M collected ($36.15 per contract × 5,000 contracts)
- 🔵 Intrinsic Value: $25.50 per share ($485.50 spot - $460 strike)
- 🔵 Extrinsic Value: $10.65 per share (time value still in the option)
- 🔵 Days to Expiration: 51 days until Feb 20, 2026
What the Data Says:
- Volume/OI Ratio: 0.25 (5,000 volume / 20,000 open interest = closing activity)
- Z-Score: 1.67 (ABOVE_AVERAGE activity, but not extreme)
- Similar Trades: 3 similar transactions in recent history
- Signal: CLOSE classification with moderate activity confirmation
Translation for us regular folks: Someone bought these $460 calls weeks or months ago when MSFT was lower, and they're now cashing out with MSFT trading 51 points in-the-money. They're locking in profits - collecting $36.15 per share on an option that has $25.50 of intrinsic value. Smart money is de-risking into year-end, possibly to book 2025 gains or reduce exposure ahead of upcoming catalysts.
📈 Chart Check-Up
📊 YTD Performance Overview
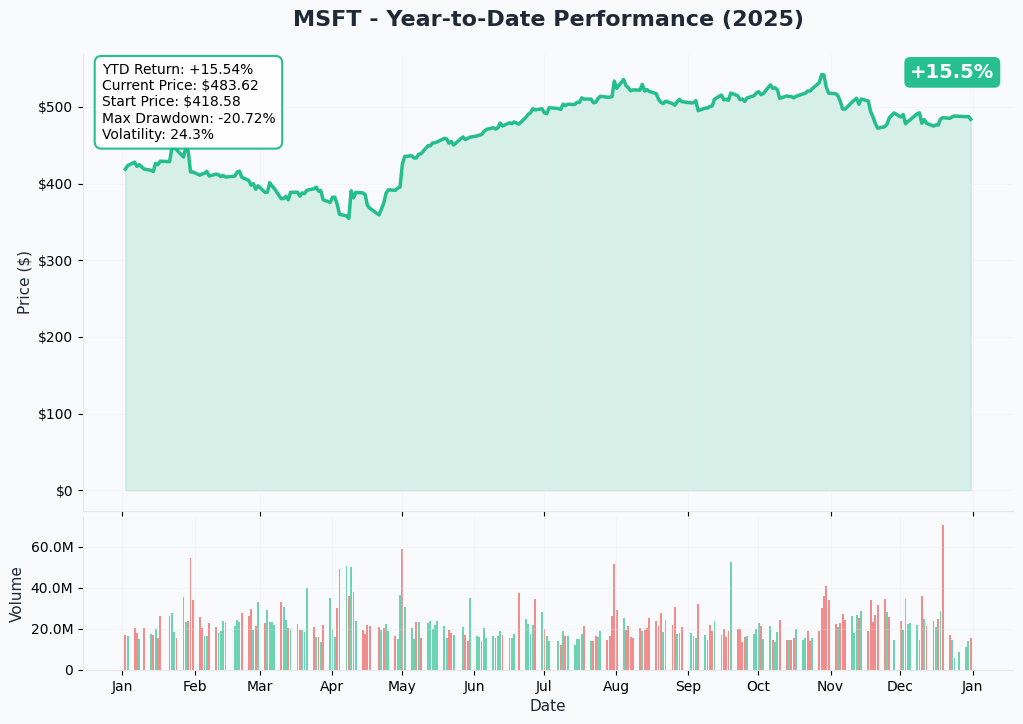
MSFT has had a solid 2025, currently trading at $485.50 after reaching an all-time high of $541.06 in late October. The stock is up +16.65% YTD, though it's underperforming the S&P 500's +17.67% return. The 13% pullback from October highs reflects profit-taking and concerns about AI investment returns, but the overall trend remains intact.
Key Technical Observations:
- Stock found support around $470-$480 range after October highs
- Trading above all major moving averages
- Consolidating before potential Q2 earnings catalyst in late January
Now let's dive into where the key support and resistance levels lie based on options positioning...
🛡️ Gamma-Based Support & Resistance Analysis
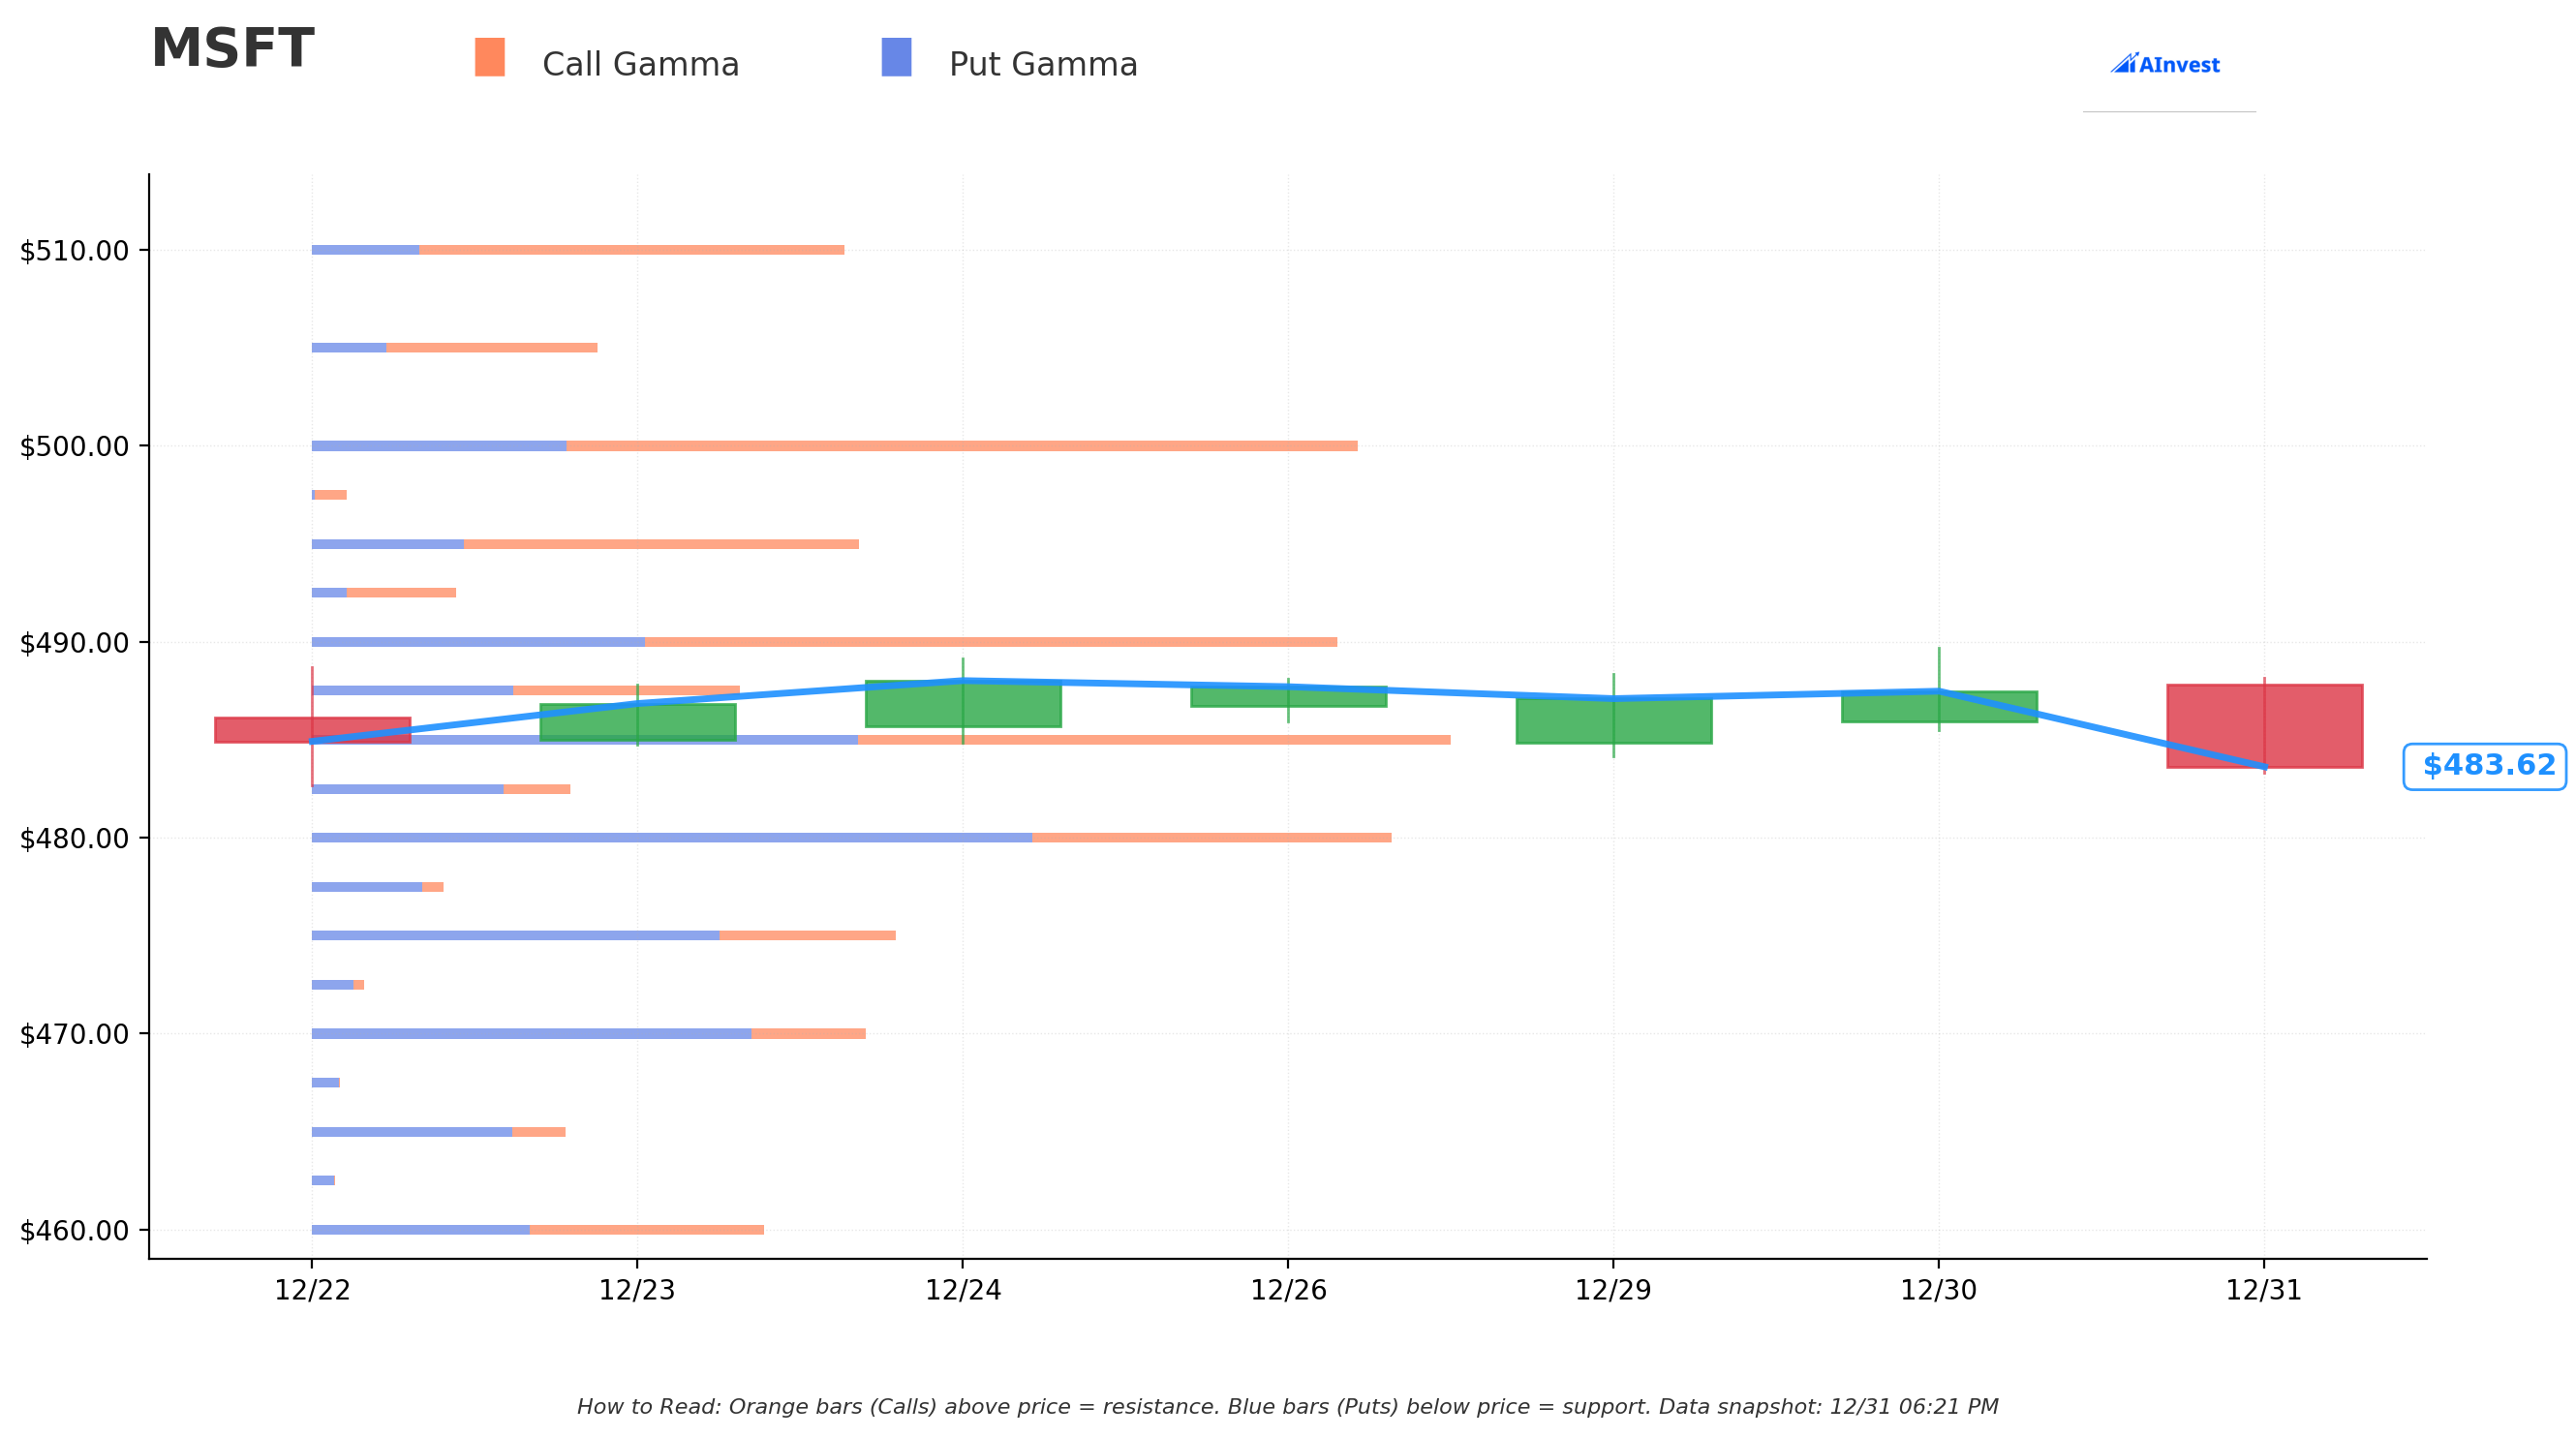
What You're Looking At: The gamma exposure (GEX) chart shows where market makers have the most options exposure - these levels act like magnets for price action. Blue bars (put gamma) create support zones below current price, while orange bars (call gamma) create resistance above.
Current Price: $483.48
Major Resistance Levels (Orange Bars - Call Gamma):
- 🟠 $485 - Strongest Immediate Resistance: Total GEX of $44.79M with net call bias of $3.71M. This is just 0.31% above current price - we're testing this level right now!
- 🟠 $490 - Key Psychological Level: Total GEX of $41.49M with strong net call bias of $14.12M. This is 1.35% away.
- 🟠 $500 - Major Ceiling: Total GEX of $41.24M with massive net call bias of $21.37M. Lots of call sellers want to keep MSFT below $500.
- 🟠 $510 - Extended Target: Total GEX of $21.11M, sitting 5.49% above current price.
Major Support Levels (Blue Bars - Put Gamma):
- 🔵 $480 - Strongest Support: Total GEX of $41.79M with net put bias of -$13.20M. Only 0.72% below current price - this is your first line of defense.
- 🔵 $475 - Secondary Support: Total GEX of $22.60M with net put bias of -$8.74M. Sitting 1.75% below.
- 🔵 $470 - Key Support Zone: Total GEX of $21.36M with net put bias of -$12.63M. This is 2.79% down.
- 🔵 $460 - Deep Support: Total GEX of $17.47M (the strike from today's big trade!). This is 4.86% below current price.
Net GEX Bias: BULLISH
- Total Call GEX: $277.13M
- Total Put GEX: $219.89M
- Net difference of +$57.24M favors calls
What This Means: Market makers are net short calls and long puts, meaning they'll need to buy stock as MSFT rises (positive gamma) and sell as it falls. This creates support on dips and resistance on rallies, with a slight upward bias.
📈 Implied Move Analysis
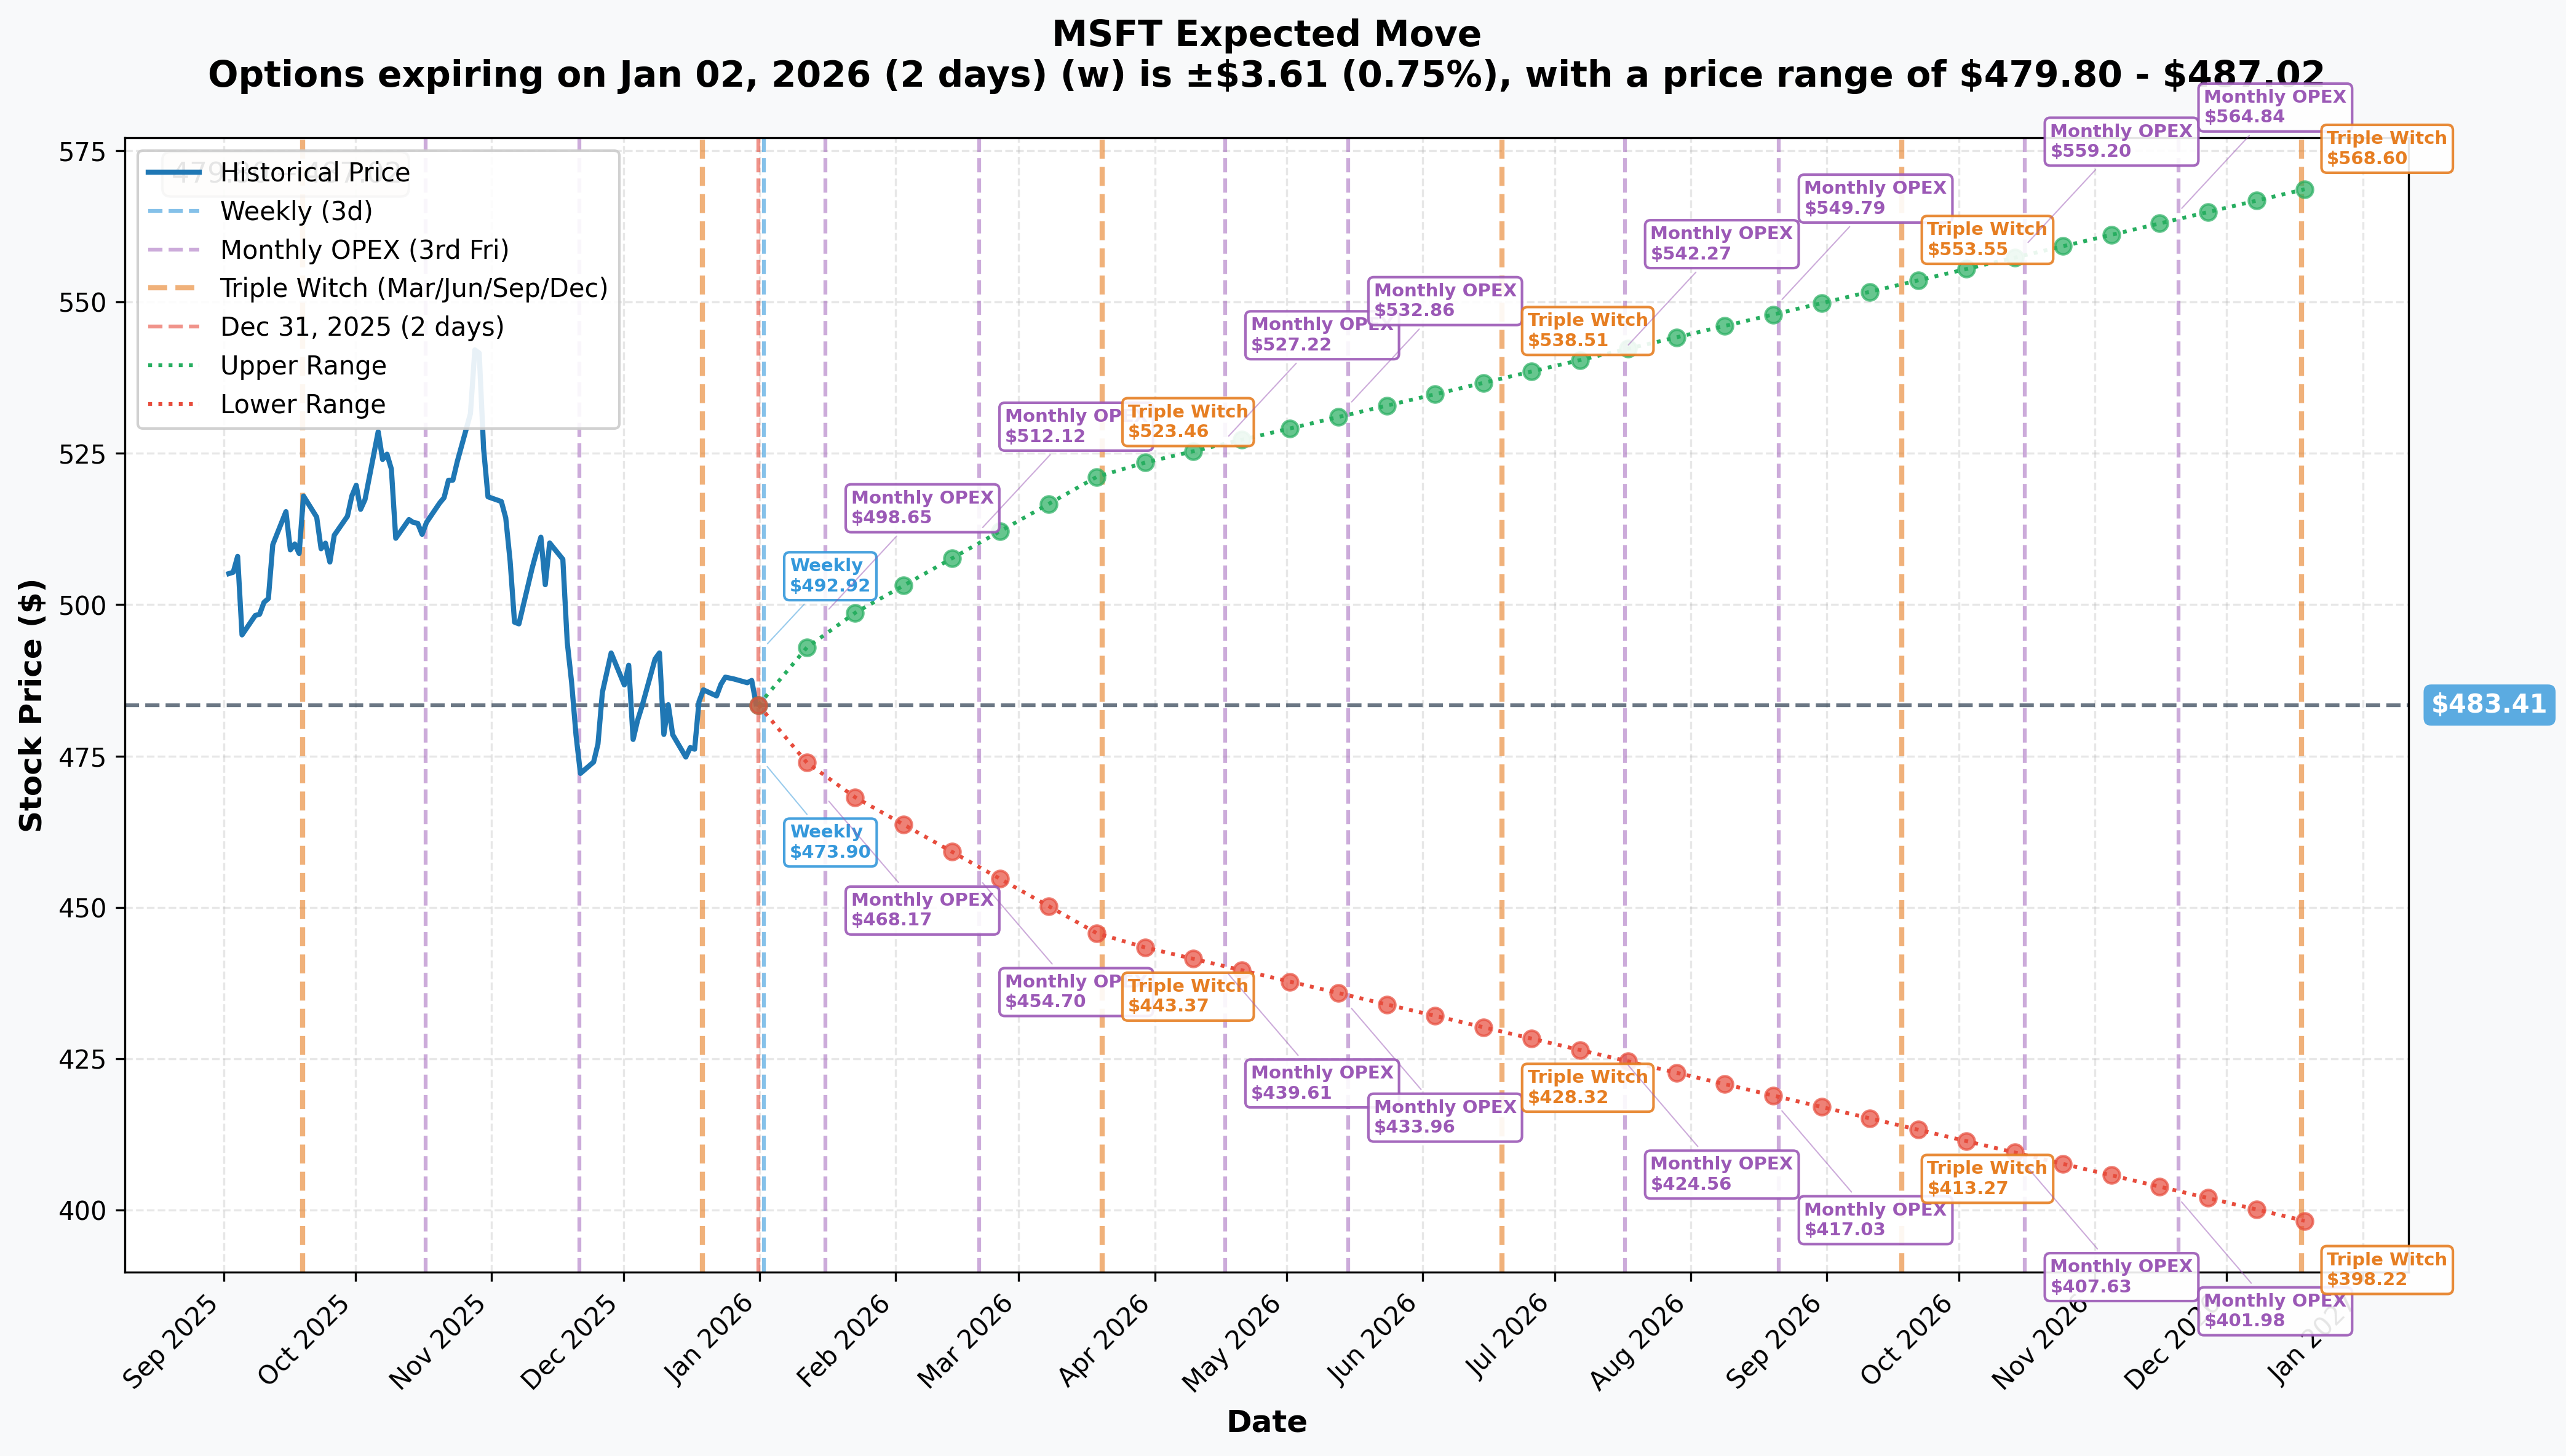
The options market is pricing in specific expected moves for each major expiration. Here's what traders are betting on:
Current Price: $483.41
Short-Term (Weekly - Jan 2, 2026):
- Implied Move: ±0.75% (±$3.61)
- Expected Range: $479.80 - $487.02
- Days to Expiry: 2 days
- Reliability: HIGH ✅
- Translation: Market expects MSFT to stay within a tight $7 range through year-end. Very quiet expectations.
Monthly OPEX (Jan 16, 2026):
- Implied Move: ±2.65% (±$12.79)
- Expected Range: $470.62 - $496.20
- Days to Expiry: 16 days
- Reliability: HIGH ✅
- Key Context: This expiration comes BEFORE Q2 earnings (late January), so it's pricing in normal volatility without the earnings event.
Quarterly Triple Witch (March 20, 2026):
- Implied Move: ±7.97% (±$38.51)
- Expected Range: $444.91 - $521.92
- Days to Expiry: 79 days
- Reliability: HIGH ✅
- Key Context: This range INCLUDES Q2 earnings (late Jan) and potentially Microsoft Build 2026 announcements (May).
Yearly LEAPS (December 18, 2026):
- Implied Move: ±17.62% (±$85.19)
- Expected Range: $398.22 - $568.60
- Days to Expiry: 352 days
- Reliability: HIGH ✅
- Key Context: Full-year range pricing in multiple earnings, Azure growth trajectory, and AI investment outcomes.
What the Implied Moves Tell Us: The market is pricing in low volatility for the near-term (year-end quiet period), moderate volatility into January OPEX, and significant movement potential around the March quarterly expiration that captures Q2 earnings. The big trade we saw today (Feb $460 calls) sits well within the expected range but below the quarterly implied move ceiling of $521.92.
🎪 Catalysts
🔥 Past Catalysts (Already Happened)
Q1 FY2026 Earnings (October 29, 2025) ✅
- Revenue: $77.7B, up 18% YoY - Source
- Azure growth: 40% (39% constant currency) - Source
- Microsoft Cloud revenue: $49.1B, up 26% - Source
- EPS: $4.13 non-GAAP (up 23%), but reduced by $0.41 from OpenAI losses - Source
- Impact: Beat expectations but guided Q2 Azure to "only" 37% growth due to capacity constraints - Source
GPT-5.2 Integration (December 11, 2025) ✅
- Microsoft integrated OpenAI's GPT-5.2 into Microsoft 365 Copilot same-day as release - Source
- Delivers improved reasoning, context understanding, and coding abilities - Source
- Impact: Strengthens Copilot value proposition for enterprise adoption
Anthropic Partnership (September 24, 2025) ✅
- Microsoft partnered with Anthropic to power Microsoft 365 Copilot - Source
- Added Claude Sonnet 4 and Claude Opus 4.1 models as alternatives to OpenAI - Source
- Impact: Reduces OpenAI dependency risk and gives customers model choice
Microsoft Ignite 2025 (November 18, 2025) ✅
- Announced 12 new Microsoft-built AI agents across security and productivity - Source
- Introduced Agent 365 unified control plane and Copilot Studio Lite - Source
- Impact: Demonstrates AI leadership and enterprise platform expansion
FTC Case Dismissed (May 22, 2025) ✅
- FTC dropped antitrust case against $68.7B Activision Blizzard acquisition - Source
- Gaming division revenue up 43% in Q1 FY2026 with Activision contribution - Source
- Impact: Removes regulatory overhang; gaming integration progressing
🚀 Upcoming Catalysts (What to Watch)
Q2 FY2026 Earnings (Expected Late January 2026) 🎯
- Date: January 28, 2026 (estimated) - Source
- Revenue Guidance: $79.5 - $80.6B (+14-16% YoY) - Source
- Azure Guidance: ~37% constant currency growth - Source
- Key Metrics to Watch:
- Azure AI services adoption rate and revenue contribution
- Copilot enterprise seat growth (current pricing: $30/user/month standard, $21/user/month for SMB)
- OpenAI investment impact on EPS (Q1 hit: -$0.41)
- Gaming revenue seasonality (holiday quarter should be strong)
- Capacity constraint resolution timeline
- Why It Matters: This is the BIG ONE. Market wants to see if Azure can maintain momentum and whether Copilot is actually driving meaningful revenue. Any beat on Azure or Copilot adoption could send MSFT back toward $500+.
Microsoft Build 2026 (Expected May 2026) 🎯
- Status: Confirmed event, relocating from Seattle to new location TBD - Source
- Expected Timing: May 2026 (based on historical pattern)
- Format: TBD (in-person, virtual, or hybrid)
- Expected Announcements:
- Windows 12 updates and AI integration
- Copilot and AI agent roadmap evolution
- Azure AI infrastructure expansion updates
- Developer tools and platform updates
- Why It Matters: Major developer conference where Microsoft unveils its technology roadmap. Could be a catalyst for re-rating if they show clear AI monetization path.
Azure Capacity Relief (H1 2026) 🎯
- Fairwater AI Superfactory (Wisconsin): $7+ billion facility with hundreds of thousands of Nvidia GB200 GPUs set to go online early 2026 - Source
- Global Expansion: $17.5B India investment, $5.4B Canada, $10B Portugal deployments - Source
- Revenue Potential: If capacity constraints ease, Azure growth could reaccelerate from 37% guidance back to 40%+
- Why It Matters: Capacity constraints are currently the main limiter on Azure revenue. New data centers coming online could unlock significant upside.
Game Pass & Gaming Integration 🎯
- Current Subscribers: 37M (target: 50M by end of 2025) - Source
- PC Game Pass Growth: 30%+ in Q2 2025 - Source
- Call of Duty Integration: Black Ops 6 set franchise records and drove record Game Pass sign-ups - Source
- Why It Matters: Gaming is often overlooked, but it's a $5B+ annual recurring revenue stream that's growing and diversifying MSFT's business.
🎲 Price Targets & Probabilities
Using Gamma Levels and Implied Move for Price Targets:
🐂 Bull Case: $500-$510 (Bull Case Probability: 30%)
Catalysts Required:
- Q2 earnings beat with Azure >38% growth
- Strong Copilot adoption metrics (seat growth >20% QoQ)
- Capacity constraints showing signs of easing
- Continued AI infrastructure investment enthusiasm
Gamma Resistance to Break:
- Must clear $485 (currently testing) → $490 → $500
- $500 has massive call gamma ($21.37M net call bias) - heavy resistance
- March implied move ceiling of $521.92 shows options market sees potential
Why $500-$510: According to Wedbush's Daniel Ives, who maintains a $625 target, Azure AI momentum supports a $500+ fair value. However, getting through gamma resistance at $500 and $510 requires strong fundamental catalysts.
😐 Base Case: $475-$490 (Base Case Probability: 50%)
Expected Path:
- Consolidation into Q2 earnings around current gamma-heavy zone
- $480 support holds on any weakness
- $485-$490 resistance caps upside without new catalysts
Why This Range:
- Gamma levels show $480-$490 as the highest concentration of options interest
- January monthly implied move of $470.62-$496.20 encompasses this range
- Price tends to gravitate toward high gamma zones (market maker hedging)
- Azure growing 37% is good but not explosive enough to break out without capacity relief
Key Levels:
- Support: $480 → $475 → $470
- Resistance: $485 → $490 → $495
🐻 Bear Case: $460-$470 (Bear Case Probability: 20%)
Risk Factors:
- Q2 earnings disappoint (Azure <35% or weak Copilot metrics)
- OpenAI investment losses exceed expectations (>$0.50 EPS drag)
- Broader tech selloff or market correction
- Valuation concerns at 34x earnings become too hard to justify
Gamma Support:
- $470 has $21.36M total GEX with put bias
- $460 (today's trade strike) has $17.47M GEX - significant support
- March implied move floor of $444.91 shows downside potential exists
Why $460-$470: The big trade today closing $460 calls suggests institutional players see this as deep support. If MSFT breaks $470, $460 becomes the line in the sand. Below that, technical damage would be significant.
What Could Trigger This:
- AI investment returns questioned by market
- Enterprise IT spending slowdown
- Unexpected competitive pressure from AWS or Google Cloud
- Macro deterioration (recession fears, rate hikes)
💡 Trading Ideas
🛡️ Conservative: Cash-Secured Put at Support
The Play: Sell Jan 16, 2026 $475 puts for ~$8-10 credit
Why This Works:
- You're getting paid to potentially buy MSFT at $475, which is:
- 1.75% below current price
- A key gamma support level ($22.60M total GEX)
- Within the monthly implied move range ($470.62-$496.20)
- Near analyst consensus "strong buy" levels
- Return: 1.7-2.1% in 16 days if MSFT stays above $475
- Breakeven: $465-$467 (even if assigned, you're buying at reasonable support)
Risk: If MSFT tanks through $475, you're buying 100 shares at $475 (minus your premium collected)
Probability of Success: ~70% (based on implied move and gamma support)
Who This Is For: Investors who want to own MSFT at a discount and generate income while waiting
⚖️ Balanced: Bull Put Spread Targeting $480 Support
The Play:
- Sell Feb 20, 2026 $480 put for ~$12-14
- Buy Feb 20, 2026 $470 put for ~$7-8
- Net Credit: $5-6 per spread
- Max Risk: $5-4 (width of spread minus credit)
- Max Profit: $5-6 credit received
Why This Works:
- $480 is THE strongest gamma support level ($41.79M total GEX)
- 51 days to expiration (same as today's big trade) captures time decay
- Short put at support, long put at secondary support
- Q2 earnings (late Jan) happens during this period - you want gamma support working for you
Return Potential:
- Max Return: 100-150% if MSFT stays above $480 (keep full credit)
- Breakeven: $474-$475 (strong support zone)
Risk: Max loss of $400-500 per spread if MSFT closes below $470 at expiration
Probability of Success: ~65% (MSFT needs to stay above $480, which is 0.72% below current)
Who This Is For: Traders who want defined risk and believe MSFT consolidates in current range through Q2 earnings
🚀 Aggressive: Call Debit Spread Playing Earnings Pop
The Play:
- Buy Jan 30, 2026 $485 call for ~$8-10 (ATM)
- Sell Jan 30, 2026 $495 call for ~$4-5
- Net Debit: $4-5 per spread
- Max Risk: $4-5 (premium paid)
- Max Profit: $6-5 (width of spread minus debit)
Why This Works:
- Positioned for Q2 earnings (Jan 28, expected) with expiration Jan 30
- If MSFT beats and pops to $495+, you max out profit
- Limited downside (only your debit) if earnings disappoint
- $485-$495 is within gamma resistance zone but before $500 wall
Return Potential:
- Max Return: 120-167% if MSFT closes above $495 after earnings
- Breakeven: $489-$490 (need a 1-1.4% move up)
Risk: Total loss of $4-5 premium if MSFT is below $485 after earnings
Probability of Success: ~40% (requires earnings beat AND breakout above resistance)
Who This Is For: Traders with strong conviction on Q2 earnings beat who want leveraged exposure with defined risk
Alternative Aggressive Play - "Smart Money Copycat": If you believe the institutional trader who closed today saw something, you could do the OPPOSITE by buying Feb 20, 2026 $460 calls at ~$28-30. You'd need MSFT to stay above ~$488-$490 at expiration to profit, but you're buying the same strike the smart money just exited with 51 days of runway.
⚠️ Risk Factors
Let's be real about what could derail the bull case:
1. AI Investment Returns Under Scrutiny 🔍
- MSFT spent $34.9B in Q1 capex (up 74% YoY) - Source
- OpenAI investments cost $0.41 per share in Q1 EPS - Source
- Full FY2026 capex expected ~$120B (vs $88.2B in FY2025) - Source
- Risk: If Azure AI revenue doesn't scale fast enough to justify spend, multiple compression could hit hard
2. Copilot Adoption Challenges 😰
- CEO Nadella admitted Copilot integrations with Gmail/Outlook "don't really work" and are "not smart" - Source
- Carnegie Mellon study shows AI agents fail 70% of real-world office tasks - Source
- Risk: If enterprise customers don't see ROI on $30/user/month Copilot subscriptions, growth could stall
3. Capacity Constraints Persist ⛔
- Azure guided to 37% growth (down from 40% in Q1) due to capacity limits - Source
- Constrained through at least end of FY2026 (June 2026) - Source
- Risk: Can't sell what you can't deliver - capacity issues could hand market share to AWS or Google
4. Valuation Leaves No Margin for Error 💰
- Trading at 34x earnings, 46x free cash flow - Source
- Requires sustained 15%+ FCF growth to justify current multiple - Source
- YTD return of +16.65% underperforming S&P 500's +17.67% - Source
- Risk: Any earnings miss or guidance cut could trigger multiple compression
5. OpenAI Relationship Risks 🤝
- Speculation that OpenAI is exploring alternative chip suppliers - Source
- OpenAI's independence could weaken MSFT's competitive moat
- Risk: If OpenAI becomes less exclusive, MSFT's AI advantage diminishes
6. Insider Selling Continues 📉
- Net -$288M in insider selling over 2 years - Source
- CEO Nadella sold $75.3M (149,205 shares) in September - Source
- 15,600 shares sold in last 30 days worth $7.63M - Source
- Risk: Persistent selling by executives who know the business best is a yellow flag
7. Gaming Integration Costs 🎮
- Activision Blizzard incurred $440M operating loss in Q1 from integration costs - Source
- Game Pass growth slowing (37M subscribers vs 50M target) - Source
- Risk: If gaming integration drags on profitability, it could weigh on overall margins
8. Macro Headwinds 🌪️
- Elevated interest rates pressure growth stock valuations
- Potential enterprise IT spending slowdown in 2026
- Geopolitical tensions (China exposure, export restrictions)
- Risk: MSFT isn't immune to broader market or economic weakness
🎯 The Bottom Line
Real talk: Today's $18M closing trade isn't a bearish signal - it's smart money locking in profits on a winning position. Someone who bought these Feb $460 calls weeks or months ago is walking away with serious gains (collecting $36.15 on options that are $25.50 in-the-money).
Here's the deal:
If You Own MSFT Stock: ✅ Hold through Q2 earnings (late January). The setup is solid:
- Azure growing 40% (even if slowing to 37% next quarter)
- Trading at gamma support ($480) with strong put protection
- 34 out of 34 analysts say Buy or Strong Buy (consensus $628 target) - Source
- Long-term AI infrastructure buildout thesis intact
Consider selling covered calls at $490 or $495 (Feb expiration) to collect premium on resistance.
If You're Watching from the Sidelines: 👀 Wait for Q2 earnings clarity before deploying big capital. Key questions:
- Can Azure maintain 37%+ growth or show acceleration?
- Is Copilot actually driving meaningful seat growth?
- When do capacity constraints ease?
- What's the updated capex outlook?
Use the conservative cash-secured put strategy at $475 to generate income while waiting for a better entry.
If You're Bearish: 🐻 The gamma support at $480 is real. Short-term puts or put spreads could work if you think MSFT breaks support, but you're fighting:
- Institutional ownership of 82.83% - Source
- Strong analyst consensus
- Gamma support creating a floor
- Upcoming earnings catalyst that could surprise to upside
Better to wait for a confirmed break below $475 before getting aggressive short.
Mark Your Calendar: 🗓️ January 28, 2026 (estimated) - Q2 FY2026 Earnings 🗓️ January 30, 2026 - January monthly options expiration (post-earnings) 🗓️ February 20, 2026 - The expiration date of today's big trade 🗓️ March 20, 2026 - Quarterly triple witch (captures full earnings reaction)
My Take: MSFT is in a consolidation phase after a strong run, with the market waiting for Q2 earnings to set the next direction. The $480-$490 gamma zone is where we'll likely chop until late January. The institutional trader closing $18M in calls isn't panicking - they're managing risk and booking profits, which is exactly what disciplined traders should do.
The bull case remains intact IF Azure maintains momentum and Copilot shows adoption traction. But at 34x earnings with $120B in annual capex, there's no room for disappointment.
Play it smart: use gamma support levels ($480, $475, $470) as your guide, size positions appropriately, and wait for Q2 earnings to provide clarity. The options market is pricing in a ±$13 move for January monthly - respect that volatility and don't get overleveraged either direction.
Disclaimer: This analysis is for educational purposes only and does not constitute financial advice. Options trading involves substantial risk and is not suitable for all investors. Past performance does not guarantee future results. Always conduct your own research and consider consulting with a licensed financial advisor before making investment decisions. The author may or may not hold positions in MSFT.
Analysis generated December 31, 2025 | Data sources: Options flow data, gamma exposure analysis, implied volatility calculations, and publicly available market research