MSFT $27M Call Bet - Smart Money Buying the Post-Earnings Dip on Microsoft
January 29, 2026 | Unusual Activity Detected
The Quick Take
Someone just dropped $27 MILLION on MSFT calls this morning at 09:38:30! This aggressive buyer grabbed 15,000 contracts of the $435 strike calls expiring March 20th -- buying into a stock that just fell ~12% overnight after Q2 FY2026 earnings. With Microsoft reporting record $81.3B revenue (beat!) and $4.14 EPS (beat!), yet getting hammered on $37.5B capex and slowing Azure growth, this institutional buyer is making a clear statement: the sell-off is overdone, and MSFT is heading back above $435 within 50 days.
Company Overview
Microsoft Corp (MSFT) is the world's largest software company and a dominant force in cloud computing and AI infrastructure:
- Market Cap: $3,579.7 Billion (one of the world's most valuable companies)
- Industry: Services-Prepackaged Software
- Current Price: ~$424 (down ~12% post-earnings from ~$480)
- Primary Business: Windows OS, Microsoft 365, Azure cloud platform, AI/Copilot products, gaming (Xbox), LinkedIn, and strategic AI investments including OpenAI and Anthropic
The Option Flow Breakdown
The Tape (January 29, 2026 @ 09:38:30):
| Time | Symbol | Side | Buy/Sell | Type | Expiration | Premium | Strike | Volume | OI | Size | Spot | Option Price | Option Symbol |
|---|---|---|---|---|---|---|---|---|---|---|---|---|---|
| 09:38:30 | MSFT | MID | BUY | CALL $435 | 2026-03-20 | $27M | $435 | 15K | 15K | 15,000 | $432.70 | $18.15 | MSFT20260320C435 |
What This Actually Means
This is a bullish directional bet into the teeth of a massive sell-off. Here is what stands out:
- Premium paid: $27M ($18.15 per contract x 15,000 contracts)
- Entry timing: Bought at $432.70 spot -- MSFT opened at ~$456.70 and was already dropping hard, meaning this buyer stepped in as panic selling accelerated
- Strike selection: $435 is slightly out-of-the-money (spot at $432.70), needing only a ~0.5% move to get back to the strike
- Breakeven at expiration: $453.15 ($435 strike + $18.15 premium) -- roughly a 4.7% rally from spot at entry
- Notional exposure: 15,000 contracts = 1.5 million shares = ~$652M notional position
- Expiration: March 20 quarterly OPEX gives 50 calendar days for the thesis to play out
What is really happening here: This trader is buying the dip with leverage. MSFT just reported its best quarter ever -- $81.3B revenue, record cloud revenue above $50B, 15 million Copilot paid seats -- and the stock is getting punished for spending too much on AI infrastructure. The call buyer sees this as a classic overreaction. With Wall Street consensus price targets averaging $628-$633 (49% above current levels) and the stock trading near 30x earnings (its cheapest valuation in over a year), this is a high-conviction "buy the dip" play.
The MID fill (between bid and ask) suggests institutional execution -- retail traders rarely get mid-market fills on 15,000-lot orders. This is a professional shop deploying serious capital.
Technical Setup / Chart Check-Up
One Calendar Year Chart
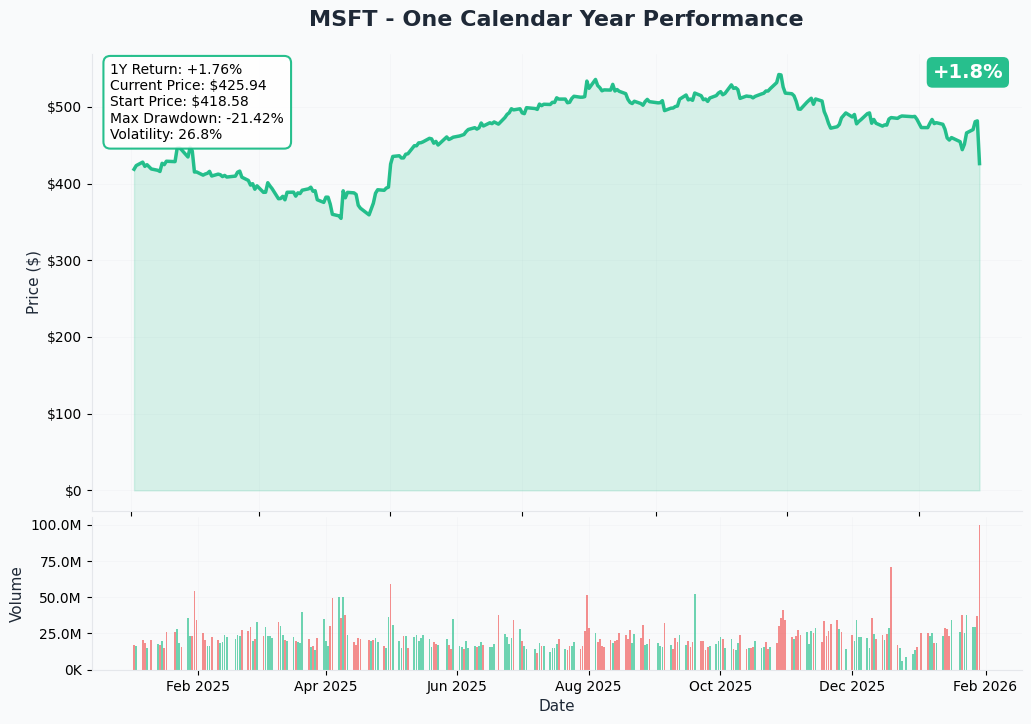
MSFT is up a modest +1.3% YTD at ~$424, but the year-to-date number masks the dramatic intraday action. The stock reached an all-time closing high of $541.06 on October 28, 2025, then traded down into the $470-$480 range heading into earnings. The January 29 sell-off represents the 7th largest single-day drop in MSFT history.
Key observations:
- Post-earnings crash: ~12% gap down from ~$480 to ~$424 on record volume (96.28M shares vs. 30.85M average)
- 52-week range: $344.79 to $555.45 -- currently trading in the lower third of that range
- Valuation reset: P/E compressed from ~35x to ~30x in a single session -- cheapest in over a year
- Support levels in play: Need to see where buyers step in after the dust settles
- Volume confirmation: Massive 3x average volume signals genuine institutional repositioning, not just retail panic
Gamma-Based Support & Resistance Analysis
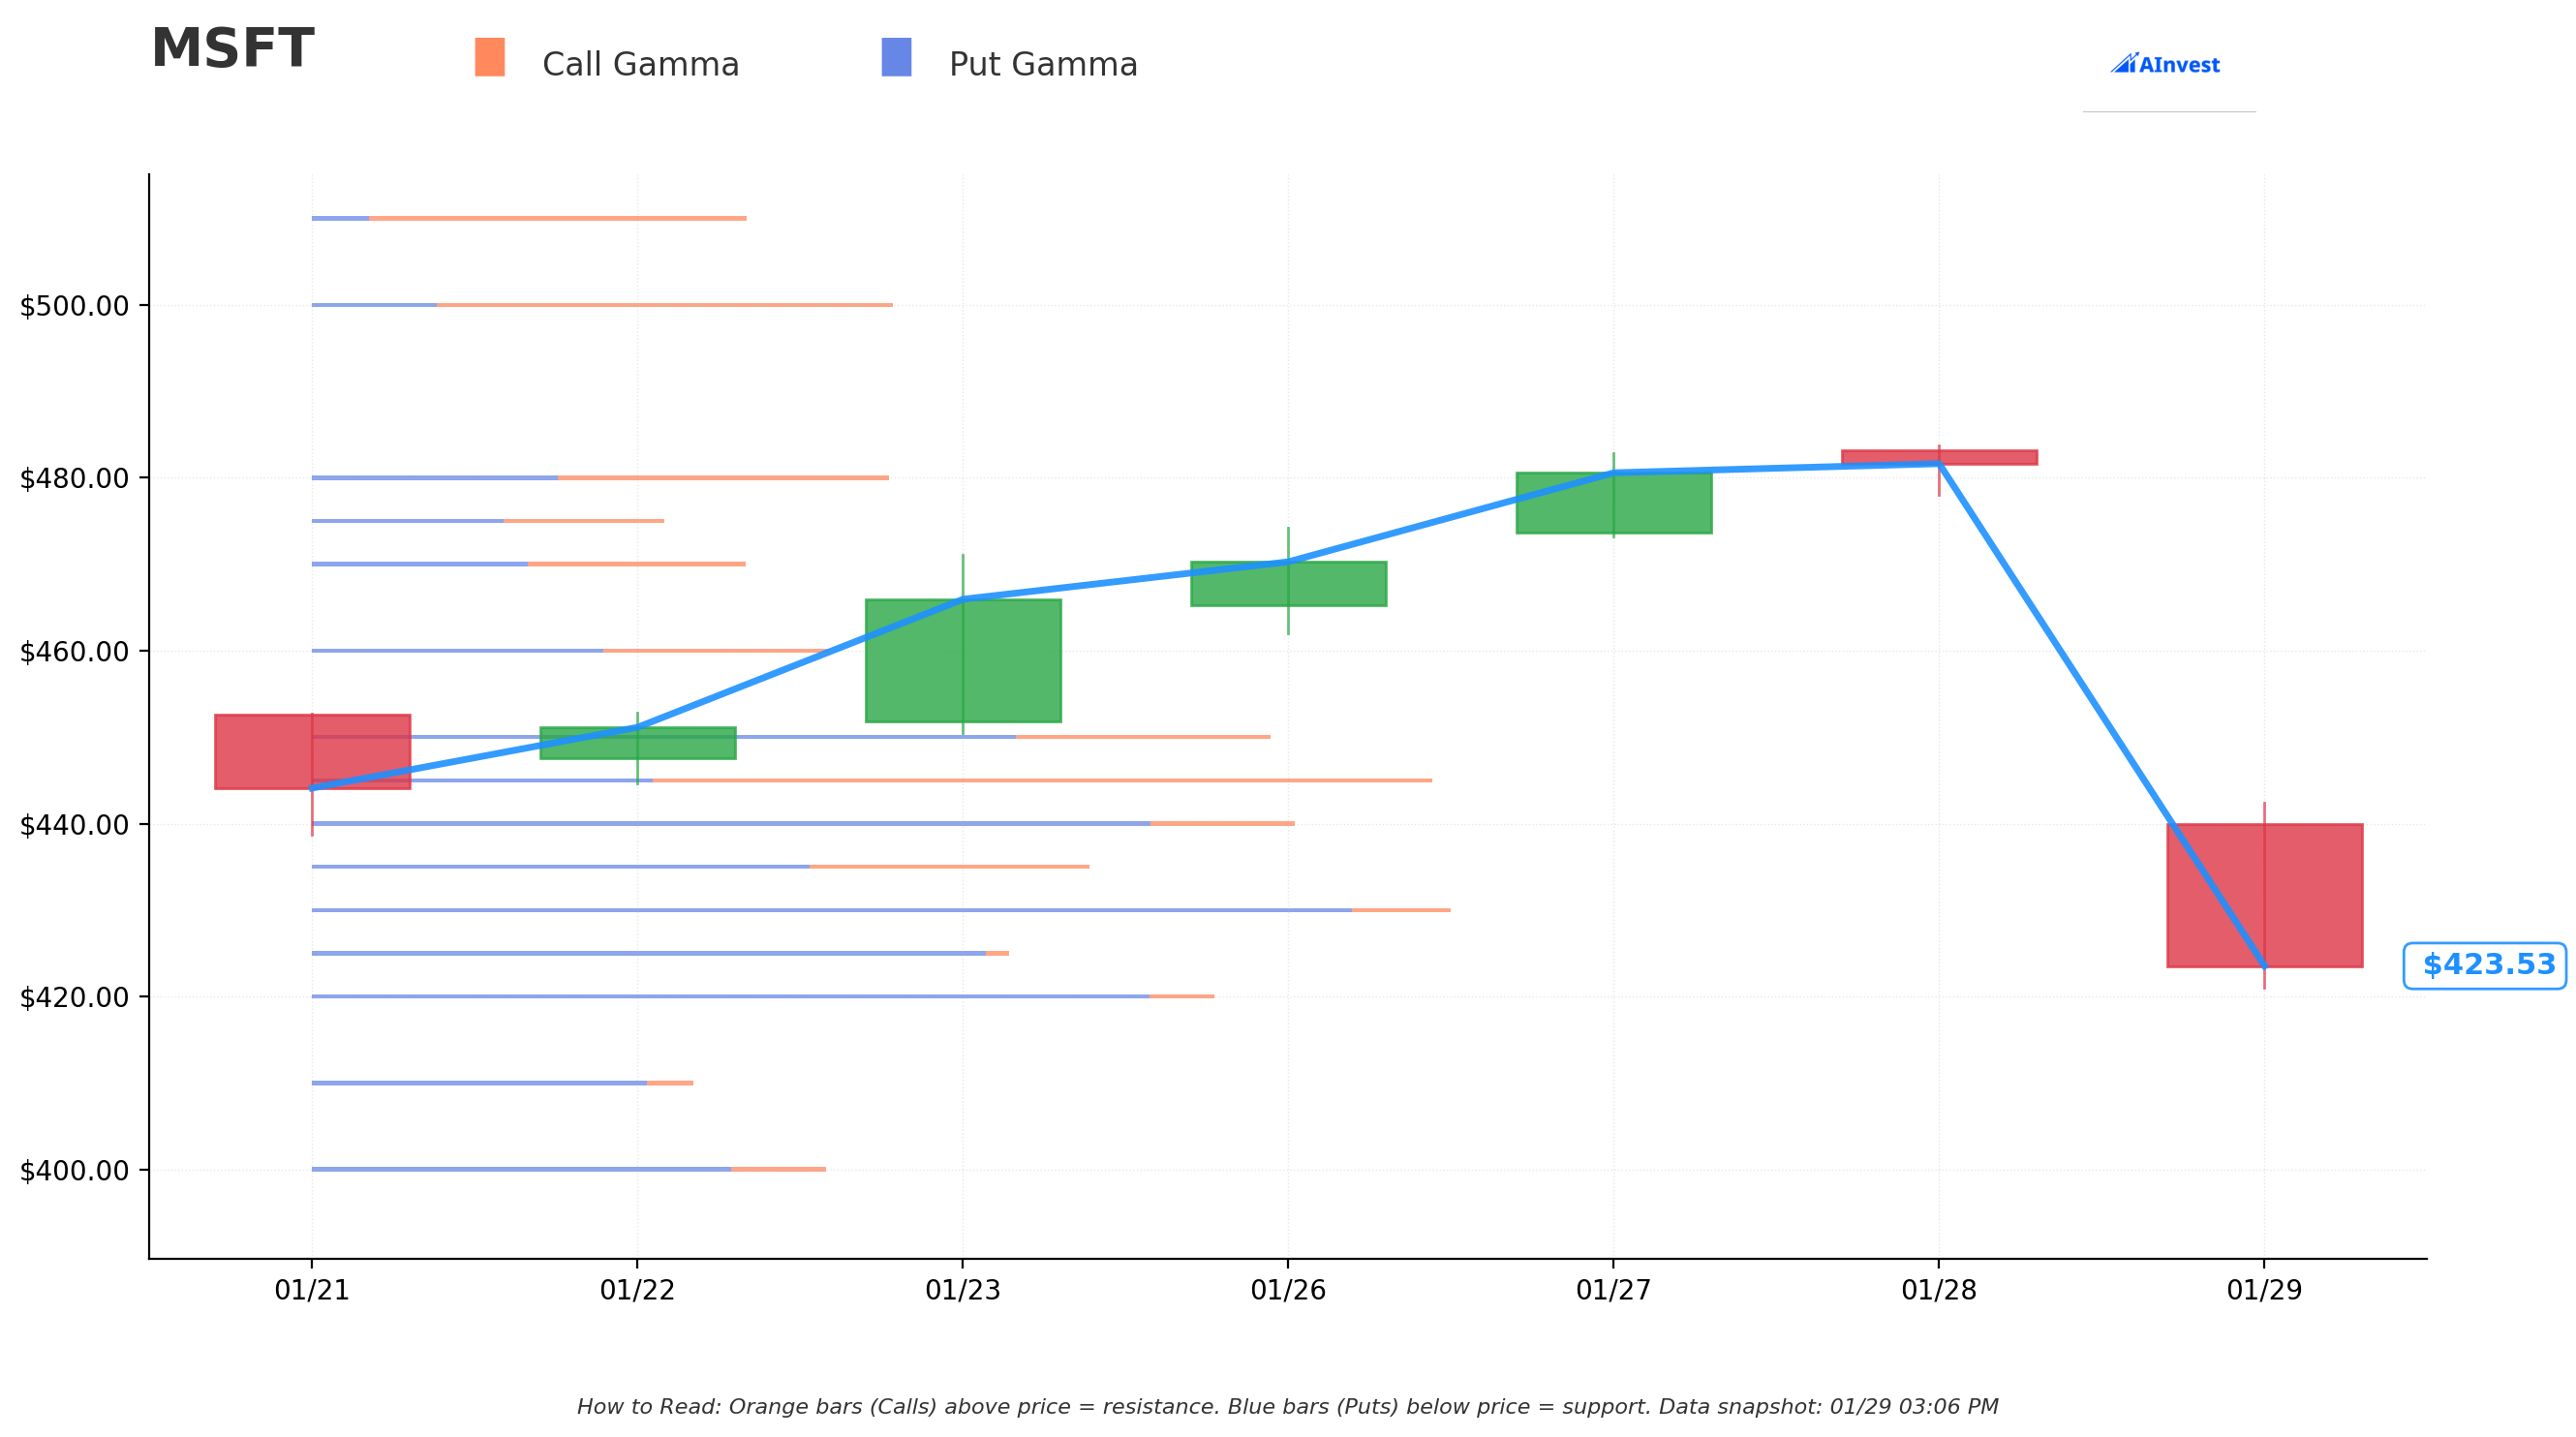
Current Price: $423.83
The gamma exposure map reveals where market maker hedging flows will create natural price barriers:
Support Levels (Put Gamma Below Price):
- $420 - Immediate support and round-number psychological level
- $400 - Major structural floor and key round-number magnet
Resistance Levels (Call Gamma Above Price):
- $425 - First overhead barrier (very close to current price)
- $430 - Near-term resistance
- $435 - THE STRIKE of this call trade! Market makers hedging 15,000 new contracts here
- $440 - Secondary resistance
- $445 - Mid-range ceiling
- $450 - Major round-number resistance
- $480 - Pre-earnings level (significant overhead supply from trapped buyers)
- $500 - Extended upside target
What this means for traders: MSFT is sitting just above the $420 support level with a wall of resistance overhead from $425 to $450. The $435 call strike adds a new gamma node -- as market makers who sold these calls delta-hedge, they will need to buy stock as price rises toward $435, creating a self-reinforcing "magnet" effect. However, the dense resistance levels from $425 to $450 suggest the recovery will be a grind, not a straight-line rally.
Notice this: The call buyer chose the $435 strike -- right at the first cluster of meaningful gamma resistance. If MSFT can reclaim $435, the hedging dynamics flip in the buyer's favor as dealers buy more stock to stay hedged, potentially accelerating a move toward $440-$450.
Net GEX Bias: Bearish -- the post-earnings sell-off has shifted dealer positioning defensively. This typically means higher realized volatility and larger intraday swings until positioning stabilizes.
Implied Move Analysis
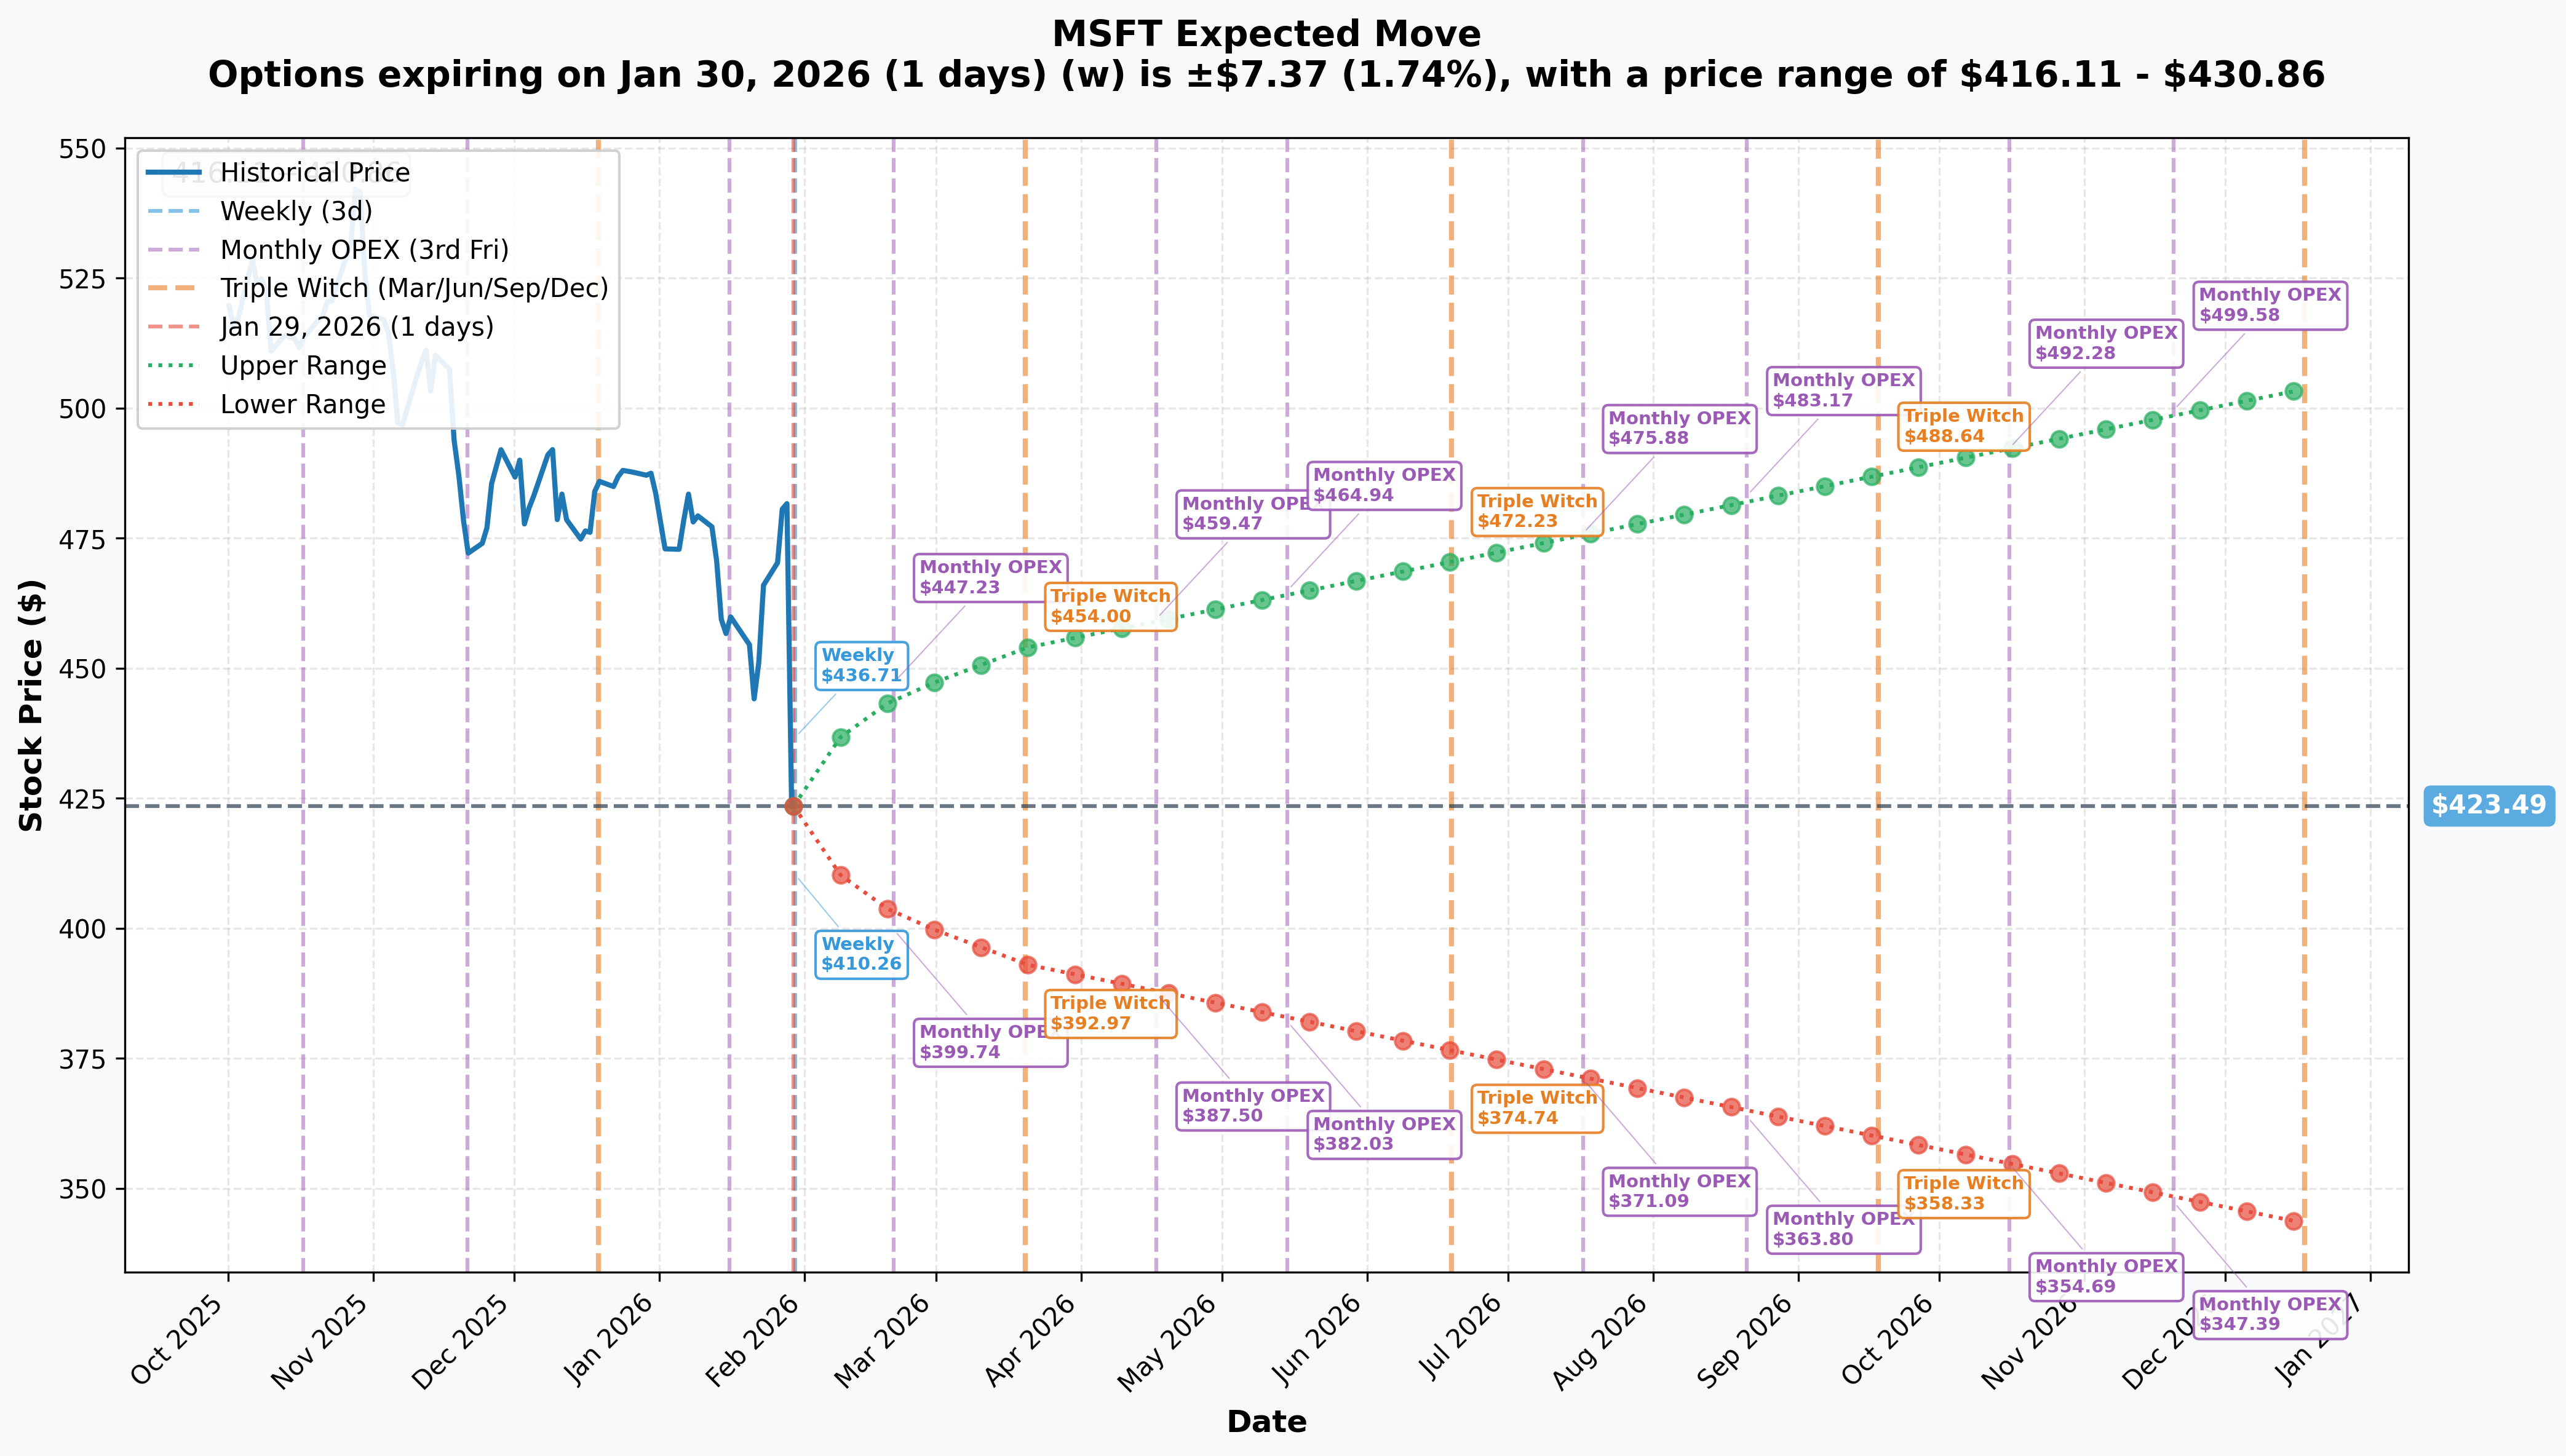
Options market pricing for upcoming expirations:
- Weekly (Jan 30 - 1 day): +/-1.74% (+/-$7.37) -- Range: $416.11 - $430.86
- Monthly OPEX (Feb 20 - 22 days): +/-4.97% (+/-$21.04) -- Range: $402.45 - $444.52
- Quarterly OPEX (Mar 20 - 50 days - THIS TRADE!): +/-7.21% (+/-$30.51) -- Range: $392.97 - $454.00
- Yearly LEAPs: +/-20.5% (+/-$86.65) -- Range: $336.84 - $510.14
Translation for regular folks: Options traders expect MSFT to move about $7 by tomorrow's close and roughly $30 in either direction by the March 20 expiration. The upper bound of the quarterly implied move ($454) would represent a solid recovery from today's sell-off and sits above the call buyer's $435 strike but below the $453.15 breakeven. The lower bound ($393) would represent further deterioration if the AI spending narrative worsens.
Key insight: The call buyer's breakeven of $453.15 sits within the upper half of the quarterly implied move range. The market is essentially saying there is a meaningful probability MSFT recovers to this level by March -- the buyer just needs the stock to trade in the upper portion of the expected range, not make an extreme move.
Catalysts
Immediate Catalyst -- Q2 FY2026 Earnings Reaction (January 29, 2026)
Microsoft reported Q2 FY2026 results on January 28, 2026, beating on every key financial metric but cratering ~12% on January 29 -- the 7th largest single-day drop in MSFT history. Key results:
- Revenue: $81.3B (+17% YoY), beating guidance high of $80.6B
- EPS: $4.14 non-GAAP (+7.3% beat) vs. $3.86 consensus; GAAP EPS $5.16 (+60% YoY)
- Cloud Revenue: $51.5B (+26% YoY) -- first time crossing the $50B mark
- Azure Growth: 39% constant currency, beating 37-38% guide but decelerating from 40% in Q1
- Capital Expenditure: $37.5B (+66% YoY), exceeding $34.31B expectations -- the primary reason for the sell-off
- Copilot Adoption: 15 million paid seats (+160% YoY), GitHub Copilot +75% YoY subscribers
- Operating Margin: 47.1% vs. 45.8% guidance high -- beat!
- Commercial RPO: $625B (+110% YoY), but ~45% tied to OpenAI's $250B commitment
Why the stock sold off despite the beat:
- Record $37.5B capex ($150B annualized) spooked investors on AI ROI timeline
- Azure growth deceleration: 40% -> 39% -> guided 37-38% for Q3
- OpenAI concentration risk: 45% of $625B backlog is one customer
- Q3 implied operating margin 45.1% below 45.5% consensus
- Capacity constraints admitted to persist through at least June 2026
Near-Term Catalysts (Next 3 Months)
Q3 FY2026 Earnings -- Late April 2026 (~April 29)
This is the next major inflection point and falls AFTER the March 20 call expiration. Key metrics to watch:
- Azure growth: Guided 37-38% constant currency -- any stabilization or re-acceleration would be very bullish
- Revenue consensus: ~$81.2B (guided $80.65B-$81.75B)
- Capital expenditure trajectory: Will it moderate or continue climbing?
- Copilot monetization: Can seat growth sustain 100%+ YoY pace?
- Operating margin: Can it stabilize above 45%?
- OpenAI RPO recognition: How quickly is the $250B commitment converting to revenue?
Analyst Re-Ratings (Coming Days/Weeks)
Wall Street consensus remains Strong Buy with average price target of $628-$633, representing ~49% upside from current levels. Notable targets include Wells Fargo at $665 (January 8, 2026) and Citigroup at $690 (October 30, 2025). These were set BEFORE the sell-off -- expect revisions in coming days, but even material cuts would leave significant upside.
Microsoft Build 2026 -- May 2026
The annual developer conference typically features major AI product announcements. The transition from Copilot assistants to autonomous AI agents ("Agentic Enterprise") is expected to be a major theme, potentially reigniting the AI monetization narrative.
Strategic Developments
Anthropic Partnership (November 2025): $5B investment in Claude-maker Anthropic, diversifying AI model partnerships beyond OpenAI -- reduces single-vendor dependency risk.
Cognizant Partnership (December 2025): Multi-year deal embedding agentic AI and Copilot into enterprise workflows across healthcare, retail, financial services, and manufacturing.
Osmos Acquisition (January 5, 2026): Acquired agentic AI data engineering startup for integration into Microsoft Fabric -- expanding AI capabilities across the data platform.
AI Capacity Expansion: Microsoft plans to increase total AI capacity by 80%+ in FY2026 and double datacenter footprint over 2 years. Easing of capacity constraints could unlock suppressed Azure demand.
Risk Catalysts
OpenAI Concentration & Partnership Risk:
- 45% of $625B RPO is tied to OpenAI
- FTC and EU investigating whether the relationship constitutes a "de facto merger"
- Consumer antitrust class action filed in Northern District of California
- OpenAI reportedly considered filing antitrust complaint against Microsoft
AI Capex ROI Uncertainty: $37.5B/quarter capex (~$150B annualized) may not yield proportional revenue growth. Combined hyperscaler capex from Microsoft, Meta, Alphabet, Amazon expected to exceed $470B in 2026. If enterprise AI adoption disappoints, MSFT faces years of margin compression.
Workforce Restructuring: Reports of potential layoffs affecting 11,000-22,000 positions (5-10% of ~220,000 workforce) as part of AI-driven restructuring -- signals cost pressure.
Price Targets & Probabilities
Using gamma levels, implied move data, and the post-earnings setup, here are the scenarios through the March 20th expiration:
Bull Case (30% probability)
Target: $450-$480
How we get there:
- Analyst re-ratings confirm "Strong Buy" with targets $580+ even after modest cuts -- institutional buying cascades
- February price stabilization around $430-$440 as sell-off digestion completes
- Copilot/AI monetization data points emerge (customer wins, enterprise adoption metrics) that reframe the capex narrative as investment, not waste
- Broader market strength lifts mega-cap tech -- sector rotation back into quality
- Azure customer wins announced that demonstrate capacity buildout is demand-driven
- Short covering and momentum buyers push stock through $435-$450 gamma resistance
Call trade P&L in Bull Case:
- MSFT at $460 on Mar 20: Calls worth $25.00, profit = $6.85/contract x 15,000 = $10.3M (38% ROI)
- MSFT at $480 on Mar 20: Calls worth $45.00, profit = $26.85/contract x 15,000 = $40.3M (149% ROI)
Base Case (45% probability)
Target: $415-$445 range (STABILIZATION AND RECOVERY)
Most likely scenario:
- Stock finds support in $415-$425 range as institutional buyers accumulate at discount
- Gradual recovery toward $435-$445 over 4-6 weeks as sell-off fear subsides
- Analyst revisions bring targets down from $630 to $550-$580 range -- still massive upside
- No new fundamental catalysts until Q3 earnings in late April -- stock drifts in range
- Volatility compresses as market digests the capex narrative
- Pre-Q3 earnings positioning begins in March, potentially adding bid
Call trade P&L in Base Case:
- MSFT at $435 on Mar 20: Calls worth $0 (at-the-money, minimal time value), loss = ~$18.15/contract x 15,000 = ~$27M (near-total loss)
- MSFT at $445 on Mar 20: Calls worth $10.00, loss = $8.15/contract x 15,000 = $12.2M (45% loss)
Important note: In the base case, the call buyer likely does NOT hold to expiration. They will likely take profits on any bounce toward $445-$450 or cut losses if the stock fails to reclaim $435 within 2-3 weeks.
Bear Case (25% probability)
Target: $380-$415
What could go wrong:
- Sell-off intensifies as more institutional holders de-risk MSFT positions after earnings
- Broader tech sell-off on AI capex concerns (Meta, Alphabet report similar spending patterns)
- OpenAI partnership complications surface (antitrust action, contract renegotiation)
- Azure growth data points suggest further deceleration below 37%
- Macro deterioration -- recession fears, rising rates compress tech multiples
- Break below $420 support triggers momentum selling toward $400 psychological floor
- Negative analyst revisions create downgrade cycle
Call trade P&L in Bear Case:
- MSFT at $400 on Mar 20: Calls expire worthless, loss = $18.15/contract x 15,000 = $27.2M (100% loss)
- MSFT at $380 on Mar 20: Calls expire worthless, loss = $27.2M (100% loss)
Trading Ideas
Conservative: Buy Shares on Stabilization
Play: Accumulate MSFT shares in the $415-$425 zone once post-earnings selling pressure subsides (give it 3-5 trading days)
Why this works:
- MSFT just reported record revenue ($81.3B) and beat on every metric -- the business is not broken
- At ~30x forward P/E, this is the cheapest MSFT has been in over a year
- Analyst consensus average target of $628-$633 implies ~49% upside even before post-earnings revisions
- Cloud revenue crossed $50B for the first time -- secular growth story intact
- Post-earnings selling typically exhausts within 3-5 sessions on mega-caps
- You get paid to wait: MSFT pays a dividend (~0.8% yield) and has a $60B buyback program
Action plan:
- Wait 3-5 trading days for selling pressure to exhaust (target entry $415-$425)
- Scale in: Buy 1/3 position at $425, another 1/3 at $415, final 1/3 at $400 if it gets there
- Stop-loss: Mental stop at $390 (roughly 8% below entry) -- below $400 support suggests deeper structural issues
- Target: $480-$500 over 3-6 months (15-20% upside from $425)
- Hold through Q3 earnings in late April for catalyst
Risk level: Low-Moderate (stock, not options) | Skill level: Beginner-friendly
Balanced: March Call Spread (Defined Risk Bullish)
Play: Buy the March 20 $430/$460 call spread to participate in a recovery with capped risk
Structure: Buy MSFT March 20 $430 calls, Sell MSFT March 20 $460 calls
Why this works:
- Defined risk: Maximum loss is the net debit paid (estimated ~$10-$12 per spread)
- Captures the most likely recovery range ($430-$460) without needing a home run
- Reduces cost basis vs. outright call purchase by selling the $460 cap
- March 20 gives 50 days -- enough time for sell-off recovery and analyst re-ratings
- Mirrors the institutional call buyer's thesis but with built-in risk management
Estimated P&L:
- Cost: ~$10-$12 net debit per spread ($1,000-$1,200 per contract)
- Max profit: $18-$20 per spread if MSFT above $460 at expiration ($1,800-$2,000)
- Max loss: $10-$12 per spread if MSFT below $430 at expiration
- Breakeven: ~$440-$442
- Risk/Reward: ~1.5:1 to 1.8:1
Entry timing:
- Enter within 1-2 days if MSFT holds above $415 support
- Consider widening to $425/$455 if stock dips further
- Skip if stock breaks below $400 (thesis invalidated)
Position sizing: Risk 3-5% of portfolio maximum
Risk level: Moderate (defined risk, directional) | Skill level: Intermediate
Aggressive: Outright March $435 Calls (Copy The Flow)
Play: Buy MSFT March 20 $435 calls -- the exact same trade as the $27M institutional buyer
Why this could work:
- Following a $27M institutional conviction trade with clear thesis (sell-off overdone)
- MSFT beat on every metric -- this is a sentiment-driven sell-off, not a fundamental breakdown
- $435 strike needs only ~2.6% move from current $424 to get back in-the-money
- 50 days gives substantial time for recovery -- no need for immediate bounce
- Analyst targets averaging $628+ provide massive theoretical upside backdrop
- If MSFT simply returns to $460 (still well below pre-earnings levels), calls roughly double
Why this could go wrong (REAL RISKS):
- Time decay is relentless: Theta will eat $0.30-$0.50/day per contract -- roughly $4,500-$7,500/day on a 15,000-lot position
- Sell-off could deepen: If tech capex fears spread (Meta, Alphabet earnings next), MSFT could test $400
- No near-term catalyst: Next earnings not until late April -- 50 days is a long time to wait with no news flow
- Breakeven at $453.15 requires a 7% rally from $424 -- possible but not guaranteed
- 100% loss possible if MSFT stays below $435 at expiration
Estimated P&L (at a retail scale of 1-5 contracts):
- Cost: ~$18.15 per contract ($1,815 per contract)
- MSFT at $460 on Mar 20: Calls worth ~$25, profit ~$685/contract (38% ROI)
- MSFT at $445 on Mar 20: Calls worth ~$10, loss ~$815/contract (45% loss)
- MSFT below $435 on Mar 20: Total loss of $1,815 per contract (100% loss)
IMPORTANT: Do NOT attempt unless you:
- Can afford to lose the entire premium
- Have a plan to cut losses if MSFT breaks below $400
- Understand that time decay accelerates as expiration approaches
- Will consider taking profits at 50-80% gain rather than holding to expiration
- Size the position at 1-3% of portfolio MAXIMUM
Risk level: HIGH (can lose 100% of premium) | Skill level: Advanced
Risk Factors
Do not overlook these potential headwinds:
-
AI capex ROI timeline is unknown: Microsoft is spending $37.5B per quarter ($150B annualized) on AI infrastructure with no clear roadmap for when these investments generate proportional returns. The combined hyperscaler capex from Microsoft, Meta, Alphabet, and Amazon is expected to exceed $470B in 2026. If enterprise AI adoption is slower than expected, years of margin compression lie ahead.
-
OpenAI concentration creates fragility: 45% of the $625B commercial backlog is tied to a single customer -- OpenAI. That is a dangerous level of customer concentration for any business, let alone a $3.5T company. The FTC and EU are both investigating whether the partnership constitutes a "de facto merger," and a consumer antitrust class action has been filed. If the OpenAI relationship fractures or is forced to restructure, MSFT loses its biggest growth narrative.
-
Azure growth is decelerating: The trend is clear -- 40% (Q1) -> 39% (Q2) -> guided 37-38% (Q3). Management attributes this to capacity constraints, but if growth continues declining into the low 30s even as capacity comes online, it suggests demand may be plateauing rather than being supply-limited. This would fundamentally undermine the bull thesis.
-
Post-earnings momentum is negative: Today's sell-off is the 7th largest single-day drop in MSFT history, trading 96.28M shares (3x average volume). This kind of institutional liquidation typically takes days to weeks to fully absorb. Fighting the tape immediately after a high-volume breakdown is risky -- smart money that sold today is not likely to buy back tomorrow.
-
No near-term catalyst to reverse the narrative: Q3 FY2026 earnings are not until late April -- roughly 50 days after the March 20 call expiration. Without a clear fundamental catalyst to change the AI spending narrative, MSFT could drift sideways or lower for weeks. The call buyer is betting on sentiment recovery alone, which is a lower-conviction thesis than catalyst-driven positioning.
-
Macro headwinds could compound the sell-off: At ~30x earnings, MSFT is not cheap in an absolute sense even after the sell-off. If recession fears mount, enterprise IT budgets get cut, or interest rates rise, the multiple could compress further. International revenue (~50% of total) is also exposed to dollar strength headwinds.
-
Insider selling pattern offers no comfort: CEO Satya Nadella's last transaction was a 149,205-share sale ($75M) in September 2025. Net insider activity over the past 3 months shows 54,100 shares sold and zero shares bought. Insiders are not buying their own dip.
-
Bearish gamma positioning amplifies downside: Net GEX bias is bearish, meaning market maker hedging will add to selling pressure on down moves and dampen rallies. This creates an asymmetric environment where downside moves are sharper than upside recoveries until positioning normalizes.
The Bottom Line
Straight talk: An institutional buyer just put $27 million behind the thesis that Microsoft's 12% post-earnings sell-off is a buying opportunity. Looking at the numbers, it is hard to argue the business is impaired -- $81.3B revenue (+17%), $51.5B cloud revenue (record), 15 million Copilot seats, $625B in commercial backlog. The stock sold off because investors are scared about $150B in annual AI spending with uncertain ROI. That is a legitimate concern, but it is a "show me" problem, not a "business is broken" problem.
What this trade tells us:
- At $432.70 spot with a $435 strike, the buyer needs only a modest recovery to get in-the-money
- The March 20 expiration gives 50 days -- enough time for the panic to fade but not enough for Q3 earnings to provide fundamental catalyst
- This is a bet on sentiment recovery and mean-reversion, not on new information
- The $27M size signals institutional conviction, but even institutions can be wrong on timing
If you own MSFT:
- Do NOT panic sell into a 12% down day on record volume -- that is peak fear, and selling at the bottom rarely works out
- If you had a full position, the sell-off may be uncomfortable but MSFT still generates $80B+ quarterly revenue with expanding margins
- Consider adding shares in the $415-$425 range if you have cash and a 6-12 month horizon
- Set a mental floor at $400 -- below that level, the sell-off becomes something more structural
- Remember: analyst consensus still sees 49% upside from here, even if targets get trimmed
If you are watching from the sidelines:
- This is genuinely interesting as an entry point -- MSFT at 30x earnings with record revenue and expanding cloud/AI business is not a bad setup
- Let the dust settle for 3-5 days -- post-earnings selling pressure typically exhausts itself
- Target entry: $415-$425 for shares, or use the balanced call spread strategy to participate with defined risk
- Watch for analyst re-ratings in coming days -- even modest target cuts from $630 to $550 still imply 30%+ upside
- Q3 earnings in late April is the next real fundamental catalyst
If you are bearish:
- The sell-off validates near-term concerns about AI capex ROI and Azure deceleration
- Bearish gamma positioning supports further downside if $420 support breaks
- $400 is the major downside target -- a break below that opens up $380 (near 52-week low territory)
- Be cautious shorting into mega-cap quality names after 12% sell-offs -- mean-reversion is powerful on a multi-week basis
- Consider put spreads rather than outright shorts to define risk
Key dates to watch:
- January 29-February 3 - Post-earnings selling pressure period (watch for stabilization)
- February 20 - Monthly OPEX (+/-4.97% implied move window)
- March 20 - Quarterly OPEX and expiration of the $27M call trade
- Late April (~April 29) - Q3 FY2026 earnings -- the next fundamental catalyst
- May 2026 - Microsoft Build 2026 -- AI product announcements
Final take: The MSFT post-earnings sell-off is a genuine inflection point. The company beat on every metric, but the market is demanding proof that $150B in annual AI spending will translate to proportional returns. The $27M institutional call buy is a vote of confidence that the answer will be yes, or at least that the stock has overshot to the downside. At 30x earnings with $81B quarterly revenue and a $625B backlog, the long-term math is compelling. The short-term trading setup is murkier -- $420 support needs to hold, gamma is bearish, and there is no near-term catalyst before March expiration.
For most investors, the right move is patience. Let the selling exhaust itself, look for stabilization above $415-$420, and then consider building a position for the next leg. MSFT's cloud and AI leadership is not going away -- but neither is the market's demand for AI investment returns.
Disclaimer: Options trading involves substantial risk of loss and is not suitable for all investors. This analysis is for educational purposes only and not financial advice. Past performance does not guarantee future results. The $27M call trade reflects one institution's view and does not imply the trade will be profitable or that you should replicate it. Always do your own research and consider consulting a licensed financial advisor before trading. Post-earnings price action can remain volatile for days, and 12% sell-offs on mega-cap stocks can create further momentum selling. The call buyer may have portfolio context (hedging existing shorts, pairs trading) that makes the trade rational for them but inappropriate for retail investors.
About Microsoft Corp: Microsoft develops and licenses consumer and enterprise software. Known for Windows OS, Office, Azure cloud, and AI investments, with a market cap of $3,579.7 billion in the Services-Prepackaged Software industry.