🐋 MSTR $55.2M Call Roll — Smart Money Repositioning as Bitcoin Bounces Back!
📅 April 10, 2026 | 🔥 Extremely Unusual Activity Detected
🎯 The Quick Take
A single institutional player just executed a $55.2M call roll in MSTR — closing out a near-expiry $135 call for $7.2M and simultaneously opening a fresh short call at the $130 strike for June expiration, pocketing $48M in premium. This is not a panicked exit — it's a methodical repositioning that tells us an institutional player had a big short call position, is rolling it down in strike and out in time, and is collecting massive premium to bet that MSTR stays capped below $130 through mid-June. With Bitcoin recovering from tariff shock and Q1 earnings looming on April 30, this $55.2M move is one of the most significant options plays we've seen in MSTR this year.
📊 Company Overview
Strategy Inc. (MSTR) — formerly known as MicroStrategy — is the world's largest corporate Bitcoin holder and the most audacious Bitcoin bet in public equity markets:
- Market Cap: $44.7 Billion
- Industry: Finance Services / Bitcoin Treasury Company
- Exchange: NASDAQ
- Current Price: ~$130 (April 10, 2026)
- Primary Business: Bitcoin acquisition and treasury management, plus enterprise business intelligence software. The company holds 766,970 BTC at an average cost of $66,385/BTC — that's about 3.6% of all Bitcoin that will ever exist.
Real talk: buying MSTR is essentially buying leveraged Bitcoin exposure through a publicly traded company. When BTC goes up, MSTR typically rockets. When BTC drops, MSTR falls harder. That's the deal.
💰 The Option Flow Breakdown
📊 What Just Happened
The Tape (April 10, 2026):
| Time | Symbol | Buy/Sell | Type | Expiration | Premium | Strike | Volume | OI | Size | Spot | Option Price | Classification |
|---|---|---|---|---|---|---|---|---|---|---|---|---|
| 10:29:50 | MSTR | SELL | CALL $135 | 2026-04-17 | $7.2M | $135 | 64,000 | 59,000 | 30,540 | $130.12 | $2.35 | STC (Sell to Close) |
| 10:29:09 | MSTR | SELL | CALL $130 | 2026-06-18 | $48M | $130 | 62,000 | 7,000 | 30,540 | $130.04 | $15.60 | STO (Sell to Open) |
Total Premium Collected: $55.2M 🔥
🤓 What This Actually Means
This is a Short Call Roll — one of the most disciplined moves an institutional options trader can make. Here's the play-by-play:
-
📌 Leg 1 (STC — Selling to Close): The trader had a short position in the April 17 $135 calls. With MSTR at $130 and only 7 days to expiration, those $135 calls are out-of-the-money and nearly worthless at $2.35. They're closing that winning trade, collecting $7.2M and freeing up margin.
-
📌 Leg 2 (STO — Selling to Open): Simultaneously, they're opening a brand new short position in the June 18 $130 calls at $15.60 per contract, collecting a massive $48M in premium. Notice the strike dropped from $135 all the way to $130 — they're moving the ceiling right to where MSTR is trading right now.
-
💡 The combined math: 30,540 contracts × $15.60 = $47.6M collected + $7.2M from closing = $55.2M total premium in one morning.
What's the thesis here? This trader is essentially saying: "MSTR isn't going above $130 by mid-June, and I'll take $48M to bet on that." The $130 strike sits right at current spot, making this an aggressive at-the-money short call. They're banking on MSTR staying flat or declining through June 18 — think Bitcoin plateauing around $72K, continued tariff pressure keeping risk assets range-bound, or simply time decay working in their favor.
Unusual Score: 🔥 EXTREMELY UNUSUAL on both legs — the combined 64,000 volume in the April leg against 59,000 OI (volume exceeds OI!) and 62,000 volume in the June leg against just 7,000 OI is extraordinary. This June leg alone created nearly 9x the existing open interest in one trade. We're talking maybe a few times a year does a single options player move this kind of size in MSTR.
📈 Technical Setup / Chart Check-Up
YTD Performance Chart
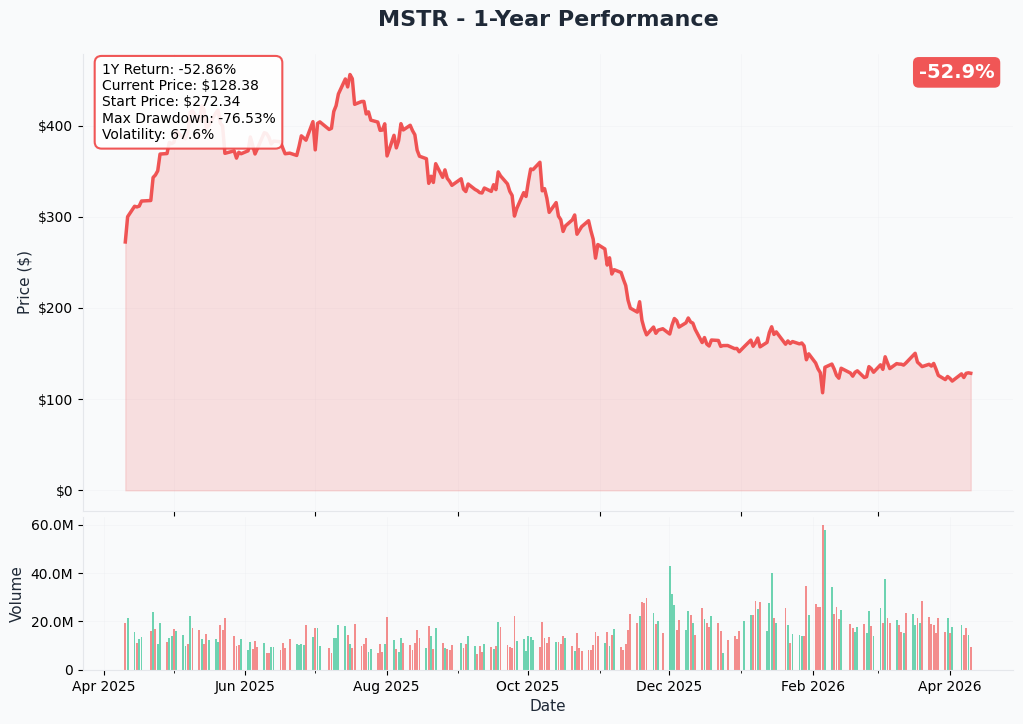
What a year it's been for MSTR. The stock started 2026 near all-time highs after a historic 2024-2025 Bitcoin bull run that saw MSTR trade as high as $457.20. Then came the brutal selloff — MSTR crashed to a 52-week low of $104.17 as Bitcoin tumbled and macro headwinds from U.S.-China tariffs slammed risk assets.
The April 9 Trump tariff pause gave MSTR a violent 25% single-day bounce, but the 125% China tariff escalation pulled the stock right back to the $128-$134 range where we are now. MSTR is down roughly 42% from its 52-week high — a painful drawdown even for Bitcoin believers.
Key observations:
- 📉 Massive drawdown: -60% from ATH, down 42% YTD — still in deep recovery mode
- 🎢 Extreme volatility: Wild swings tied entirely to Bitcoin price action and macro headlines
- 📊 Consolidation zone: $128-$135 is the current battleground, with the $130 level becoming crucial
- 🐻 Bear pressure: The highest short interest of any U.S. stock above $25B market cap at ~14% of market cap
Gamma-Based Support & Resistance Analysis
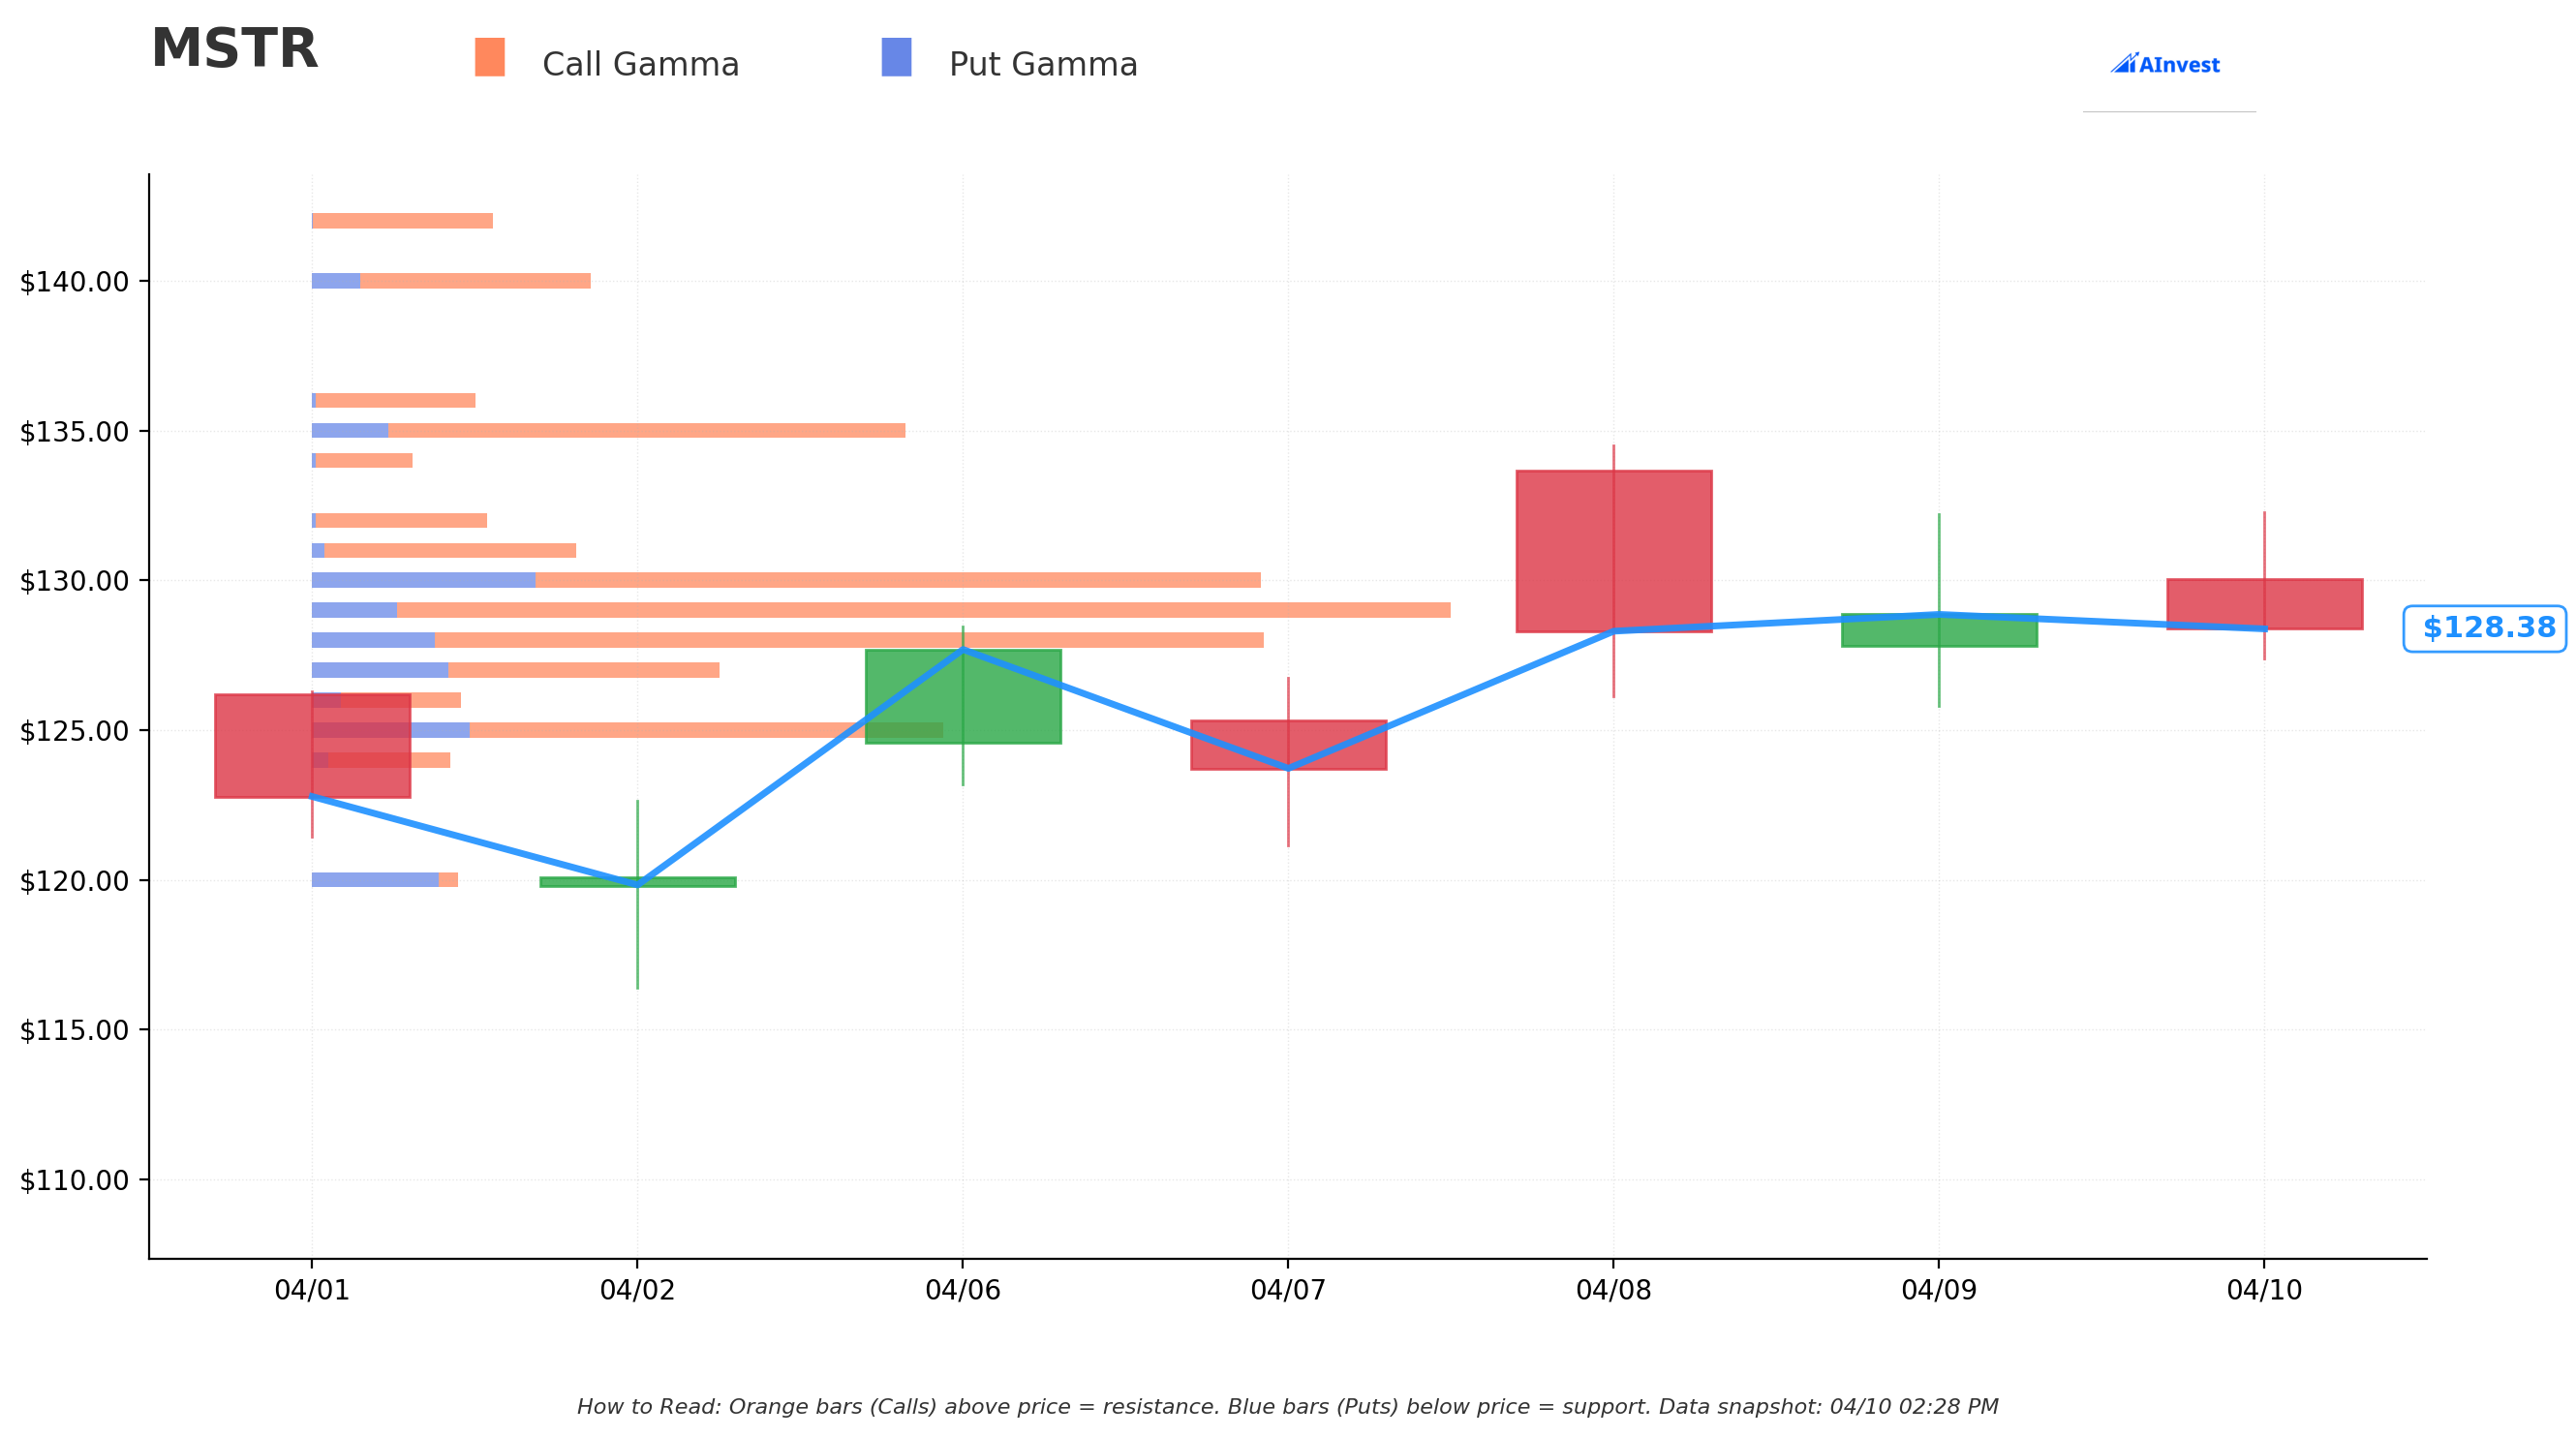
Current Price: $128.39
The gamma exposure map shows a very tight battlefield around the current price. Market makers are positioned heavily right at the $128-$130 zone, which creates natural friction for big moves in either direction.
🔵 Support Levels (Below Current Price):
- $128 — Immediate and STRONGEST support with $49.5B total gamma (only 0.3% below price — this is a sticky floor right now)
- $127 — Secondary support at $20.6B gamma (1.1% below)
- $126 — Third floor at $9.7B gamma (1.9% below)
- $125 — Structural support at $29.6B gamma (2.6% below — solid backup floor)
🟠 Resistance Levels (Above Current Price):
- $129 — Immediate and STRONGEST resistance at $59.0B total gamma (only 0.5% above — this is a wall!)
- $130 — Major ceiling at $50.6B gamma (1.3% above — exactly where our trader sold their calls!)
- $131 — Additional resistance at $14.4B gamma (2.0% above)
- $135 — Extended resistance at $30.8B gamma (5.1% above — the strike from the closing leg)
- $140 — Far resistance at $14.5B gamma (9.0% above)
What this means for traders: MSTR is pinned in a vise. The $129 resistance with $59B in gamma is the single strongest level in the entire gamma map — dealers will hammer any rally into that level. Meanwhile, the $128 support provides a cushion just below. This is classic options pinning — MSTR could very well oscillate between $127 and $131 in the short term.
The institutional trader who sold those $130 calls knew exactly what they were doing — they sold the strike right at the heaviest gamma resistance in the options market. That $130 level has gravity pulling MSTR toward it AND away from it simultaneously. Net GEX Bias: Bullish overall (total call GEX of $314.2B vs put GEX of $92.0B), but that bullish bias evaporates quickly above $130.
Implied Move Analysis
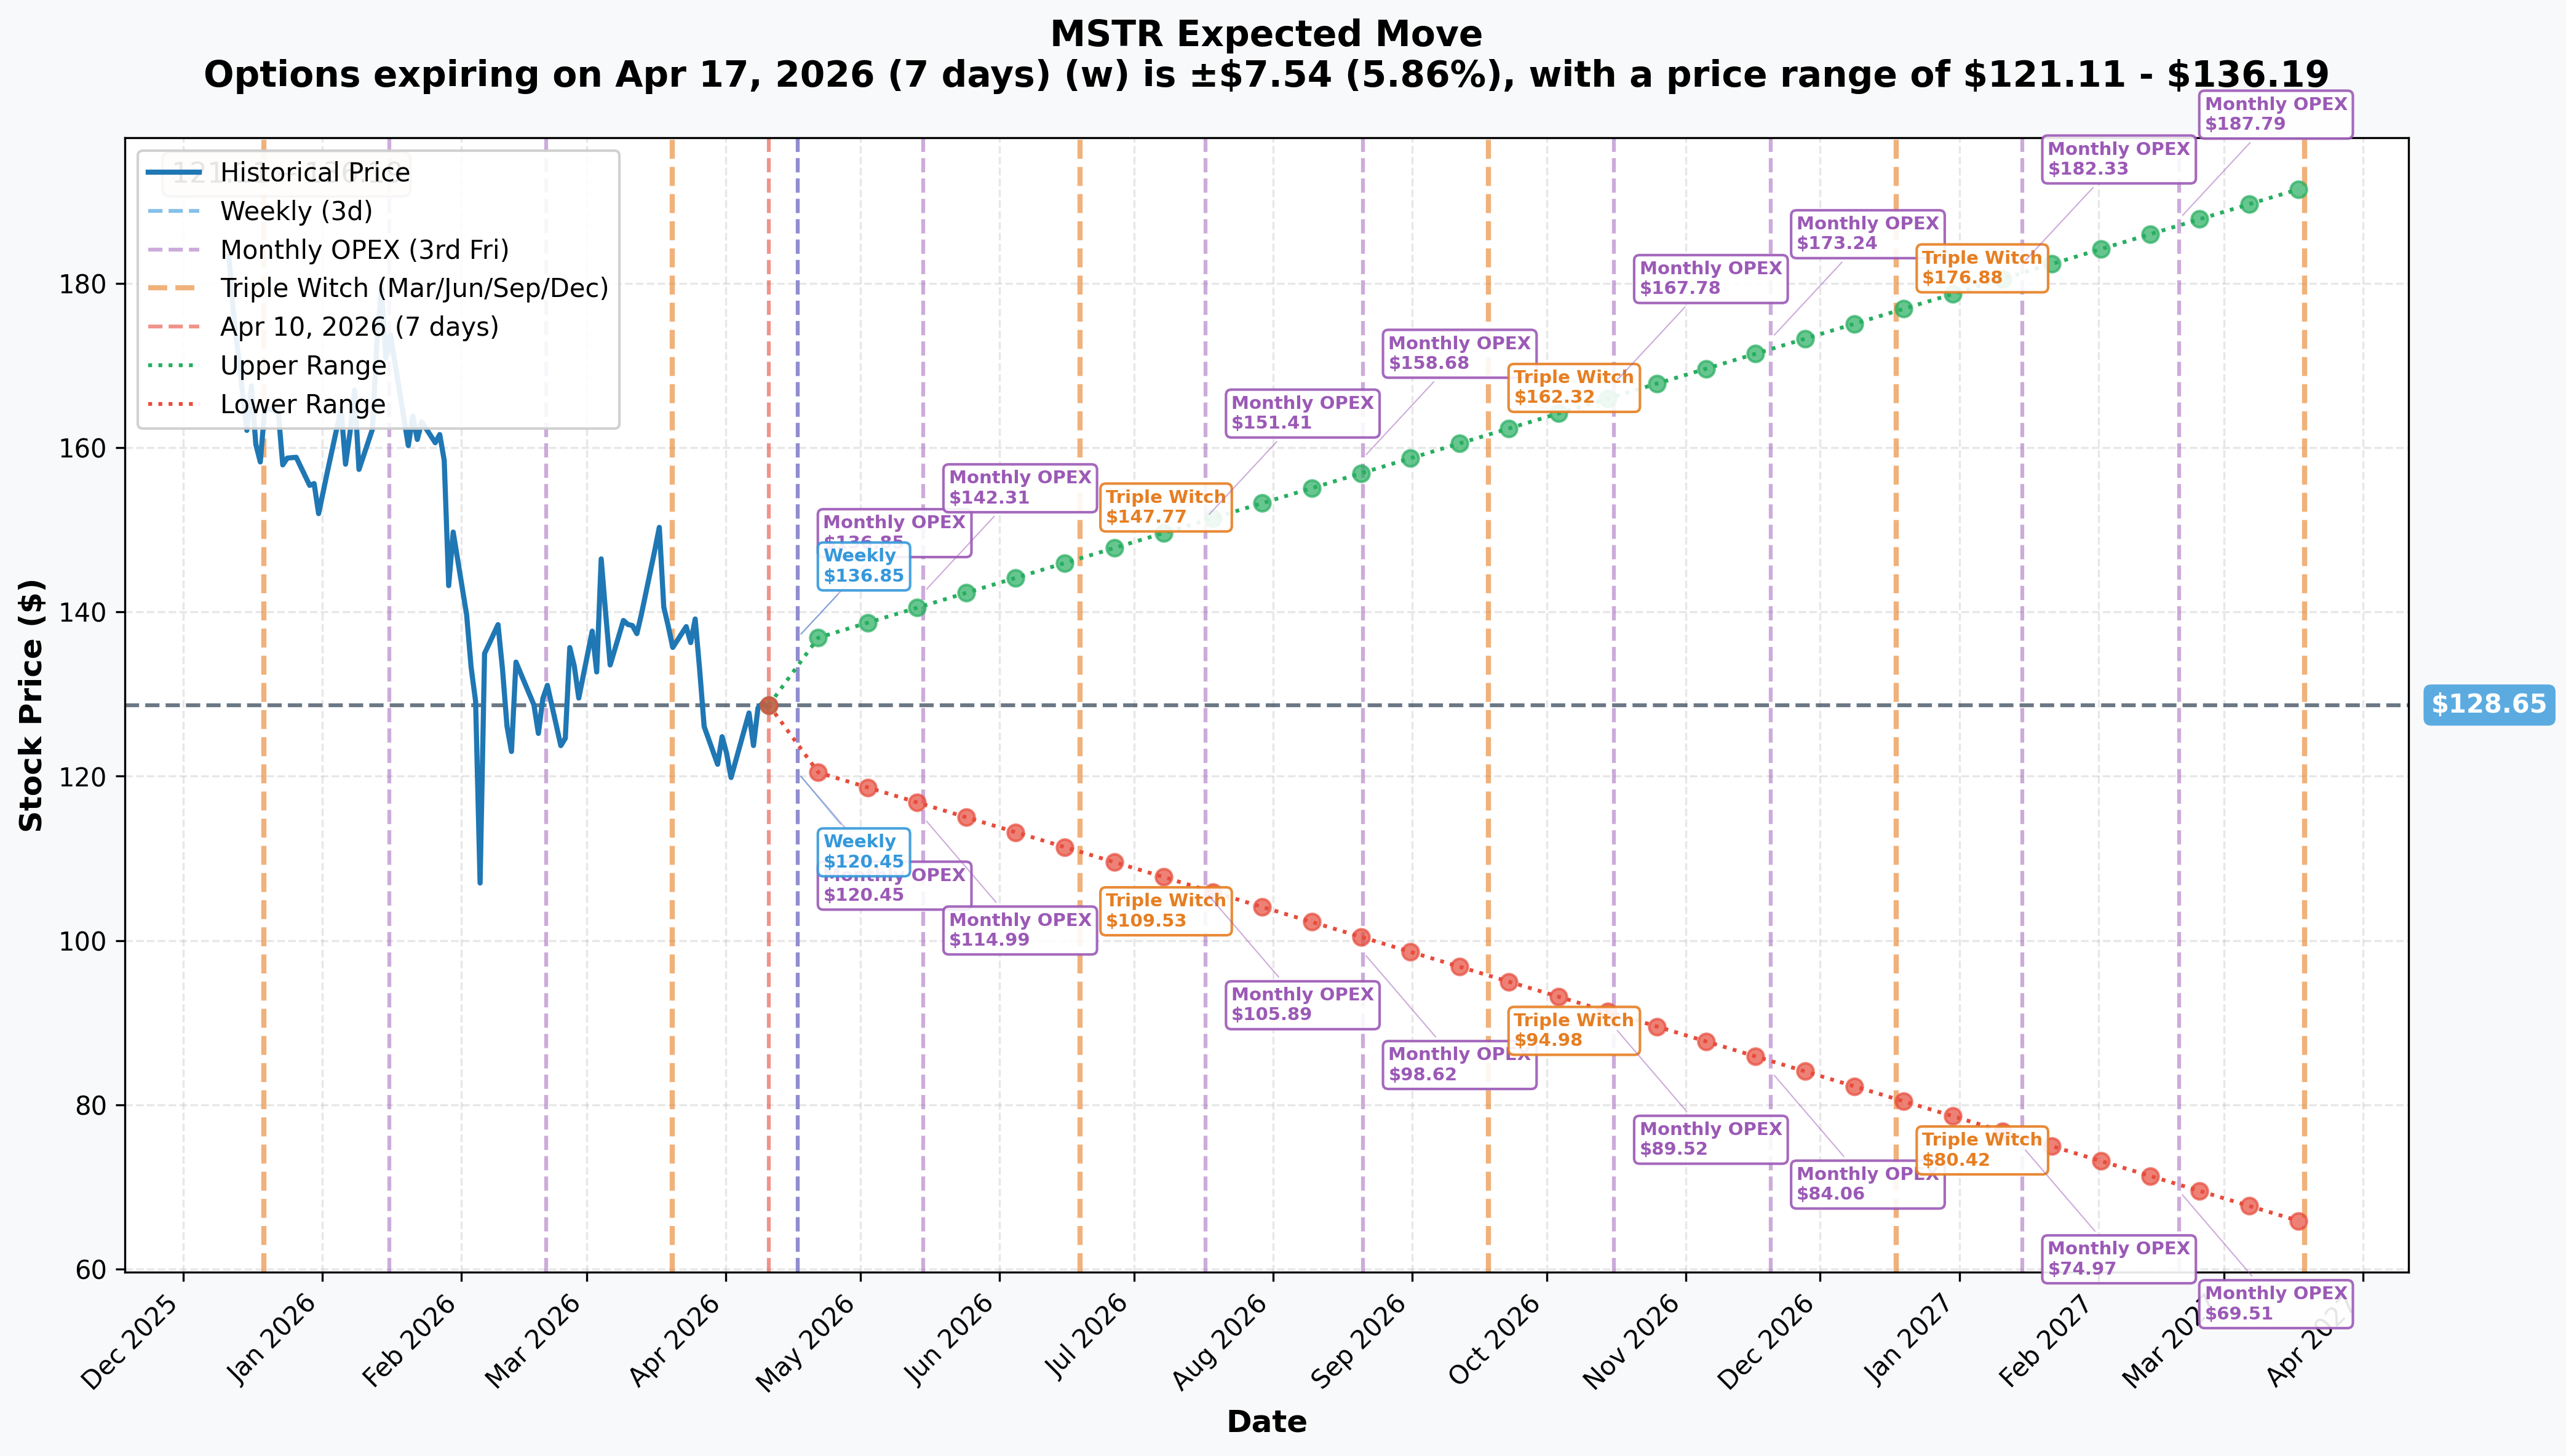
Options market pricing what MSTR could do:
- 📅 Weekly OPEX (April 17 — 7 days): ±$7.54 (±5.86%) → Range: $121.11 - $136.19
- 📅 May OPEX (May 15): Upper $142.31 / Lower $114.99
- 📅 June Triple Witch (June 19 — our trade expires June 18!): Upper $147.77 / Lower $109.53
- 📅 July OPEX (July 17): Upper $151.41 / Lower $105.89
- 📅 1-Year LEAP (March 2027): ±$63.11 (±49.1%) → Range: $65.54 - $191.76
Translation for regular folks: The options market is pricing in a nearly 6% move in either direction just this week — that's $7.54 on a $128 stock in 7 days. That's how volatile MSTR is.
More importantly for our June 18 trade: the implied move suggests MSTR could trade as high as $147.77 by June expiration. The trader who sold the $130 calls for $48M is taking on real risk — if MSTR rallies back toward $148 by June, they're looking at potentially catastrophic losses on that short call position.
The $130 strike sits right at spot, meaning the trader's breakeven is essentially $130 + $15.60 (premium collected) = $145.60 before this trade starts hurting. The implied upper range of $147.77 sits just $2.23 above that breakeven — this is a close race.
🎪 Catalysts
🔥 Already Happened (Recent Developments)
Bitcoin Tariff Shock and Recovery (April 7-10, 2026) 📉📈
This week has been a rollercoaster of historic proportions. MSTR fell 3.11% on April 7 to $123.72, testing its 52-week low as tariff fears hammered Bitcoin and risk assets. Then on April 9, Trump's 90-day tariff pause announcement triggered a 25% single-day surge in MSTR. Then on April 10 (today), the 125% China tariff escalation pulled the stock right back down to the $128-$134 zone. Three days. Three completely different emotional states. Welcome to MSTR.
Aggressive BTC Accumulation in Q1 2026 🏦
Strategy has been buying Bitcoin on practically every pullback this year. The company acquired 4,871 BTC for $329.9M in early April, 22,337 BTC for a record $1.57B in mid-March, and a total of ~65,000 BTC in Q1 2026 alone. The company now holds 766,970 BTC worth approximately $55.2B at current Bitcoin prices around $72,000 — but the stock trades at only $44B market cap, a 0.7x discount to Bitcoin NAV.
Q4 2025 Earnings Beat (February 5, 2026) 📊
Strategy reported a significant EPS beat of $16.37 vs. consensus of -$18.64, a 187% positive surprise driven by mark-to-market gains on Bitcoin holdings under new FASB fair value accounting rules. Despite the monster beat, the stock has declined significantly since due to broader macro headwinds.
Short Interest Surge 🐻
Strategy became the most heavily shorted U.S. stock among companies above $25B market cap, with ~14% of market cap ($5.8B notional) short. Much of this is attributed to the "basis trade" — going long Bitcoin ETFs (like IBIT) and shorting MSTR to arbitrage the NAV premium/discount.
NAV Discount Shock 🚨
For the first time since January 2024, MSTR broke its premium streak and now trades below its Bitcoin NAV at ~0.7x — a dramatic reversal from the 2-3x NAV premiums seen throughout 2024-2025. This structural shift has broken the reflexive flywheel that powered MSTR's epic run.
🚀 Upcoming Catalysts (Next 6 Months)
🔴 Q1 2026 Earnings — April 30, 2026 (20 Days Away!)
This is THE near-term binary event. Key expectations:
- Consensus Revenue: $123.56M
- Consensus EPS: -$10.76 (driven by $14.46B unrealized Bitcoin losses under FASB fair value accounting — yes, that's billion with a B)
- BTC Yield: 1.2% YTD (7,826 BTC accretive gain worth $551M)
- Watch for: forward guidance on the 42/42 capital raise plan, ATM program utilization, and STRC preferred dividend escalation
The market will be laser-focused on whether Bitcoin's Q2 recovery changes the unrealized loss narrative and whether the company's capital model remains viable at sub-NAV trading levels.
⚡ CPI Report (April 10-11, 2026 — Today/Tomorrow)
Markets are pricing in rate implications from the latest CPI data. A hot number could spike rates expectations and hammer Bitcoin; a cool reading could fuel the risk-on trade and lift MSTR.
🌐 Bitcoin Macro Recovery Potential
Bitcoin trading at ~$72,000 with analyst forecasts ranging from $40K to $200K for 2026. Any sustained BTC rally back toward $85K-$100K would dramatically re-rate MSTR given its 766,970 BTC treasury. The spot Bitcoin ETF inflows via IBIT, FBTC, and others remain a key demand driver.
📊 S&P 500 Inclusion Wildcard
Strategy has been repeatedly passed over for S&P 500 inclusion despite meeting all technical criteria. The June and September 2026 quarterly rebalance decisions remain potential catalysts, but the Index Committee's repeated exclusions suggest this isn't imminent. If it ever happens though — buckle up for a massive squeeze.
💼 Continued ATM and Preferred Issuance
Strategy still has $27.1B remaining in MSTR common stock ATM capacity and ~$35.8B across all securities (MSTR, STRK, STRF, STRD, STRC). Between March 30 and April 5 alone, the company sold 1.18M shares for $144M in proceeds. The dilution machine keeps running.
Path to 1 Million BTC — At the Q1 2026 pace of ~65,000 BTC/quarter, Strategy could hit 1 million BTC by late 2026 or early 2027. Michael Saylor's grand vision remains intact even as the stock trades at a fraction of its peak.
🎲 Price Targets & Probabilities
Using Gamma Levels + Implied Move Ranges for June 18 Expiration:
Based on the gamma analysis and implied move data above, here's how the three scenarios look for MSTR through June 18, 2026:
🐻 Bear Case — MSTR Below $115 (25% probability)
- Gamma support floor: $125 is the deepest structural gamma support; a break below opens a path to the 52-week low of $104.17
- Driver: Bitcoin continues falling below $65K, China tariff escalation accelerates, MSTR's Q1 loss of $14.46B triggers forced selling or margin calls on leveraged positions
- Impact on the trade: The short $130 call expires worthless — the trader pockets the full $48M in June premium. Maximum win scenario.
📊 Base Case — MSTR Range-Bound $125-$135 (50% probability)
- Gamma magnet: The $128-$130 zone has the heaviest gamma concentration in the entire options surface — dealers will keep MSTR pinned near $130 through June OPEX if nothing dramatic changes
- Driver: Bitcoin consolidates around $70K-$80K, tariff uncertainty persists, MSTR's earnings produce no major upside surprise, and continued ATM dilution caps upside
- Impact on the trade: The short $130 call expires near-the-money or slightly ITM — the trader still profits from theta decay, but may need to buy back some exposure. The $15.60 premium provides a $145.60 breakeven.
🚀 Bull Case — MSTR Above $145 (25% probability)
- Implied move ceiling: The June implied move projects an upper range of $147.77 — above the trade's $145.60 breakeven
- Driver: Bitcoin reclaims $85K-$100K on ETF inflows, tariff situation de-escalates, S&P 500 inclusion surprise, or massive short squeeze triggered by 14% short interest
- Impact on the trade: This is where the trader gets hurt — every dollar above $145.60 is a net loss on the $48M premium collected. A MSTR rally to $160+ (not crazy given its beta) could generate enormous mark-to-market losses on this short call position.
Analyst consensus: 14 Buy / 1 Hold, average target $329.82 — 156% upside from current levels per the Street. TD Cowen has a $350 target (down from $440), Citigroup $260, Mizuho $320.
💡 Trading Ideas
🛡️ Conservative — "The Wait and Watch" Strategy
What: Don't try to replicate the $48M short call. Instead, if you're bullish MSTR, wait for a confirmed close above $131 (through the gamma resistance wall at $129-$130) before adding any position. Use the $125 gamma support as your stop reference.
Why this works: The gamma data tells you exactly where the market makers are positioned. A clean breakout above $131 with volume signals that buyers have absorbed the gamma resistance. Until that happens, MSTR could just chop around $128-$131 for weeks.
Risk: Earnings on April 30 could gap the stock in either direction before your setup triggers. Plan for binary risk around that date.
Best for: Traders with $5,000-$25,000 who don't want to bet before a major binary event.
⚖️ Balanced — "The Earnings Strangle"
What: With the weekly implied move at 5.86% (±$7.54), options are pricing in significant volatility around Q1 earnings on April 30. Consider a defined-risk strategy: buy an out-of-the-money call spread ($135/$145) AND a put spread ($120/$110) for May expiration. You profit from a big directional move either way.
Approximate cost: Depending on exact pricing, a balanced strangle structure might run $3-$6 per share on each side — roughly $600-$1,200 per spread pair.
Why this works: MSTR's 52-week daily vol is extreme. The $14.46B unrealized Bitcoin loss pre-announcement for Q1 means earnings could be volatile. You're not predicting direction — you're betting on a big move.
Risk: If MSTR stays glued to the $128-$132 range through May, both legs decay and you lose the premium paid. Theta is your enemy with this structure.
Best for: Traders with $2,000-$10,000 who want defined risk around earnings without picking a direction.
🚀 Aggressive — "The Short Squeeze Lottery Ticket"
What: If you believe Bitcoin is bottoming here and the 14% short interest creates kindling for a squeeze, consider buying the June 18 $140 calls outright (or a $135/$145 call spread). This plays the inverse of what the big trader just sold.
Logic: The trader sold 30,540 of the $130 calls for $15.60 each. If MSTR rips toward $150+ on a Bitcoin recovery, those short calls start bleeding. The counterparty to that trade (the buyers) stand to profit enormously.
Risk: This is a high-risk bet against an institutional player who just collected $48M in premium. They clearly believe MSTR won't close above $130 by June 18. Options are expensive on MSTR — you're paying elevated implied vol for a leveraged Bitcoin bet. The June LEAP implied move suggests a 40%+ swing is possible, but direction is genuinely uncertain.
Best for: Traders with $1,000-$5,000 in risk capital they can afford to lose completely, who have a strong conviction on Bitcoin recovery.
⚠️ Risk Factors
Real talk — here's what can go wrong in any direction:
-
😰 Bitcoin price sensitivity: Every $1,000 move in BTC price impacts Strategy's portfolio by ~$767M. BTC at $55K wipes out the entire cost basis and puts 766,970 BTC underwater. That's existential risk territory.
-
💸 Structural dilution: With authorized shares expanded from 330M to 10.33B and $27B in remaining ATM capacity, any stock rally gets capped by fresh share issuance. At sub-NAV prices, every share sold is literally destroying value for existing shareholders.
-
🏦 Preferred dividend burden: Annual obligations of ~$689M in preferred dividends and interest rank senior to common equity. The STRC variable rate has escalated from 9% to 11.5% already. The 2027 debt maturity of ~$1B is the first hard deadline.
-
🐻 Short squeeze risk (for short sellers): The 14% short interest is a double-edged sword. If Bitcoin rips and MSTR rallies 30%+ in a week (it's done this before), the short squeeze could be violent. Whoever sold those $130 June calls is exposed to that scenario.
-
🌐 Macro headwinds: The 125% China tariff escalation creates a genuine risk-off backdrop. Trade wars historically correlate with Bitcoin drawdowns as institutional players reduce risk.
-
📊 Q1 earnings binary event: The pre-announced $14.46B unrealized Bitcoin loss for Q1 is already known — the question is what the market does with it and whether guidance changes anything.
-
📉 Software business erosion: Product support revenue declined 16.9% YoY in Q4 2025. The underlying software business provides zero operational cushion.
🎯 The Bottom Line
Here's the deal:
A sophisticated institutional player just told us, with $55.2M on the table, that they expect MSTR to stay below $130 through June 18, 2026. They rolled their short call position down in strike (from $135 to $130) and out in time (from April 17 to June 18), collecting a massive $48M in fresh premium to make that bet.
The gamma data backs up their thesis — $129-$130 has the heaviest call gamma resistance in the entire options surface, and the stock is trading right at that boundary. Dealers will naturally suppress rallies into that zone.
If you're already long MSTR: The $130 resistance is real and data-confirmed. Use strength into $129-$131 as an opportunity to trim positions or buy downside protection ahead of April 30 earnings. The $125 gamma support is your first meaningful floor.
If you're watching from the sidelines: April 30 earnings is the next major binary event. With Bitcoin at $72K and 766,970 BTC on the books, the Q1 loss narrative is already priced in — the market wants to know whether Q2 is the start of a recovery or continued deterioration. Mark April 30 on your calendar.
If you're bearish or short: The 14% short interest and 0.7x NAV discount tells you a lot of smart money is already positioned for downside. But with 14 of 15 analysts rating MSTR a Buy with an average $330 target, any Bitcoin recovery toward $85K could trigger a violent short squeeze. Manage your position size accordingly.
The lesson from today's $55.2M trade: This isn't panic or random noise. Someone is systematically rolling a large short call program, collecting premium month after month while MSTR stays capped. It's disciplined. It's calculated. And it's telling you something about where smart money thinks the ceiling is right now.
⚠️ Disclaimer: This analysis is for informational and educational purposes only and does not constitute investment advice or a solicitation to buy or sell any security. Options trading involves substantial risk and may not be suitable for all investors. You could lose the entire amount invested. Past performance is not indicative of future results. Always consult a qualified financial advisor before making investment decisions. The unusual options activity described may reflect hedging, institutional portfolio management, or other strategies that may not be appropriate for individual retail investors.