🐻 MTUM $1.2M Put Buy -- Institutional Bet Against the Momentum Factor!
📅 March 2, 2026 | 🔥 Unusual Activity Detected
🎯 The Quick Take
Someone just dropped $1.2 MILLION on MTUM puts -- betting the momentum factor ETF falls below $245 within 18 days! With a Vol/OI ratio of 4.5x and a z-score of 13.26 (EXTREMELY UNUSUAL), this is not normal activity for a factor ETF that typically sees quiet options flow. Coming right as momentum stocks face a brutal regime shift, rising VIX, and a wall of catalysts (CPI March 11, FOMC March 17-18), this trade is either a well-timed directional bet or a hedge against a portfolio full of momentum names.
📊 ETF Overview
iShares MSCI USA Momentum Factor ETF (MTUM) tracks the MSCI USA Momentum SR Variant Index, which selects and weights U.S. large- and mid-cap stocks exhibiting strong recent price momentum:
- 💰 AUM: ~$21B
- 📊 Expense Ratio: 0.15%
- 🏢 Holdings: 129 stocks
- 📈 Current Price: $251.70
- 🏷️ P/E Ratio: 25.23-33.40x
- ⭐ Morningstar Rating: Silver medal, 3 stars
- 🔝 Top Holdings: META (5.09%), JPM (4.69%), NVDA (4.64%), AVGO (4.58%), MU (4.18%)
- 🖥️ Sector Tilt: 40.88% Technology, 15.33% Financials, 14.72% Communication Services
- 📉 YTD 2026: Essentially flat (+1.1% to +1.9%) after crushing it in 2024 (+32.89%) and 2025 (+22.15%)
Why this matters: MTUM is heavily tilted toward tech and AI names that have been getting hammered in 2026. Energy (+21% YTD), Materials (+17%), and Staples (+15%) are leading -- all sectors where MTUM has near-zero exposure. The fund cannot fully rebalance until the end-of-May semi-annual reconstitution, creating a structural vulnerability.
💰 The Option Flow Breakdown
📊 The Tape (March 2, 2026 @ 10:41:47)
| Time | Symbol | Side | Buy/Sell | Type | Expiration | Premium | Strike | Volume | OI | Size | Spot | Option Price |
|---|---|---|---|---|---|---|---|---|---|---|---|---|
| 10:41:47 | MTUM | MID | BUY | PUT | 2026-03-20 | $1.2M | $245 | 5K | 1.1K | 3,250 | $251.70 | $3.76 |
Option Symbol: MTUM20260320P245
🤓 What This Actually Means
This is a Buy-to-Open (BTO) Long Put -- a straightforward bearish directional bet. Here's the breakdown:
- 🐻 Bearish conviction: Buying $245 puts with the stock at $251.70, meaning this trader needs a 2.7% drop just to reach the strike
- 💸 Serious capital at risk: $1.2M in premium ($3.76 per contract x 3,250 contracts)
- ⏰ Short fuse: Only 18 days to expiration (March 20, Triple Witch) -- this trader needs a move fast
- 🔥 Vol/OI of 4.5x: Volume is 4.5 times the existing open interest, signaling fresh, aggressive positioning
- 📊 Z-Score: 13.26 (EXTREMELY UNUSUAL): This size of options activity on MTUM is exceptionally rare -- the kind of trade you see maybe a handful of times per year on a factor ETF
- 📏 Executed at MID: Filling at the midpoint suggests a patient, knowledgeable trader -- not someone panic-buying at the ask
What's really happening here:
This trader is either (a) making a directional bet that the momentum factor breaks down further into March Triple Witch, or (b) hedging a large portfolio of momentum-style stocks against a continued rotation into value/cyclicals. Given the timing -- right before CPI on March 11 and FOMC on March 17-18 -- and the current regime shift away from momentum, this is a well-reasoned position regardless of motive.
Breakeven at expiration: $241.24 ($245 strike - $3.76 premium) = a 4.2% decline from current price. If MTUM drops to $240, each contract would be worth $5.00 -- returning $1.6M on a $1.2M bet (+33% return).
📈 Technical Setup / Chart Check-Up
YTD Performance Chart
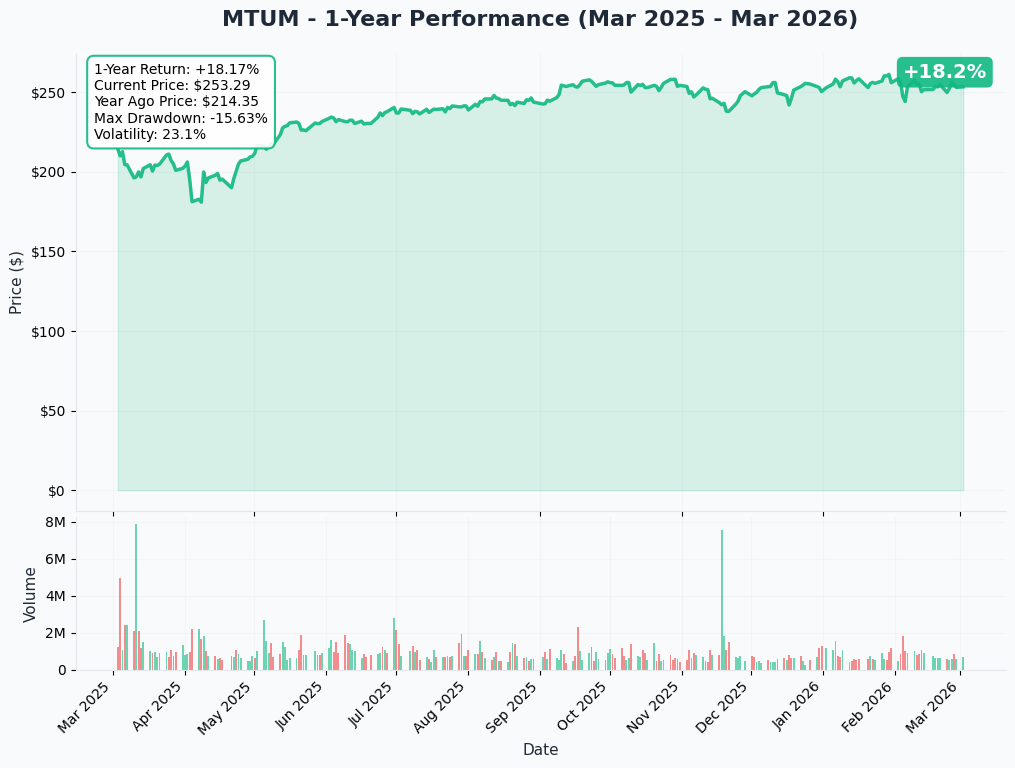
MTUM is up +18.2% over the past year with a current price of $253.29. But the recent story is one of stalling momentum:
Key observations:
- 📈 Strong run from April 2025 to December 2025: Rallied from ~$185 to the $261 high
- 📉 Topped out in late 2025: 52-week high of $261.26 has not been retested
- 🎢 Choppy in 2026: ETF has been range-bound between $240-$260, unable to establish direction
- 📊 Max drawdown: -15.63% during the April 2025 tariff selloff -- showing the fund can move sharply
- ⚡ Volatility: 23.1% annualized -- more volatile than you'd expect for a large-cap factor ETF
- 🔻 Bearish signal: The 10-day moving average crossed below the 50-day on February 12 -- a classic technical sell signal
Gamma-Based Support & Resistance Analysis
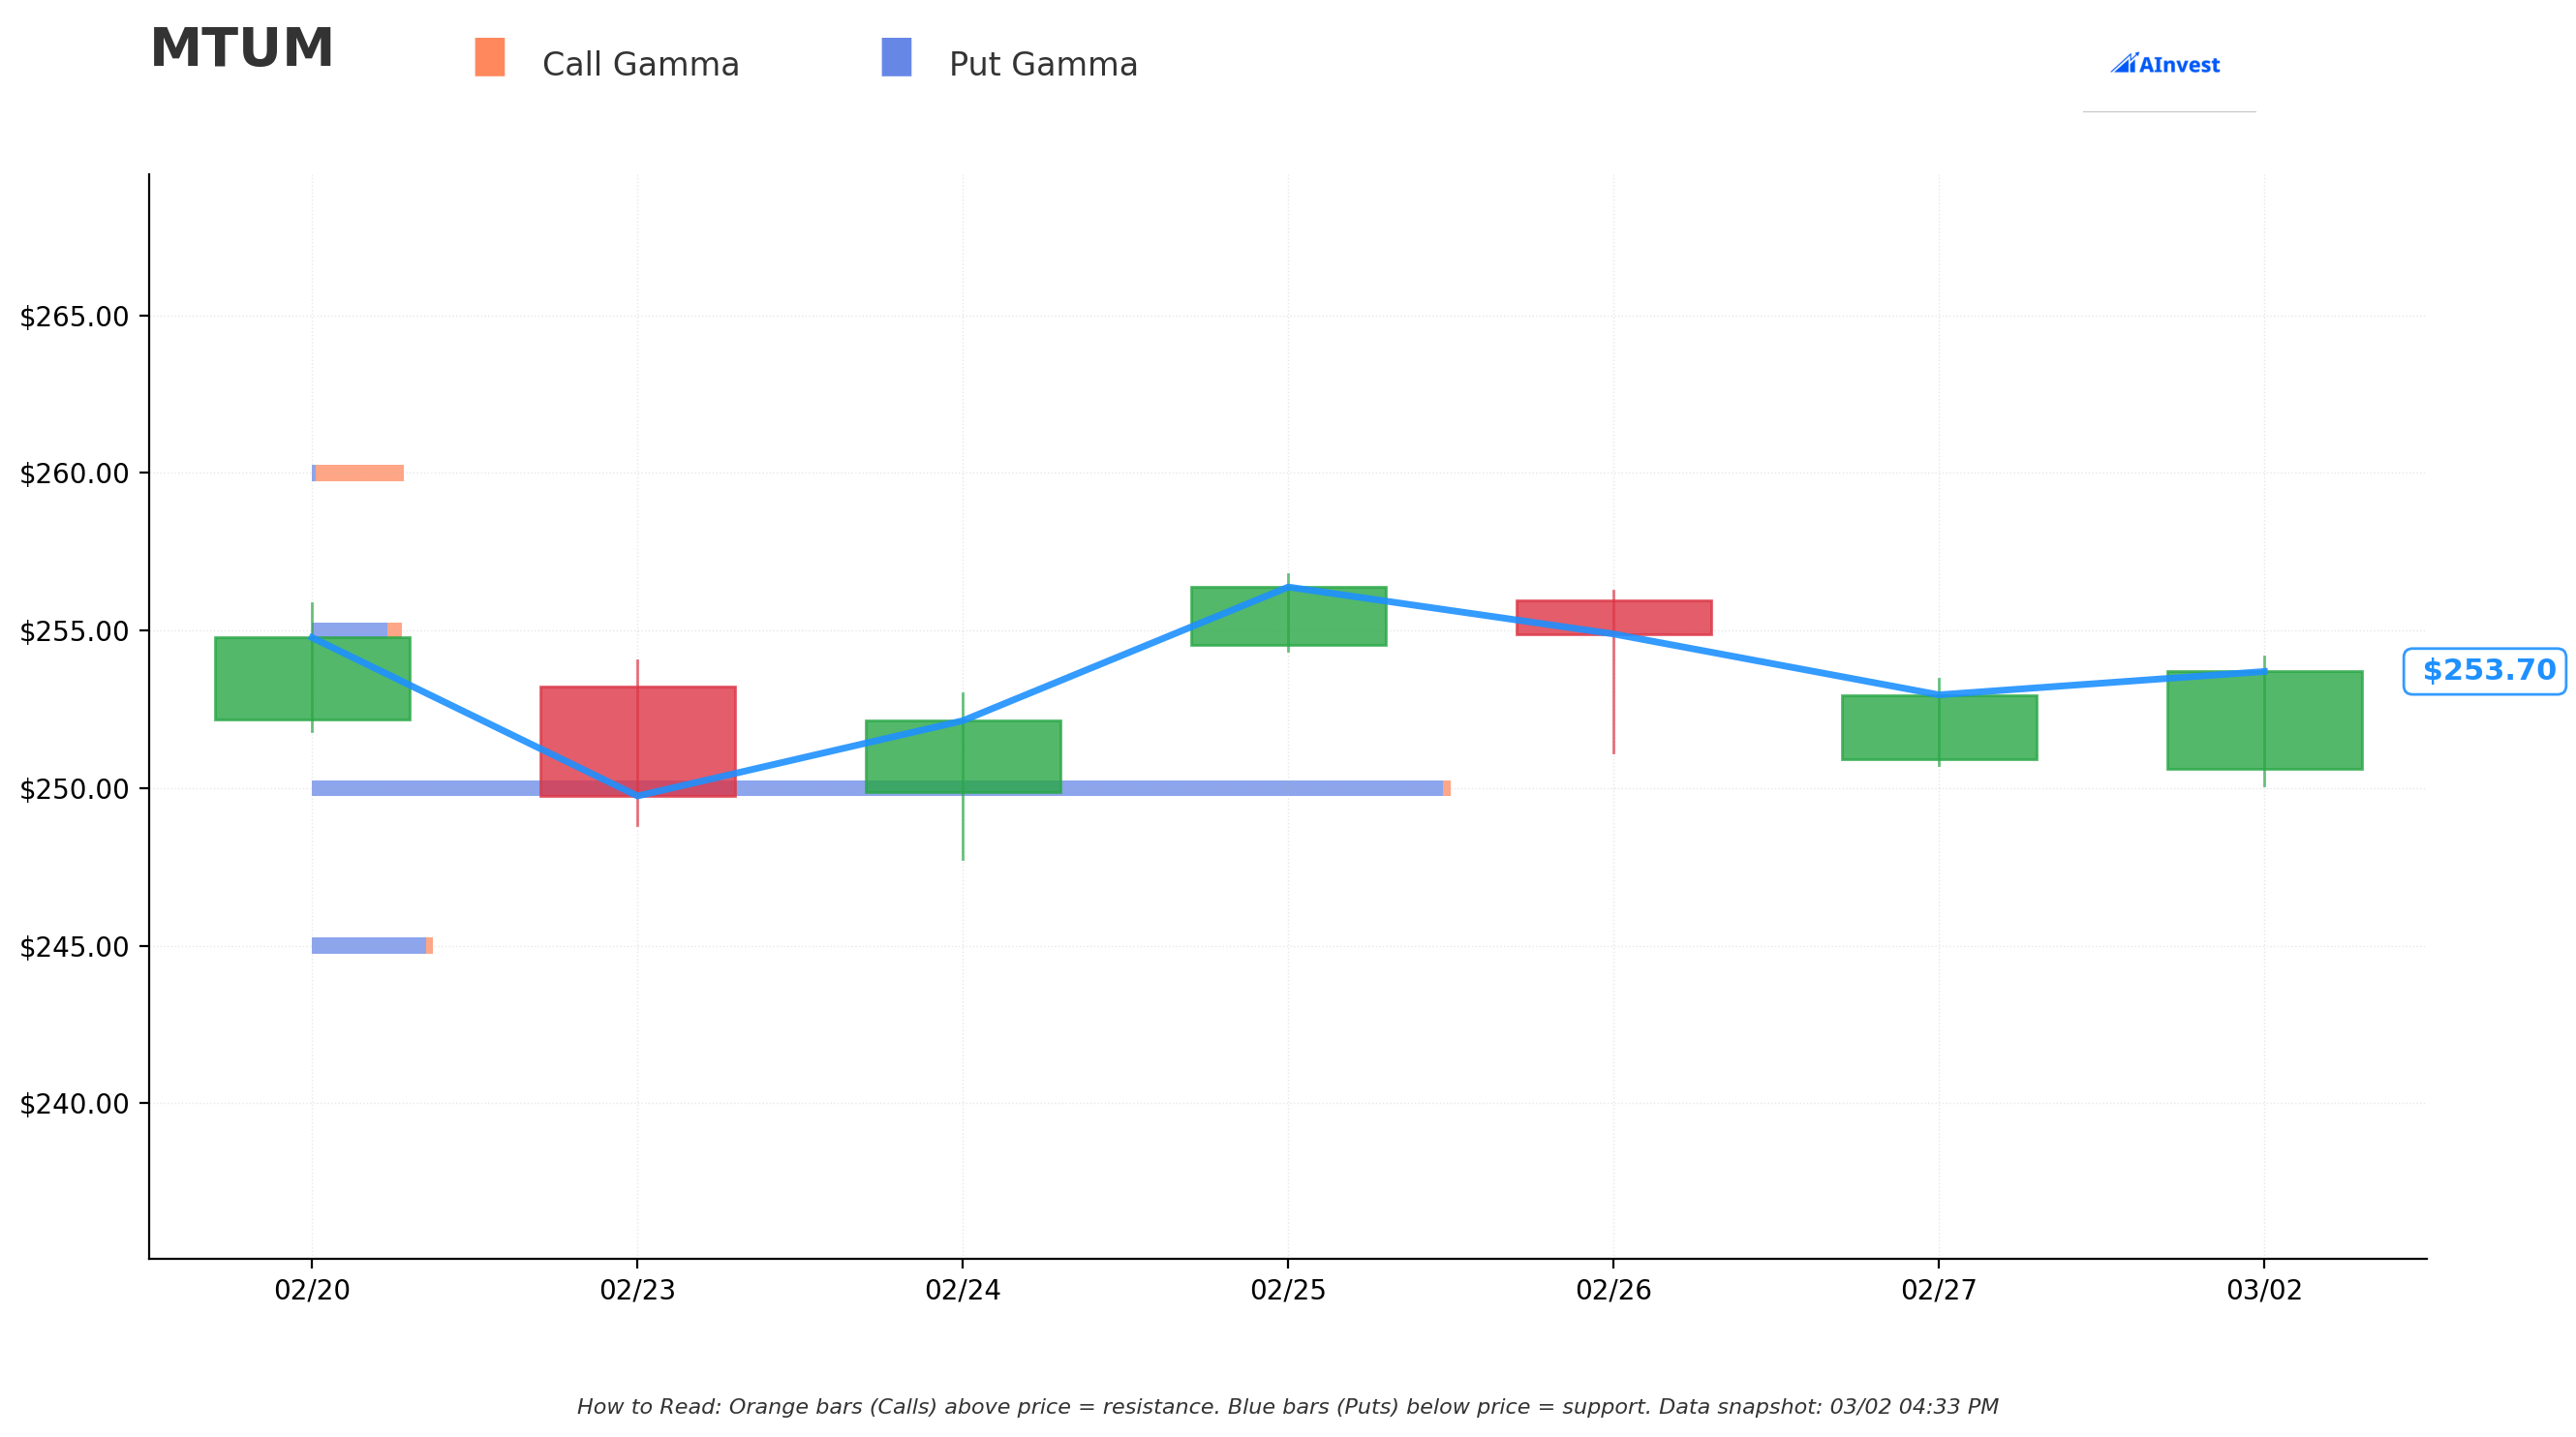
Current Price: $253.70
The gamma exposure chart shows options market maker positioning around MTUM's current price level:
🔵 Support Levels (Put Gamma Below Price):
- $250 -- The dominant put gamma level. This is where market makers have the most hedging exposure on the downside. A thick band of put open interest here should create buying pressure from dealers as price approaches. Think of it as a magnetic floor
- $245 -- Secondary support visible as a put gamma bar. This is our trader's strike -- and it lines up with the lower bound of the implied move range ($244.86)
🟠 Resistance Levels (Call Gamma Above Price):
- $255 -- Significant call gamma cluster. Market makers will hedge by selling stock as MTUM approaches this level, creating a ceiling
- $260 -- Upper call gamma level visible in earlier sessions. Breaking above here would require sustained buying pressure
What this means for traders: The gamma map suggests MTUM is caught in a $250-$255 box right now. The put buyer is betting price breaks below the $250 put gamma support level and accelerates toward $245. If $250 gives way, there's relatively thin gamma support until you hit $245, which could make the move faster than expected. On the upside, $255 is a firm lid that has rejected price multiple times in recent sessions.
Implied Move Analysis
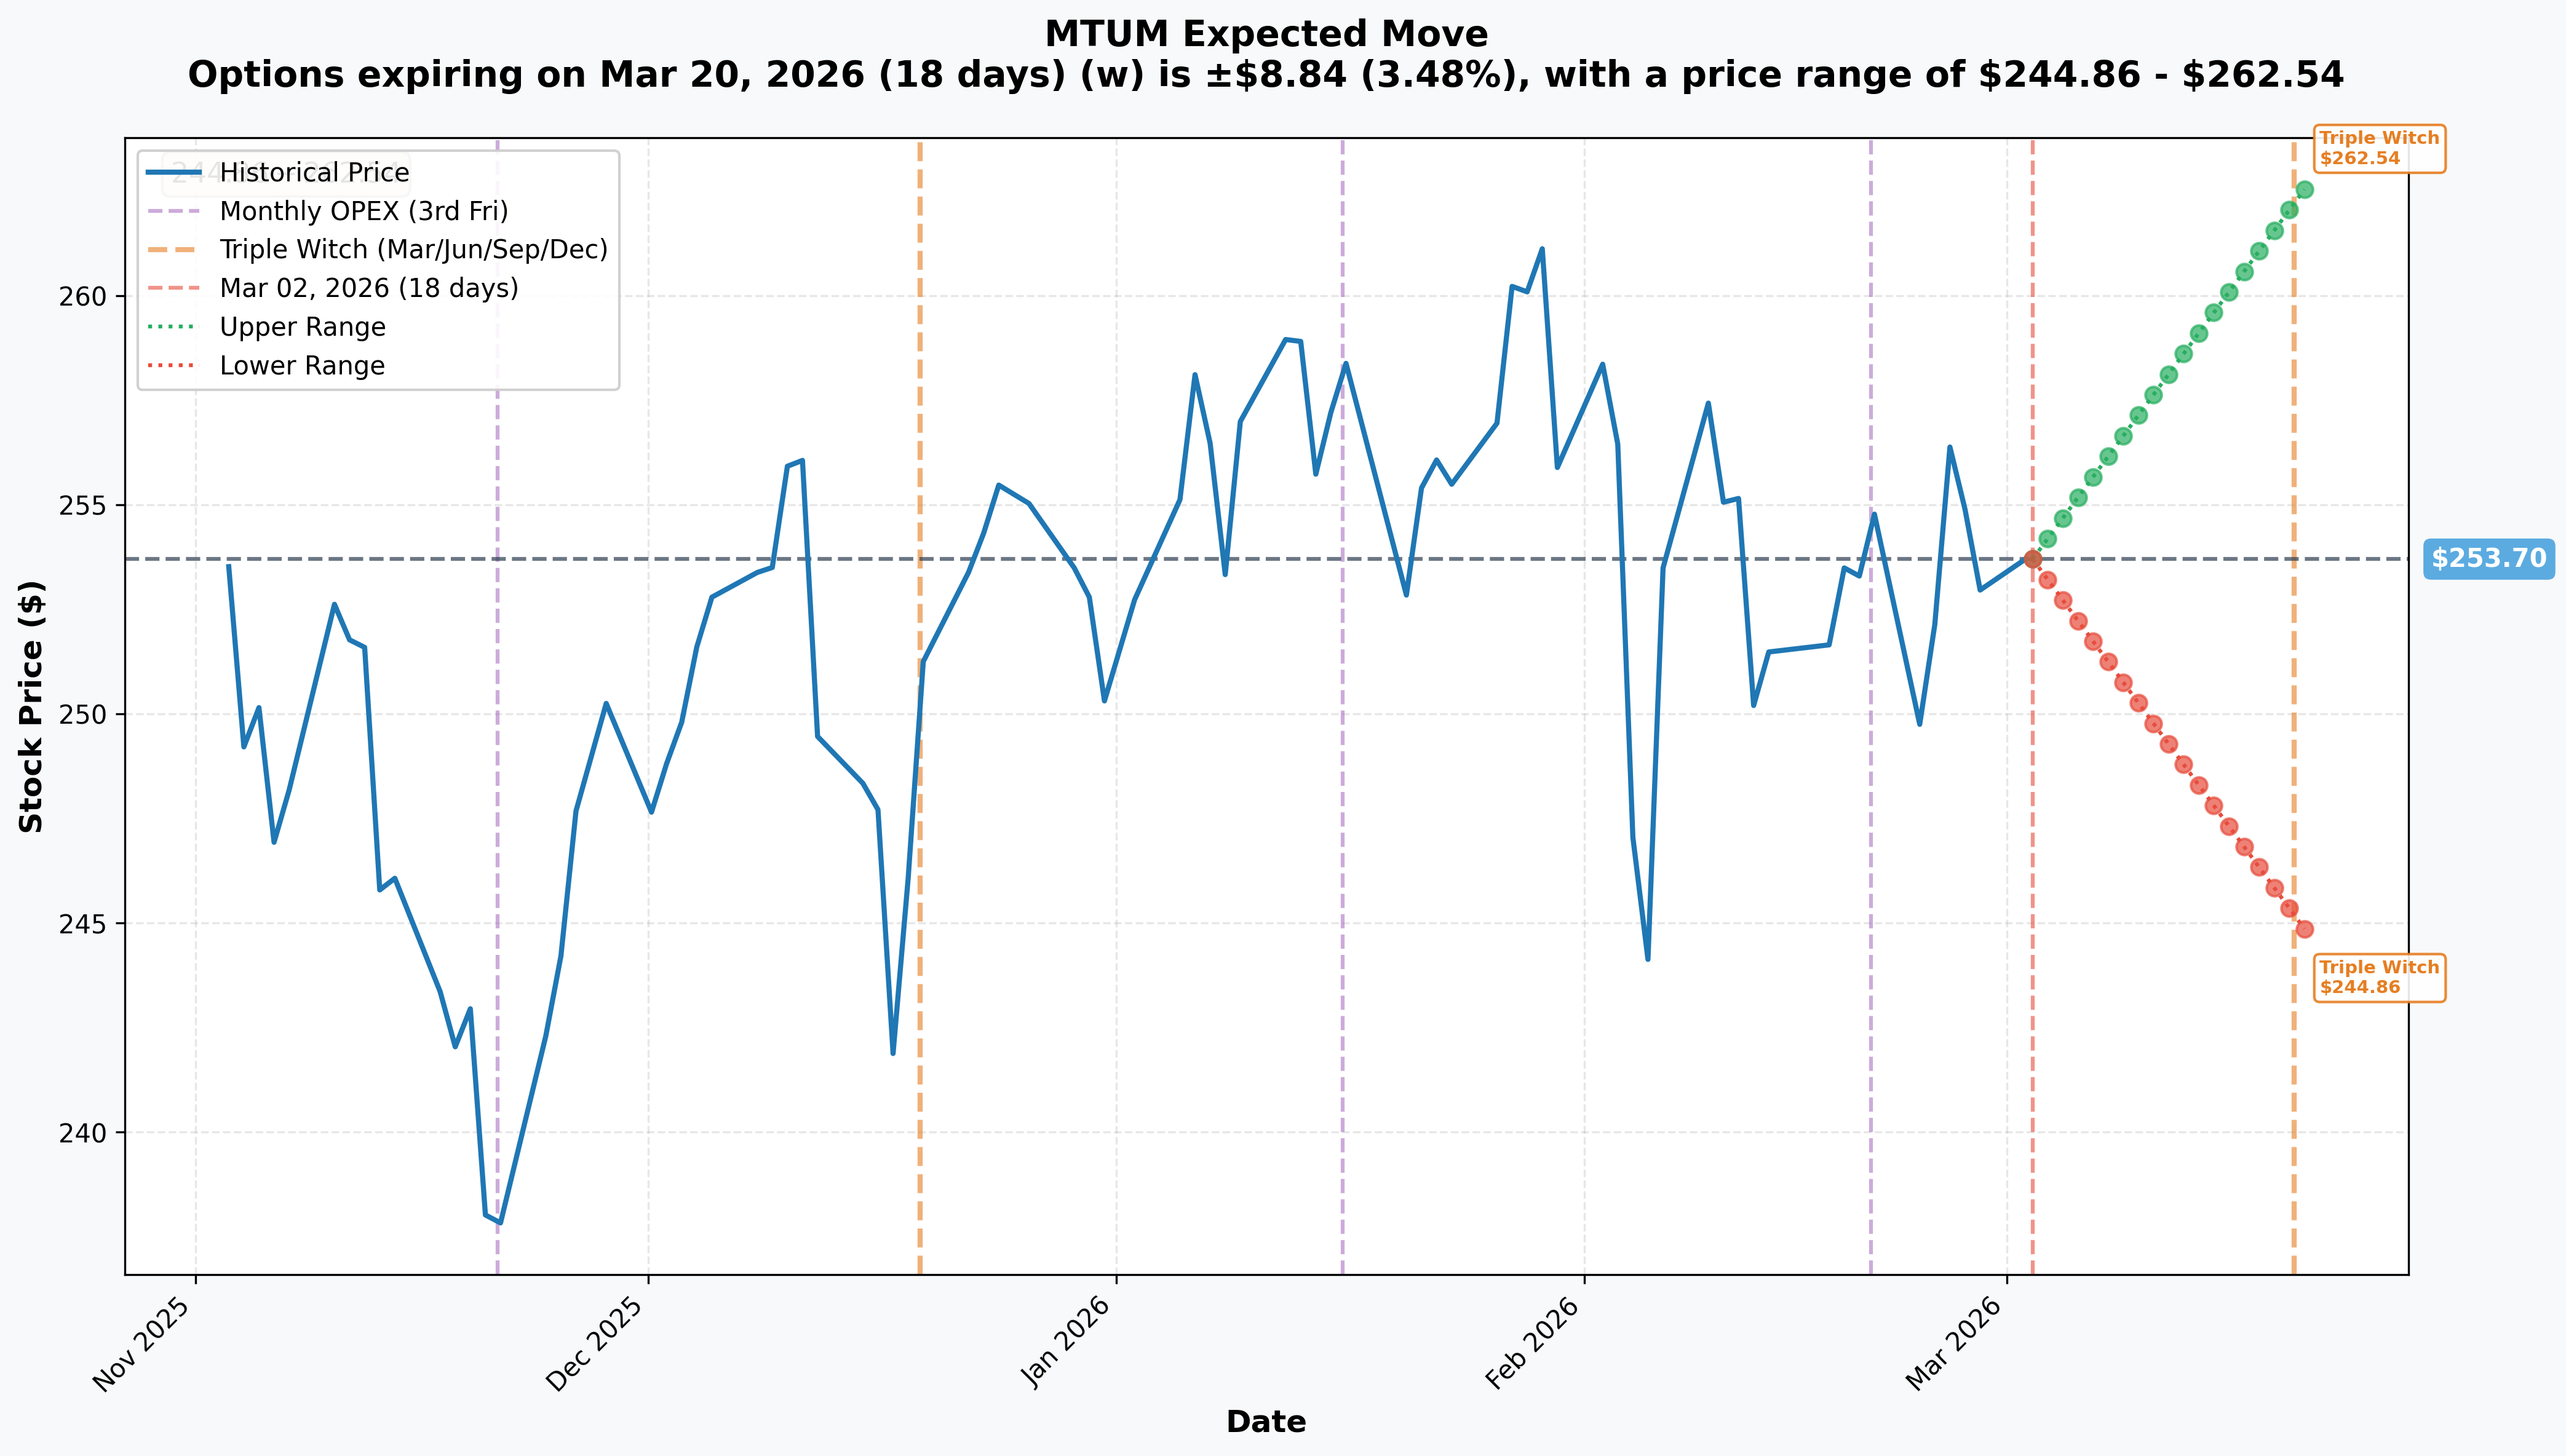
Options market pricing for the March 20 expiration (Triple Witch):
- 📅 Monthly OPEX / Triple Witch (Mar 20 -- 18 days): +/-$8.84 (±3.48%) -- Range: $244.86 to $262.54
Translation for regular folks: The options market thinks MTUM will trade somewhere between $244.86 and $262.54 by March 20 expiration. Notice something interesting -- our trader's $245 put strike sits right at the lower edge of the implied move range. That means the market gives roughly a 16% probability (one standard deviation tail) that MTUM will be at or below $245 by expiration. This trader is buying a low-probability, high-payoff bet -- or they know something the rest of the market doesn't.
The fact that March 20 is also Triple Witch (quarterly expiration for stock options, index options, and index futures simultaneously) adds extra significance. Expirations this large can create amplified moves as dealers unwind hedges and gamma exposure flips.
🎪 Catalysts
🔥 Upcoming Catalysts (Next 30 Days)
February CPI Release -- March 11, 2026 (9 days away) 📊
The Bureau of Labor Statistics will release February CPI data at 8:30 AM ET on March 11. This is the most important near-term macro catalyst:
- 🔥 A hot CPI reading = higher-for-longer rates = direct headwind for MTUM's growth-heavy tech portfolio (40.88% technology)
- 🕊️ A cool CPI reading = potential rate cut hopes = tailwind for growth names and MTUM
- 📈 January CPI came in hotter than expected, keeping the "no rate cuts in 2026" narrative alive
- ⚠️ With a growing number of options traders pricing in zero Fed cuts for 2026, another hot print could accelerate the rotation out of momentum/growth
FOMC Meeting + Dot Plot -- March 17-18, 2026 (15-16 days away) 🏦
The Federal Reserve's March meeting includes the critical Summary of Economic Projections (SEP) and updated dot plot:
- 📊 Market expects a hold at 3.50%-3.75%, but the dot plot forward guidance will move markets
- 🎯 If the median dot shifts to zero cuts in 2026, MTUM's tech-heavy holdings take another leg down
- 📉 Goldman Sachs projects just one 25bp cut in 2026, while Bankrate forecasts three cuts totaling 75bp -- the uncertainty itself creates volatility
- ⏰ The meeting concludes March 18, just 2 days before our put expires on March 20 -- perfectly timed for maximum catalyst exposure
Triple Witch Expiration -- March 20, 2026 (18 days away) 🎰
This is the quarterly "triple witch" -- simultaneous expiration of stock options, index options, and index futures:
- 💥 Historically one of the highest-volume days of the quarter
- 🔄 Dealer hedging unwinds can amplify moves in either direction
- 📊 Gamma exposure flips can create cascading effects as positions expire
- 🎯 The put buyer specifically chose this expiration, maximizing the impact of post-FOMC repositioning
📅 Already Happened (Recent Catalysts)
MSCI Quarterly Reconstitution -- February 27, 2026 ✅
The MSCI USA Momentum SR Variant Index completed its quarterly reconstitution effective at the close on February 27. One-way turnover was capped at 30%, meaning the portfolio only partially adjusted to the new market regime. The next semi-annual full rebalance is due at end of May 2026 -- until then, MTUM remains structurally overweight in fading momentum names.
SCOTUS Tariff Ruling + Section 122 -- February 20-24, 2026 ✅
The Supreme Court struck down broad IEEPA-based tariffs on February 20, but the administration immediately invoked Section 122 of the Trade Act, imposing a 15% global import surcharge effective February 24. This 150-day tariff window expires July 24, 2026 and directly impacts MTUM's semiconductor holdings (NVDA, AVGO, MU, AMD = ~16.4% of the fund).
Software "Mageddon" and Tech Selloff -- January-February 2026 ✅
Software stocks fell ~20% since January 1, with short sellers collecting $24 billion in paper gains. NVIDIA alone lost $1 trillion in market value in the final week of February. This directly impacted MTUM given its 40.88% tech weighting.
Value Rotation -- January-February 2026 ✅
The market has rotated hard into value: Russell 1000 Value +4.6% in January vs. Russell 1000 Growth -1.5%. The 2026 sector leaders -- Energy (+21%), Materials (+17%), Staples (+15%) -- are all sectors where MTUM has virtually zero exposure. JP Morgan warns the momentum factor is "aligned with expensive stocks" with "greater potential for a sharp momentum slide".
🎲 Price Targets & Probabilities
Using gamma levels, implied move data, and the catalyst calendar:
📈 Bull Case (25% probability)
Target: $258-$263
How we get there:
- 🕊️ CPI comes in soft on March 11, reigniting rate-cut hopes
- 📈 FOMC signals more dovish stance than expected on March 18
- 🔄 Tech bounces as the "sell everything" trade gets exhausted
- 💪 Strong earnings growth (15% forecast for 2026 per AInvest) reasserts momentum factor appeal
- 📊 MACD turned positive on February 25, suggesting a potential near-term bounce
What it means for the put trade: Dead on arrival. $245 puts expire worthless, $1.2M gone. This is the risk the trader accepted.
🎯 Base Case (45% probability)
Target: $248-$255 (range-bound)
Most likely scenario:
- ⚖️ CPI and FOMC data are mixed -- neither hot enough to crash tech nor cool enough to spark a rally
- 📊 MTUM continues chopping in its $250-$255 range, supported by the $250 put gamma floor and capped by the $255 call gamma ceiling
- 🔄 Value rotation continues at a slow pace, gradually eroding MTUM's holdings without a dramatic crash
- 💰 $707.6M in 3-month fund inflows provide some buying support
What it means for the put trade: Partial loss. If MTUM finishes between $241.24 (breakeven) and $245 (strike), the trader recovers some premium. If above $245, the puts expire worthless.
📉 Bear Case (30% probability)
Target: $240-$245
What could trigger this:
- 🔥 Hot CPI on March 11 + hawkish FOMC on March 18 = double whammy for growth/tech
- 📉 Momentum crash risk is elevated -- JP Morgan explicitly warns factor is aligned with expensive stocks
- 💥 Tariff escalation or geopolitical shock triggers safe-haven flight (10-year Treasury already at 3.95%)
- 📊 $250 put gamma support breaks, triggering dealer hedging flows that accelerate the move to $245
- 🎰 Triple Witch expiration on March 20 amplifies the downside move
- 📈 VIX already elevated at 19.86-24.66 -- academic research shows momentum crashes occur during periods of elevated volatility
What it means for the put trade: Payday. At $242, each put is worth $3.00 intrinsic -- returning $975K on $1.2M (partial recovery). At $240, each put is worth $5.00 -- returning $1.625M (+35% profit). Below $240, the trade starts generating outsized returns.
💡 Trading Ideas
🛡️ Conservative: The "Wait for CPI" Approach
Play: Watch from the sidelines until CPI data drops on March 11
Why this works:
- ⏰ CPI on March 11 will set the tone for the rest of March -- no point guessing
- 📊 MTUM is range-bound at $250-$255 -- no clear edge either way right now
- 🎢 Implied volatility is elevated, making options expensive heading into the data
- 💸 Post-CPI IV crush will make options cheaper for entry
- 🎯 If CPI is hot and MTUM drops toward $248-$250, buying shares near support is the safest play
Action plan:
- 👀 Watch March 11 CPI closely -- hot = bearish for MTUM, cool = bullish
- 🎯 If bearish catalyst hits, consider buying shares at $248-$250 (near gamma support) for a longer-term hold through the May rebalance
- ⏰ If bullish catalyst hits, consider buying the $255-$260 area if MTUM breaks above $255 resistance
Risk level: Minimal (cash position) | Skill level: Beginner-friendly
⚖️ Balanced: Put Spread Into CPI/FOMC
Play: Buy the March 20 $250/$240 put spread
Structure: Buy $250 puts, Sell $240 puts (March 20 expiration)
Why this works:
- 🎯 Defined risk: Maximum loss limited to the debit paid (~$2.50-$3.50 per spread)
- 📉 Aligned with the institutional flow -- following the big money into the bearish setup
- 📅 Perfectly spans both CPI (March 11) and FOMC (March 17-18) catalysts
- 📊 The $250 strike is the put gamma support level -- if it breaks, $240 is a realistic target
- 💸 Selling the $240 put offsets cost and defines risk vs. the outright put buy
Estimated P&L:
- 💰 Cost: ~$3.00 per spread ($300 per spread)
- 📈 Max profit: $7.00 per spread ($700) if MTUM at or below $240 at expiration
- 📉 Max loss: $3.00 per spread ($300) if MTUM stays above $250
- 🎯 Breakeven: ~$247
Risk level: Moderate (defined risk) | Skill level: Intermediate
🚀 Aggressive: Follow the Whale Into Outright Puts
Play: Buy March 20 $248 puts outright -- slightly higher strike than the whale for better odds
Structure: Buy $248 puts (March 20 expiration)
Why this could work:
- 🐋 Following $1.2M institutional flow with a z-score of 13.26
- 📉 Momentum factor is structurally vulnerable -- MTUM can't rebalance until end of May
- 📅 Two major catalysts (CPI + FOMC) in the next 16 days could trigger a breakdown
- 🔥 VIX already elevated -- momentum crashes historically occur during volatile periods
- 📊 $248 strike gives a slightly better probability of profit vs. the $245 strike the whale bought
Why this could blow up:
- 💥 18 days is a short window -- theta decay will eat your premium daily
- 📈 If CPI is cool and FOMC is dovish, tech bounces and MTUM rips to $260+
- 💸 Paying full premium on outright puts means 100% loss risk
- 🎢 IV is elevated -- you're buying expensive options
- ⚠️ Factor ETFs can snap back hard when rotation reverses -- remember MTUM did +32.89% in 2024
Estimated P&L:
- 💰 Cost: ~$4.50-$5.00 per contract ($450-$500 per contract)
- 📈 Max profit: Theoretically large if MTUM collapses below $240
- 📉 Max loss: 100% of premium -- entire investment
- 🎯 Breakeven: ~$243-$243.50
Risk level: HIGH (full premium at risk) | Skill level: Advanced
⚠️ Risk Factors
Don't get blindsided by these potential landmines:
-
📊 Momentum crash risk is real but not guaranteed. JP Morgan warns momentum is aligned with expensive stocks, but momentum strategies have also historically delivered +506% returns and can snap back violently. The last momentum crash was in 2009 -- 17 years ago.
-
⏰ 18 days is tight. This trade lives or dies by March 20. Theta decay accelerates as expiration approaches, meaning the put loses value every single day if MTUM doesn't move down. The clock is the biggest enemy.
-
🔄 Value rotation could stall. If the value-over-growth trade runs out of steam -- which rotations frequently do -- MTUM's tech-heavy portfolio could bounce hard. The MACD turned positive on February 25, which is a short-term bullish signal.
-
💰 $3.06B in fund inflows over 12 months. Institutional money keeps flowing into MTUM despite the factor underperformance. $707.6M in the last 3 months alone suggests big allocators are buying the dip, not running for the exits.
-
🏦 FOMC could go either way. A dovish surprise from the Fed on March 18 would turbocharge MTUM's growth holdings and obliterate the put trade with just 2 days until expiration.
-
📉 This could be a hedge, not a directional bet. A $1.2M MTUM put might be a small hedge for a portfolio manager with $100M+ in momentum stocks. If it's a hedge, the trader doesn't actually need MTUM to drop -- they just want insurance. Following a hedge trade directionally can lead you astray.
-
🎰 Triple Witch risk cuts both ways. While quarterly expiration can amplify moves, it can also create random noise and pin effects around popular strikes. The $250 level could act as a magnet, keeping MTUM frustratingly close to but above the $245 strike.
🎯 The Bottom Line
Real talk: A $1.2M put buy on a factor ETF with a z-score of 13.26 is the kind of trade that happens only a handful of times per year on MTUM. This is serious capital being deployed with serious conviction -- someone believes momentum stocks are in trouble for the next 18 days.
And the case is credible:
- 🔻 MTUM's 40.88% tech weighting is a liability in a market rotating to value and cyclicals
- 📊 The fund can't fully rebalance until end of May -- it's stuck holding yesterday's winners
- 🔥 CPI (March 11) and FOMC (March 17-18) create two live-fire events that could break the $250 support
- 📈 VIX is elevated and momentum crashes historically cluster in volatile regimes
- 💸 The $245 strike lines up perfectly with the lower bound of the options-implied move range ($244.86)
But don't blindly follow the whale:
- ⏰ 18-day expiration means zero margin for error
- 📊 Strong fund inflows ($3B+ over 12 months) suggest institutional buyers are absorbing selling pressure
- 🔄 The trade could be a portfolio hedge, not a directional call
- ⚖️ If CPI is cool and FOMC is dovish, this put goes to zero fast
If you're bearish on momentum:
- 🎯 The put spread approach ($250/$240) gives you defined risk exposure to this thesis for ~$300 per spread
- 📅 Wait for CPI data on March 11 before going all-in -- let the data confirm or deny
- 🛡️ Consider position size carefully -- this is a short-dated trade on a thesis, not a sure thing
If you own MTUM:
- 👀 Pay attention to the $250 support level -- if it breaks convincingly, consider trimming
- 📅 Mark your calendar for the end-of-May semi-annual rebalance which could dramatically reshape the portfolio toward current market leaders
- 🛡️ Consider buying protective puts or put spreads for March if you're worried about CPI/FOMC risk
If you're watching from the sidelines:
- ⏰ No rush. The bigger structural opportunity is around the May rebalance when MTUM could pivot from tech-heavy to a more balanced sector mix
- 📊 A drop to $240-$245 could actually be an attractive entry point for a rebalance recovery trade
- 🔎 Watch the value-vs-growth rotation closely -- when it exhausts, momentum stocks typically snap back hard
Mark your calendar -- Key dates:
- 📅 March 11 (Wednesday) -- February CPI release at 8:30 AM ET -- make-or-break for the rate outlook
- 📅 March 17-18 (Tuesday-Wednesday) -- FOMC meeting with dot plot and economic projections
- 📅 March 20 (Friday) -- Triple Witch expiration + this put trade's judgment day
- 📅 May 15 -- Jerome Powell's term as Fed Chair expires -- new chair could shift rate trajectory
- 📅 End of May 2026 -- MTUM semi-annual major rebalance -- up to 67% portfolio turnover possible
- 📅 July 24, 2026 -- Section 122 tariff window expires -- binary outcome for supply chain
Disclaimer: Options trading involves substantial risk of loss and is not suitable for all investors. This analysis is for educational purposes only and not financial advice. Past performance doesn't guarantee future results. The 13.26 z-score reflects this trade's statistical unusualness relative to recent MTUM options activity -- it does not imply the trade will be profitable or that you should follow it. Always do your own research and consider consulting a licensed financial advisor before trading.
About iShares MSCI USA Momentum Factor ETF (MTUM): MTUM tracks the MSCI USA Momentum SR Variant Index, selecting and weighting U.S. large- and mid-cap stocks with strong recent price momentum. With ~$21B in AUM and a 0.15% expense ratio, it is the largest momentum factor ETF available. The fund holds 129 stocks with 40.88% in Technology, and rebalances quarterly (with a major semi-annual reconstitution).