MU Institutional Players Lock in $11.6M Profit on Long Call Positions
January 8, 2026 | Unusual Options Activity Detected
Company Overview
| Metric | Value |
|---|---|
| Company | Micron Technology, Inc. |
| Ticker | MU |
| Sector | Semiconductors & Related Devices |
| Market Cap | $382.17B |
| Current Price | $325.86 (as of January 8, 2026) |
Description: Micron is one of the largest semiconductor companies in the world, specializing in memory and storage chips. The company focuses on DRAM and NAND flash, serving data centers, mobile devices, and automotive applications. Micron has emerged as a critical supplier of high-bandwidth memory (HBM) for AI accelerators from NVIDIA and AMD.
The Quick Take
Institutional traders closed out $11.6M worth of long call positions in MU today across multiple expirations ranging from June 2026 to December 2028. The heaviest activity hit the June 2026 $380 calls with one trade registering a 4.98 z-score (extremely unusual) - the kind of volume you might see a few times per year on this contract. This looks like profit-taking after MU's remarkable 239% run in 2025 and continued 20% YTD gains in 2026.
The Option Flow Breakdown
What Just Happened
| Time | Option Symbol | Buy/Sell | Call/Put | Expiration | Strike | Volume | OI | Premium | Strategy |
|---|---|---|---|---|---|---|---|---|---|
| 10:53:14 | MU20260618C380 | SELL | CALL | 2026-06-18 | $380 | 2,000 | 2,800 | $2.0M | Closing Call |
| 10:42:29 | MU20260618C380 | SELL | CALL | 2026-06-18 | $380 | 1,000 | 2,800 | $1.4M | Closing Call |
| 10:22:28 | MU20260618C380 | SELL | CALL | 2026-06-18 | $380 | 519 | 2,800 | $2.1M | Closing Call |
| 09:53:54 | MU20260717C300 | SELL | CALL | 2026-07-17 | $300 | 253 | 2,108 | $2.1M | Closing Call |
| 09:42:56 | MU20281215C340 | SELL | CALL | 2028-12-15 | $340 | 102 | 61 | $1.5M | Short Call |
| 09:36:05 | MU20280121C330 | SELL | CALL | 2028-01-21 | $330 | 300 | 1,800 | $2.5M | Closing Call |
Total Premium: $11.6M
What This Actually Means
Translation for us regular folks: Big money is cashing out their bullish MU bets.
Here's the pattern:
-
$5.5M in June 2026 $380 calls closed - Someone held deep ITM calls (current price $325.86, strike $380) and decided to lock in profits. The 4.98 z-score on that 2,000-contract trade means this size happens roughly 2-3 times per year on this contract.
-
$2.1M in July 2026 $300 calls closed - These were deep in-the-money calls ($25.86 ITM), suggesting an investor who rode MU's 2025 rally is now banking gains.
-
$2.5M in Jan 2028 LEAPS closed - Long-dated call holders taking chips off the table after the stock's massive run.
-
$1.5M in Dec 2028 calls OPENED (short) - One trader initiated a new short call position on 2028 LEAPS. This is either covered call writing or a bearish bet that MU won't reach $340 by late 2028.
The overall picture: Profit-taking mode. After MU delivered 239% returns in 2025 and another 20% YTD, institutional holders are locking in gains rather than pressing their bets.
Technical Setup
YTD Chart
The chart below shows MU's remarkable ascent from the $60s to current levels near $326:
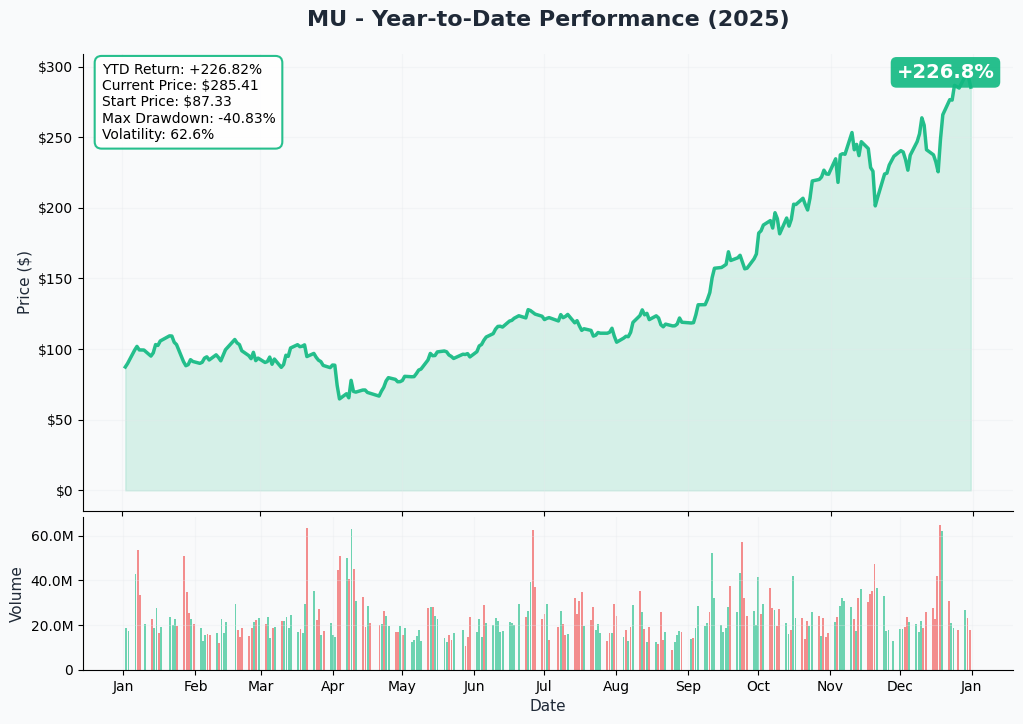
MU has been on a tear driven by the AI memory supercycle. The stock reached an all-time high of $346.30 recently before pulling back slightly. Volume remains elevated as traders debate whether the rally has more room to run.
Gamma-Based Support & Resistance
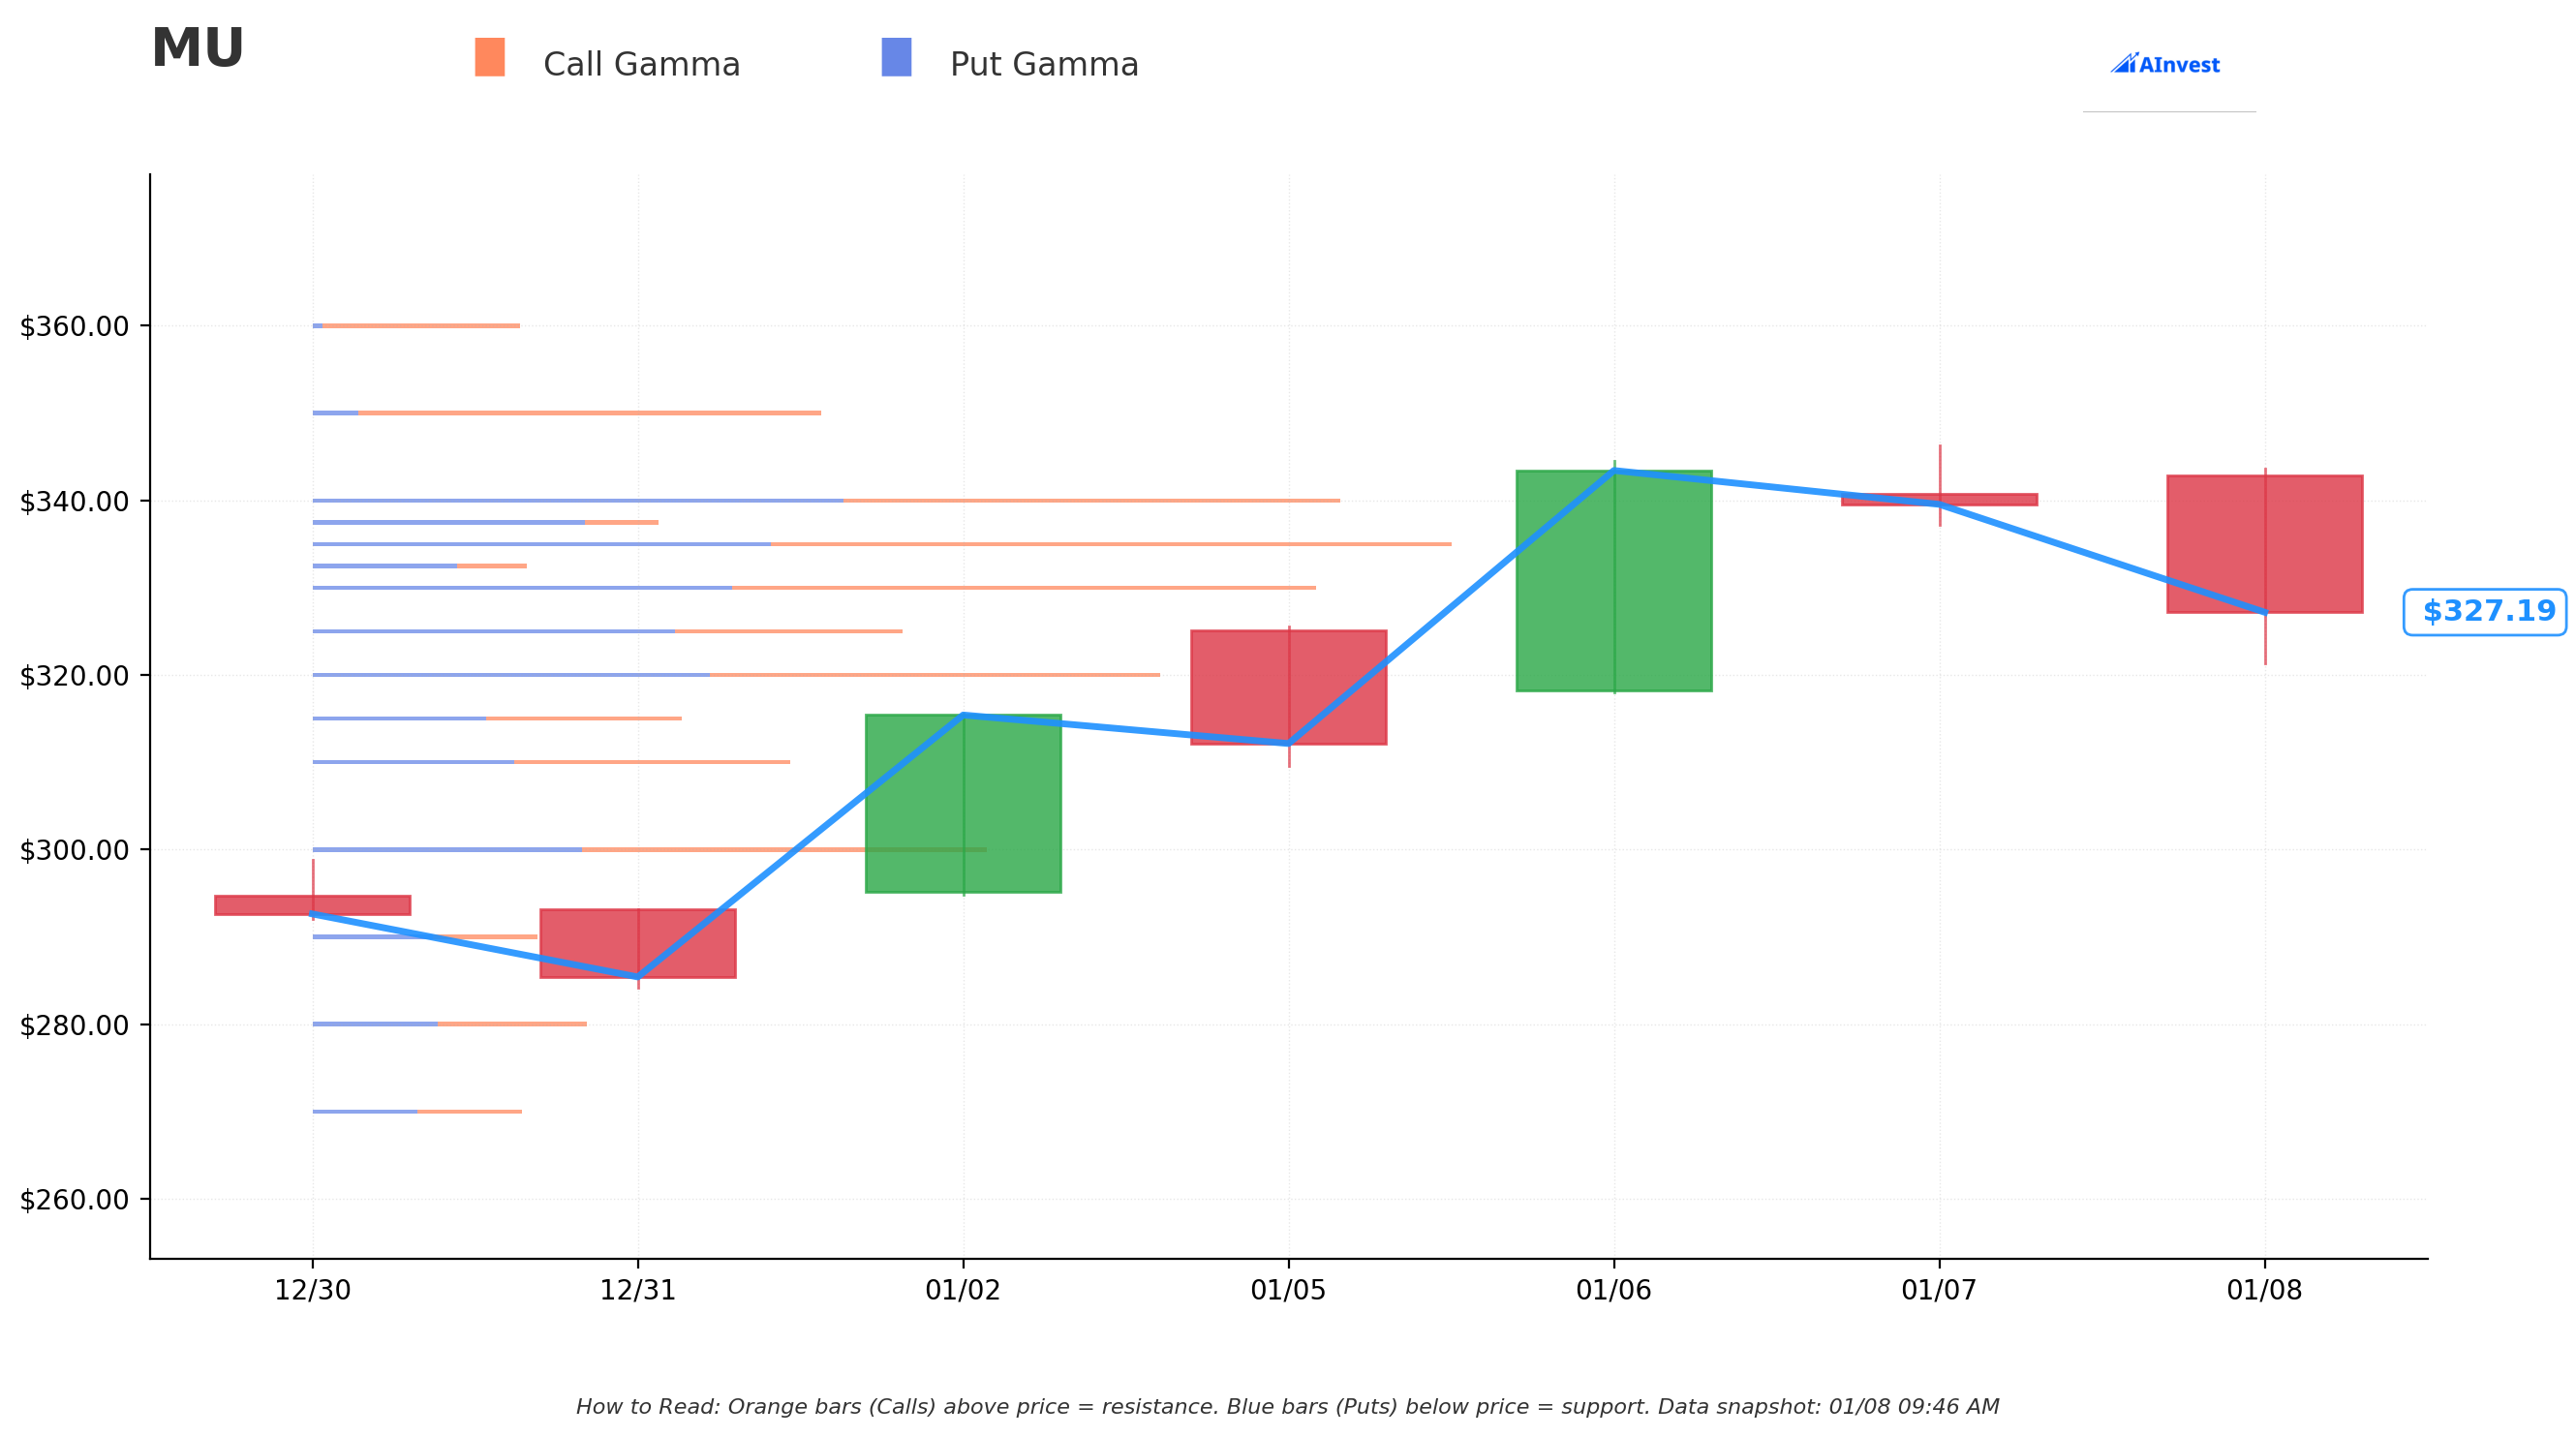
Note: Gamma exposure data shows the key strike levels where market makers hold significant options exposure. These levels often act as magnets for price action.
Key observations based on the options activity:
- $380 Resistance Zone - Heavy call activity at this strike suggests resistance. This was the primary exit point for today's institutional sellers.
- $340 Level - The new short call position at this strike for 2028 indicates this trader views $340 as a ceiling over the next two years.
- $300-$330 Support Range - The deep ITM calls being closed at $300 and $330 strikes suggest these are levels where bulls previously accumulated positions.
Implied Move Analysis
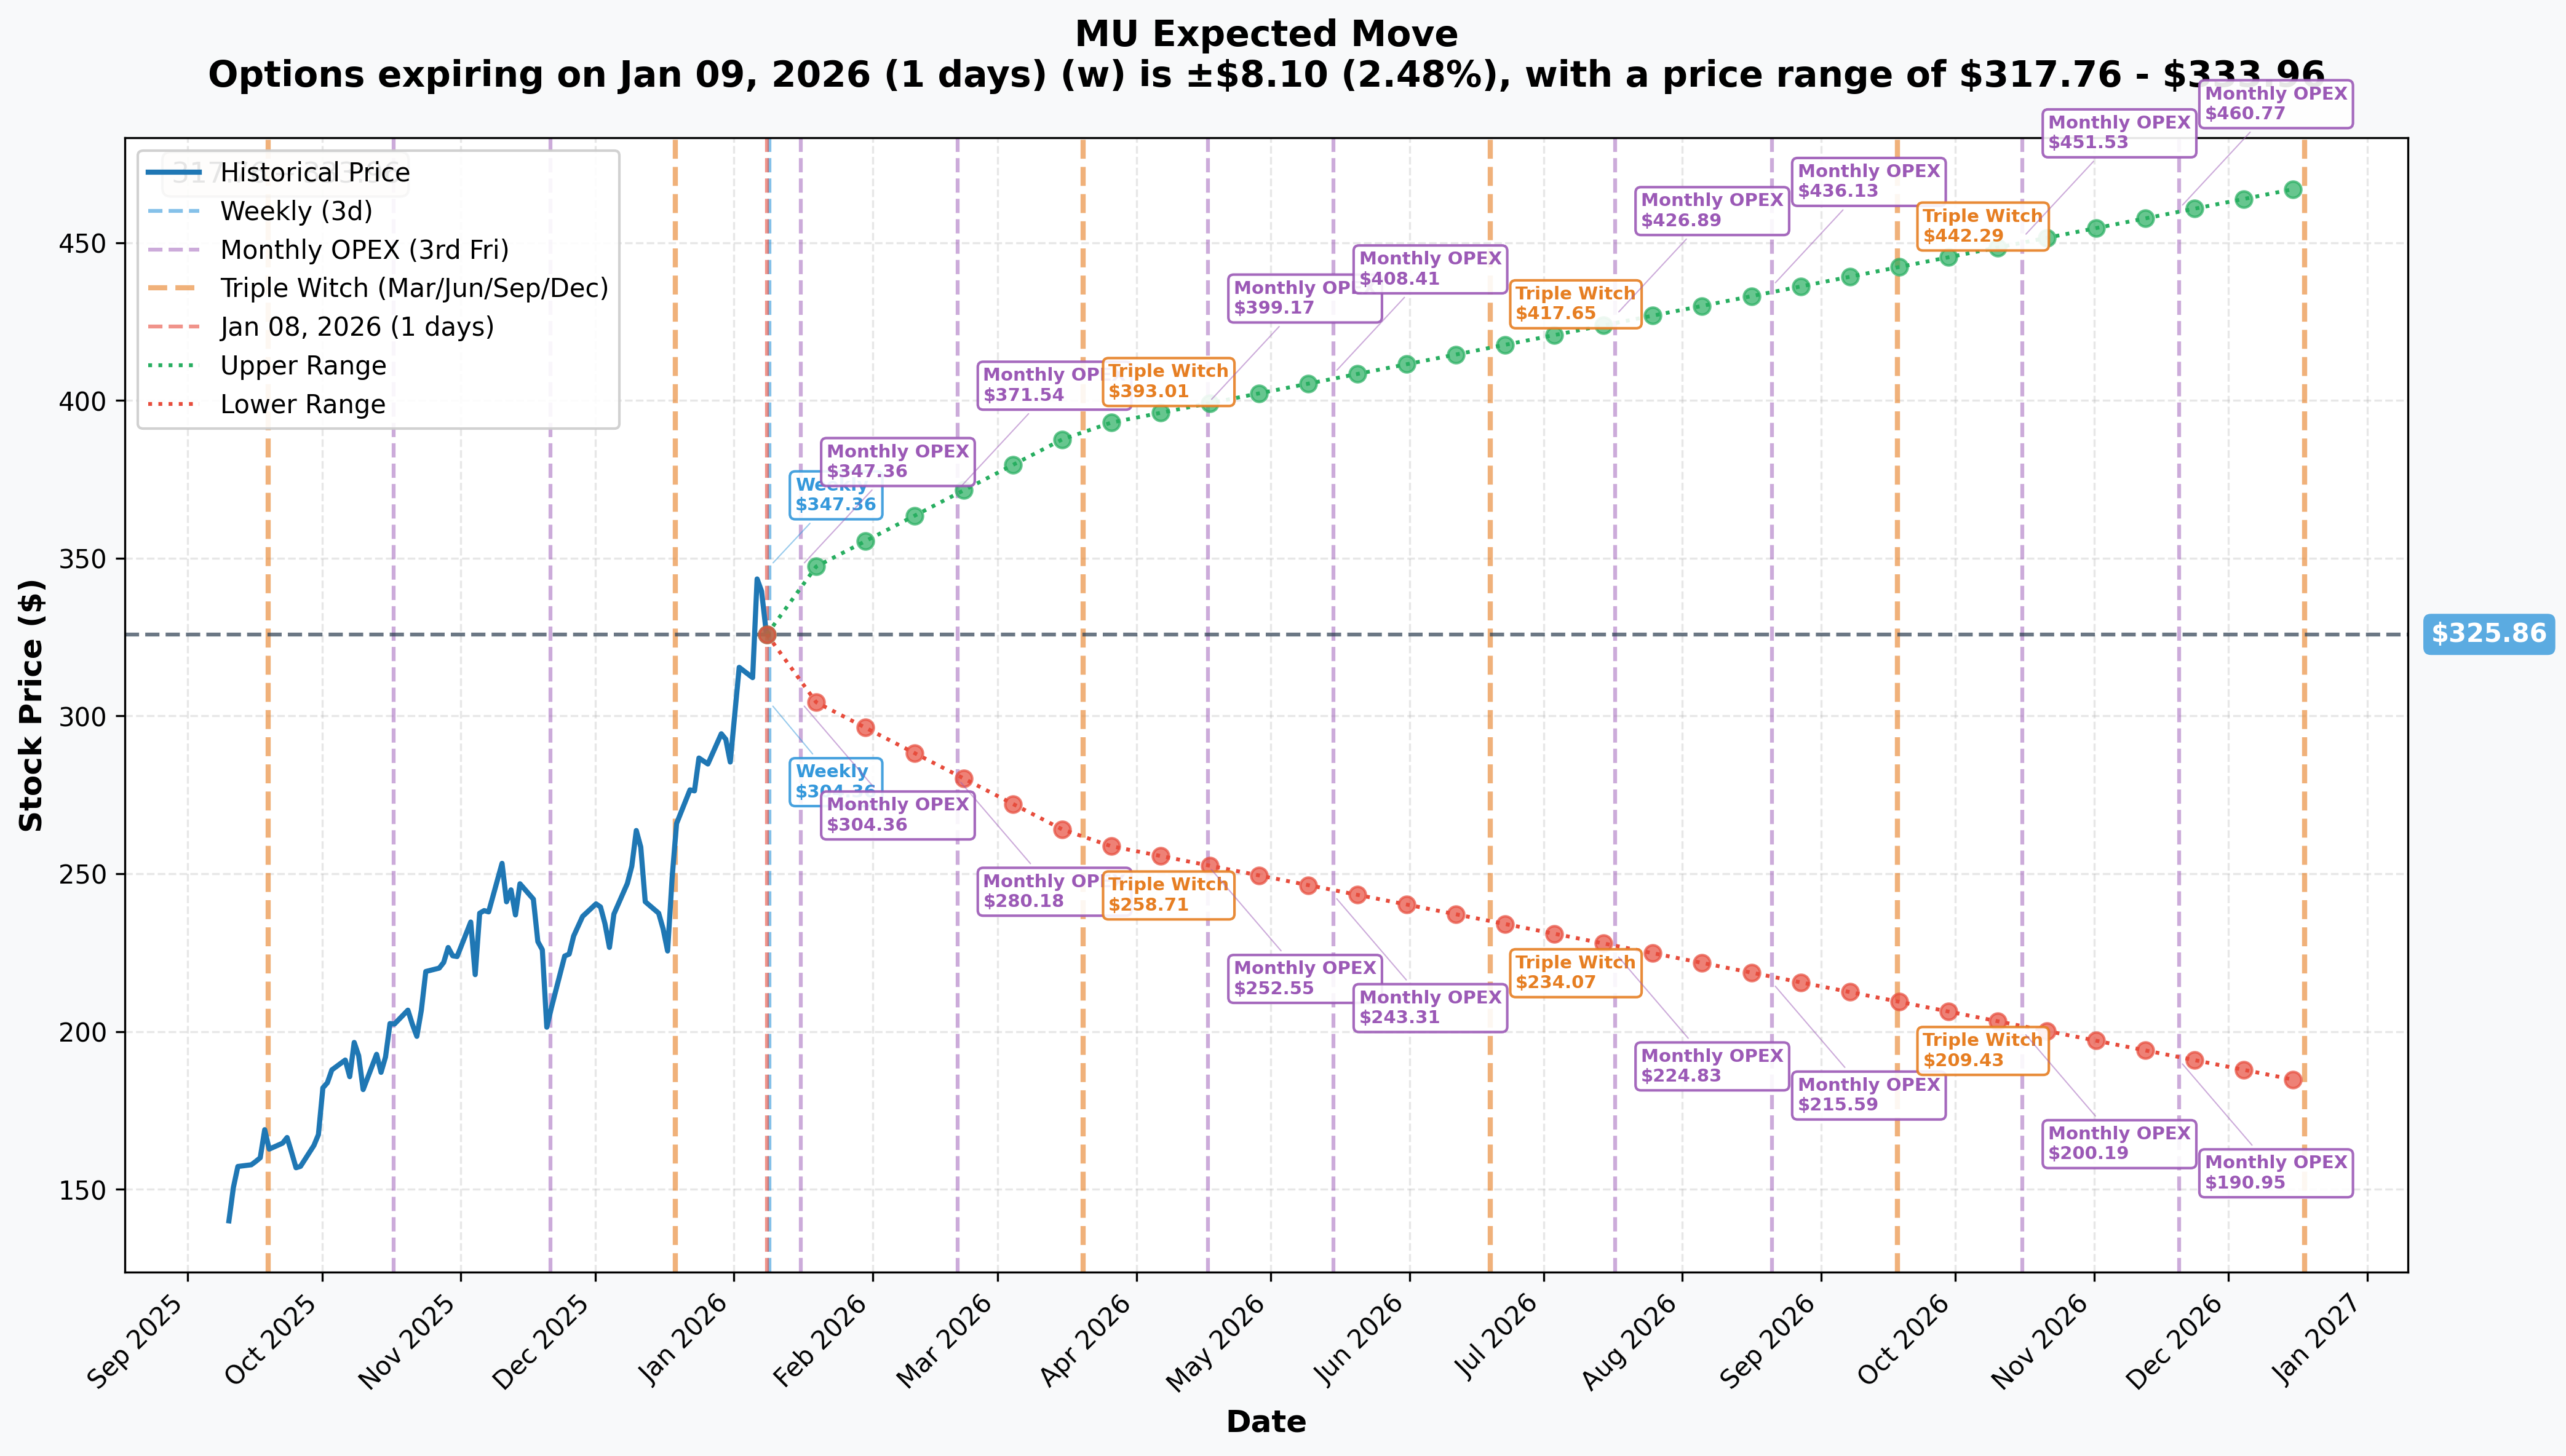
| Timeframe | Expiry | Implied Move | Range |
|---|---|---|---|
| Weekly | 2026-01-09 | 2.48% | $317.76 - $333.96 |
| Monthly OPEX | 2026-01-16 | 5.92% | $306.56 - $345.16 |
| Triple Witch | 2026-03-20 | 20.09% | $260.39 - $391.33 |
| LEAPS | 2026-12-18 | 43.55% | $183.95 - $467.77 |
Key Insights:
- The market is pricing in high volatility for MU through 2026
- Monthly OPEX (January 16) implies a range of $306.56 to $345.16 - the recent ATH of $346.30 sits right at the upper edge
- By June 2026 (Triple Witch timeframe), options pricing suggests MU could move anywhere from $234 to $418
- The wide LEAPS range ($184-$468) reflects the inherent uncertainty in cyclical memory stocks
Catalysts
Upcoming Events
| Date | Event | Significance |
|---|---|---|
| April 1, 2026 | Q2 FY2026 Earnings | Revenue guidance of $18.7B with 68% gross margin target |
| Mid-2026 | NY Megafab Construction Start | $100B long-term investment begins |
| Q4 2026 | HBM4 Mass Production | Critical for NVIDIA Rubin platform supply |
| Late 2026 | India Facility Full Ramp | Assembly and test capacity expansion |
Recent Catalysts (Already Happened)
- December 17, 2025: Record Q1 FY2026 earnings - $13.64B revenue (+57% YoY), $4.78 non-GAAP EPS
- December 2025: HBM capacity sold out through all of calendar 2026
- December 2025: Exited consumer memory business (Crucial brand) to focus on AI/enterprise
- December 2025: Capex raised to $20B for FY2026
- October 2025: AMD MI350 partnership with Micron HBM3E integration
Price Targets & Probabilities
Based on implied move data and institutional positioning:
| Scenario | Target | Timeframe | Probability | Rationale |
|---|---|---|---|---|
| Bull Case | $391-$400 | Q1 2026 | 25% | Triple Witch upper range; requires beat-and-raise on Q2 earnings |
| Base Case | $320-$345 | Jan-Mar 2026 | 50% | Consolidation within recent range; ATH resistance at $346 |
| Bear Case | $260-$300 | Q1 2026 | 25% | Valuation reset if memory pricing weakens or AI capex slows |
What the Options Market is Telling Us:
The institutional exits today suggest smart money is de-risking after a massive run. The $380 strike for June 2026 was a popular target - but sellers are taking profits NOW rather than waiting to see if MU can push another 17% higher.
The new short call at $340 for December 2028 is particularly interesting. At current prices of $325.86, this trader is betting MU won't be above $340 in nearly three years - a modestly bearish view that perhaps suggests the memory supercycle narrative is fully priced in.
Trading Ideas
Conservative: Cash-Secured Put at Support
Strategy: Sell February 2026 $300 Puts
- Strike: $300 (8% below current price)
- Premium Target: ~$8-10 per contract
- Max Risk: Assignment at $300 (effective cost basis ~$291)
- Why This Works: The $300 level saw deep ITM call holders exit today, suggesting it was a previous accumulation zone. Selling puts here collects premium while setting up potential entry at attractive levels.
- Risk: Memory stocks are cyclical - a sector-wide selloff could push MU below $300
Balanced: Call Spread to Capture Earnings Upside
Strategy: Buy April 2026 $330/$380 Call Spread
- Structure: Buy $330 call, sell $380 call
- Max Profit: $50 per spread minus debit paid
- Max Risk: Premium paid
- Why This Works: Captures upside into Q2 earnings (April 1) with defined risk. The $380 ceiling matches the strike where institutions exited today.
- Risk: If MU pulls back ahead of earnings, the spread loses value rapidly
Aggressive: Contrarian Long on Weakness
Strategy: Buy June 2026 $350 Calls on a Pullback to $310-315
- Entry Trigger: Wait for pullback to monthly OPEX lower range (~$307)
- Target: $380-$400 ahead of HBM4 production announcements
- Stop Loss: Close if MU breaks below $290
- Why This Works: Institutions are taking profits after a massive run, which often creates short-term weakness. The AI memory story remains intact, and Q4 2026 HBM4 mass production could be the next major catalyst.
- Risk: You're fighting institutional flows; momentum could continue lower before finding a bottom
Risk Factors
- Valuation Stretched: P/E of ~30x is historically high for a cyclical memory company
- Competition Intensifying: SK Hynix holds 62% of HBM market; Samsung expanding capacity 50%
- Capital Intensity: $20B capex commitment could pressure returns if pricing normalizes
- Geopolitical Risk: China restrictions and tariff uncertainty remain headwinds
- Memory Cycle Risk: The industry has historically experienced boom-bust cycles; current upcycle unlikely to persist indefinitely
- Execution Risk: HBM4 production timing critical for maintaining competitiveness vs SK Hynix
The Bottom Line
Real talk: Today's $11.6M in call selling tells a clear story - big players are locking in profits after MU's incredible run.
Here's the deal:
-
If You Own MU: Consider taking partial profits here. The smart money is reducing exposure after 239% gains in 2025 and 20% YTD in 2026. You don't have to sell everything, but trimming makes sense.
-
If You're Watching: Wait for a pullback. The implied move data suggests support in the $300-$310 zone. That's a better entry than chasing at current levels.
-
If You're Bearish: The $340 strike for 2028 LEAPS saw a new short call position opened. You could follow that trade if you believe the AI memory narrative is fully priced in.
Mark Your Calendar: Q2 FY2026 earnings on April 1, 2026 will be the next major catalyst. The company guided for $18.7B in revenue with 68% gross margins - any miss will reset valuations quickly.
The AI memory supercycle is real, and Micron is a major beneficiary. But after this magnitude of gains, some consolidation is healthy and expected. Today's institutional exits suggest the easy money has been made.
Disclaimer: This analysis is for educational purposes only and does not constitute investment advice. Options trading involves substantial risk of loss and is not suitable for all investors. Past performance does not guarantee future results. Always conduct your own research and consult with a qualified financial advisor before making investment decisions.
Analysis generated January 8, 2026 | Data sourced from institutional options flow