MU (Micron Technology) Options Flow Analysis
January 16, 2026 | Unusual Options Activity Report
Executive Summary
A massive $21 million put purchase just hit the tape on Micron Technology. At 9:56 AM Eastern, someone bought 9,555 of the March 20, 2026 $330 puts for $22 each. With open interest sitting at just 2,300 contracts, this trade represents more than 4x the existing positioning at this strike. The premium alone is larger than most hedge fund positions in single-name options.
Is this a wealthy investor protecting a monster long position in the AI memory darling? Or is someone making a bold bearish bet that the semiconductor supercycle is about to crack? Let us break it down.
The Trade Tape
| Field | Value |
|---|---|
| Time | 09:56:32 ET |
| Ticker | MU |
| Direction | BUY |
| Type | PUT |
| Expiration | 2026-03-20 (63 days) |
| Strike | $330 |
| Spot Price | $361.44 |
| Option Price | $22.00 |
| Size | 9,555 contracts |
| Volume | 10,000 |
| Open Interest | 2,300 |
| Premium | $21,021,000 |
| Option Symbol | MU20260320P330 |
| Moneyness | 8.7% OTM |
| Strategy | Protective Put or Bearish Bet (BTO) |
Unusualness Score
Score: 8.5 / 10 | Level: EXTREME
[=========_] 8.5/10
Why This Trade Stands Out:
- Volume/OI Ratio: 4.15x - The trade size is more than 4x the existing open interest
- Premium Size: $21M is the size of a small hedge fund's entire options book
- Timing: Just 63 days until the trade's key catalyst - Q2 earnings on March 19
- Strike Selection: $330 is 8.7% below spot, right at analyst support levels
This is not your average retail trader buying lottery tickets. A $21 million single-trade commitment requires institutional firepower.
Company Overview
Micron Technology, Inc. is a global semiconductor powerhouse headquartered in Boise, Idaho. The company manufactures memory and storage chips, with DRAM as its primary revenue driver and NAND flash as a secondary business.
| Metric | Value |
|---|---|
| Sector | Semiconductors & Related Devices |
| Market Cap | $378.88 billion |
| Employees | 53,000 |
| 52-Week Range | $61.54 - $351.23 |
| 1-Year Performance | +224% |
| Website | micron.com |
Micron is riding what analysts are calling a "once-in-a-generation memory supercycle" driven by insatiable AI demand for High Bandwidth Memory (HBM). The company's Q1 FY2026 delivered record revenue of $13.64 billion (+57% YoY), and management guided Q2 to a staggering $18.7 billion 1.
YTD Price Performance
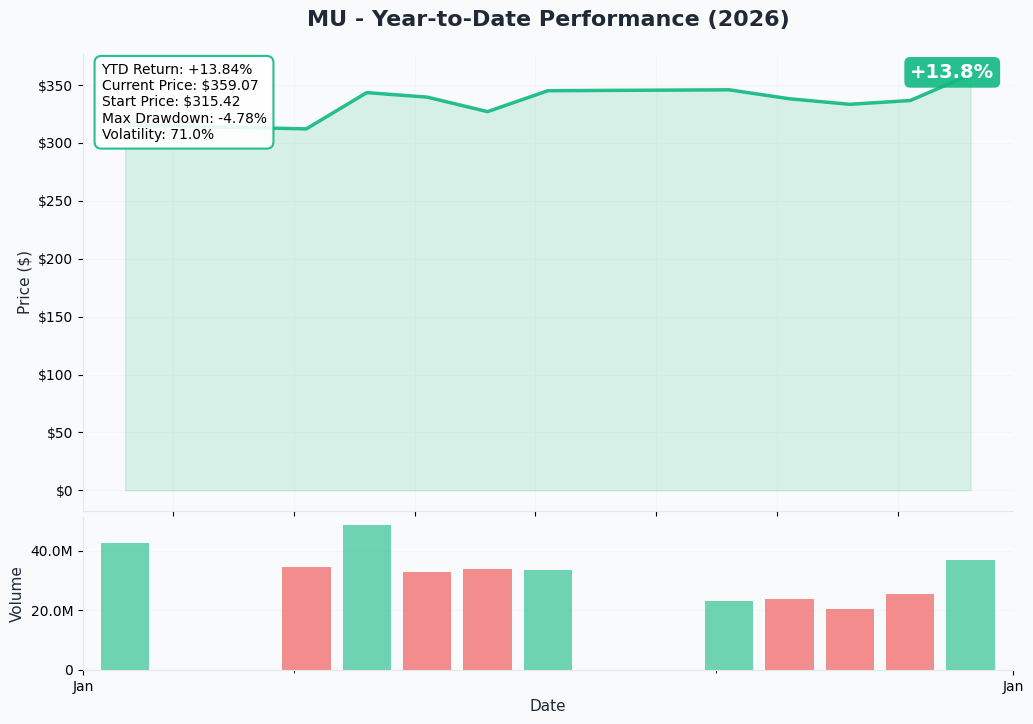
The stock has been on a tear, surging from the $100s to over $360 on the back of the AI memory boom. But after a 224% run in the past year, some investors may be looking to protect gains - or bet on a pullback.
Gamma Support/Resistance Levels
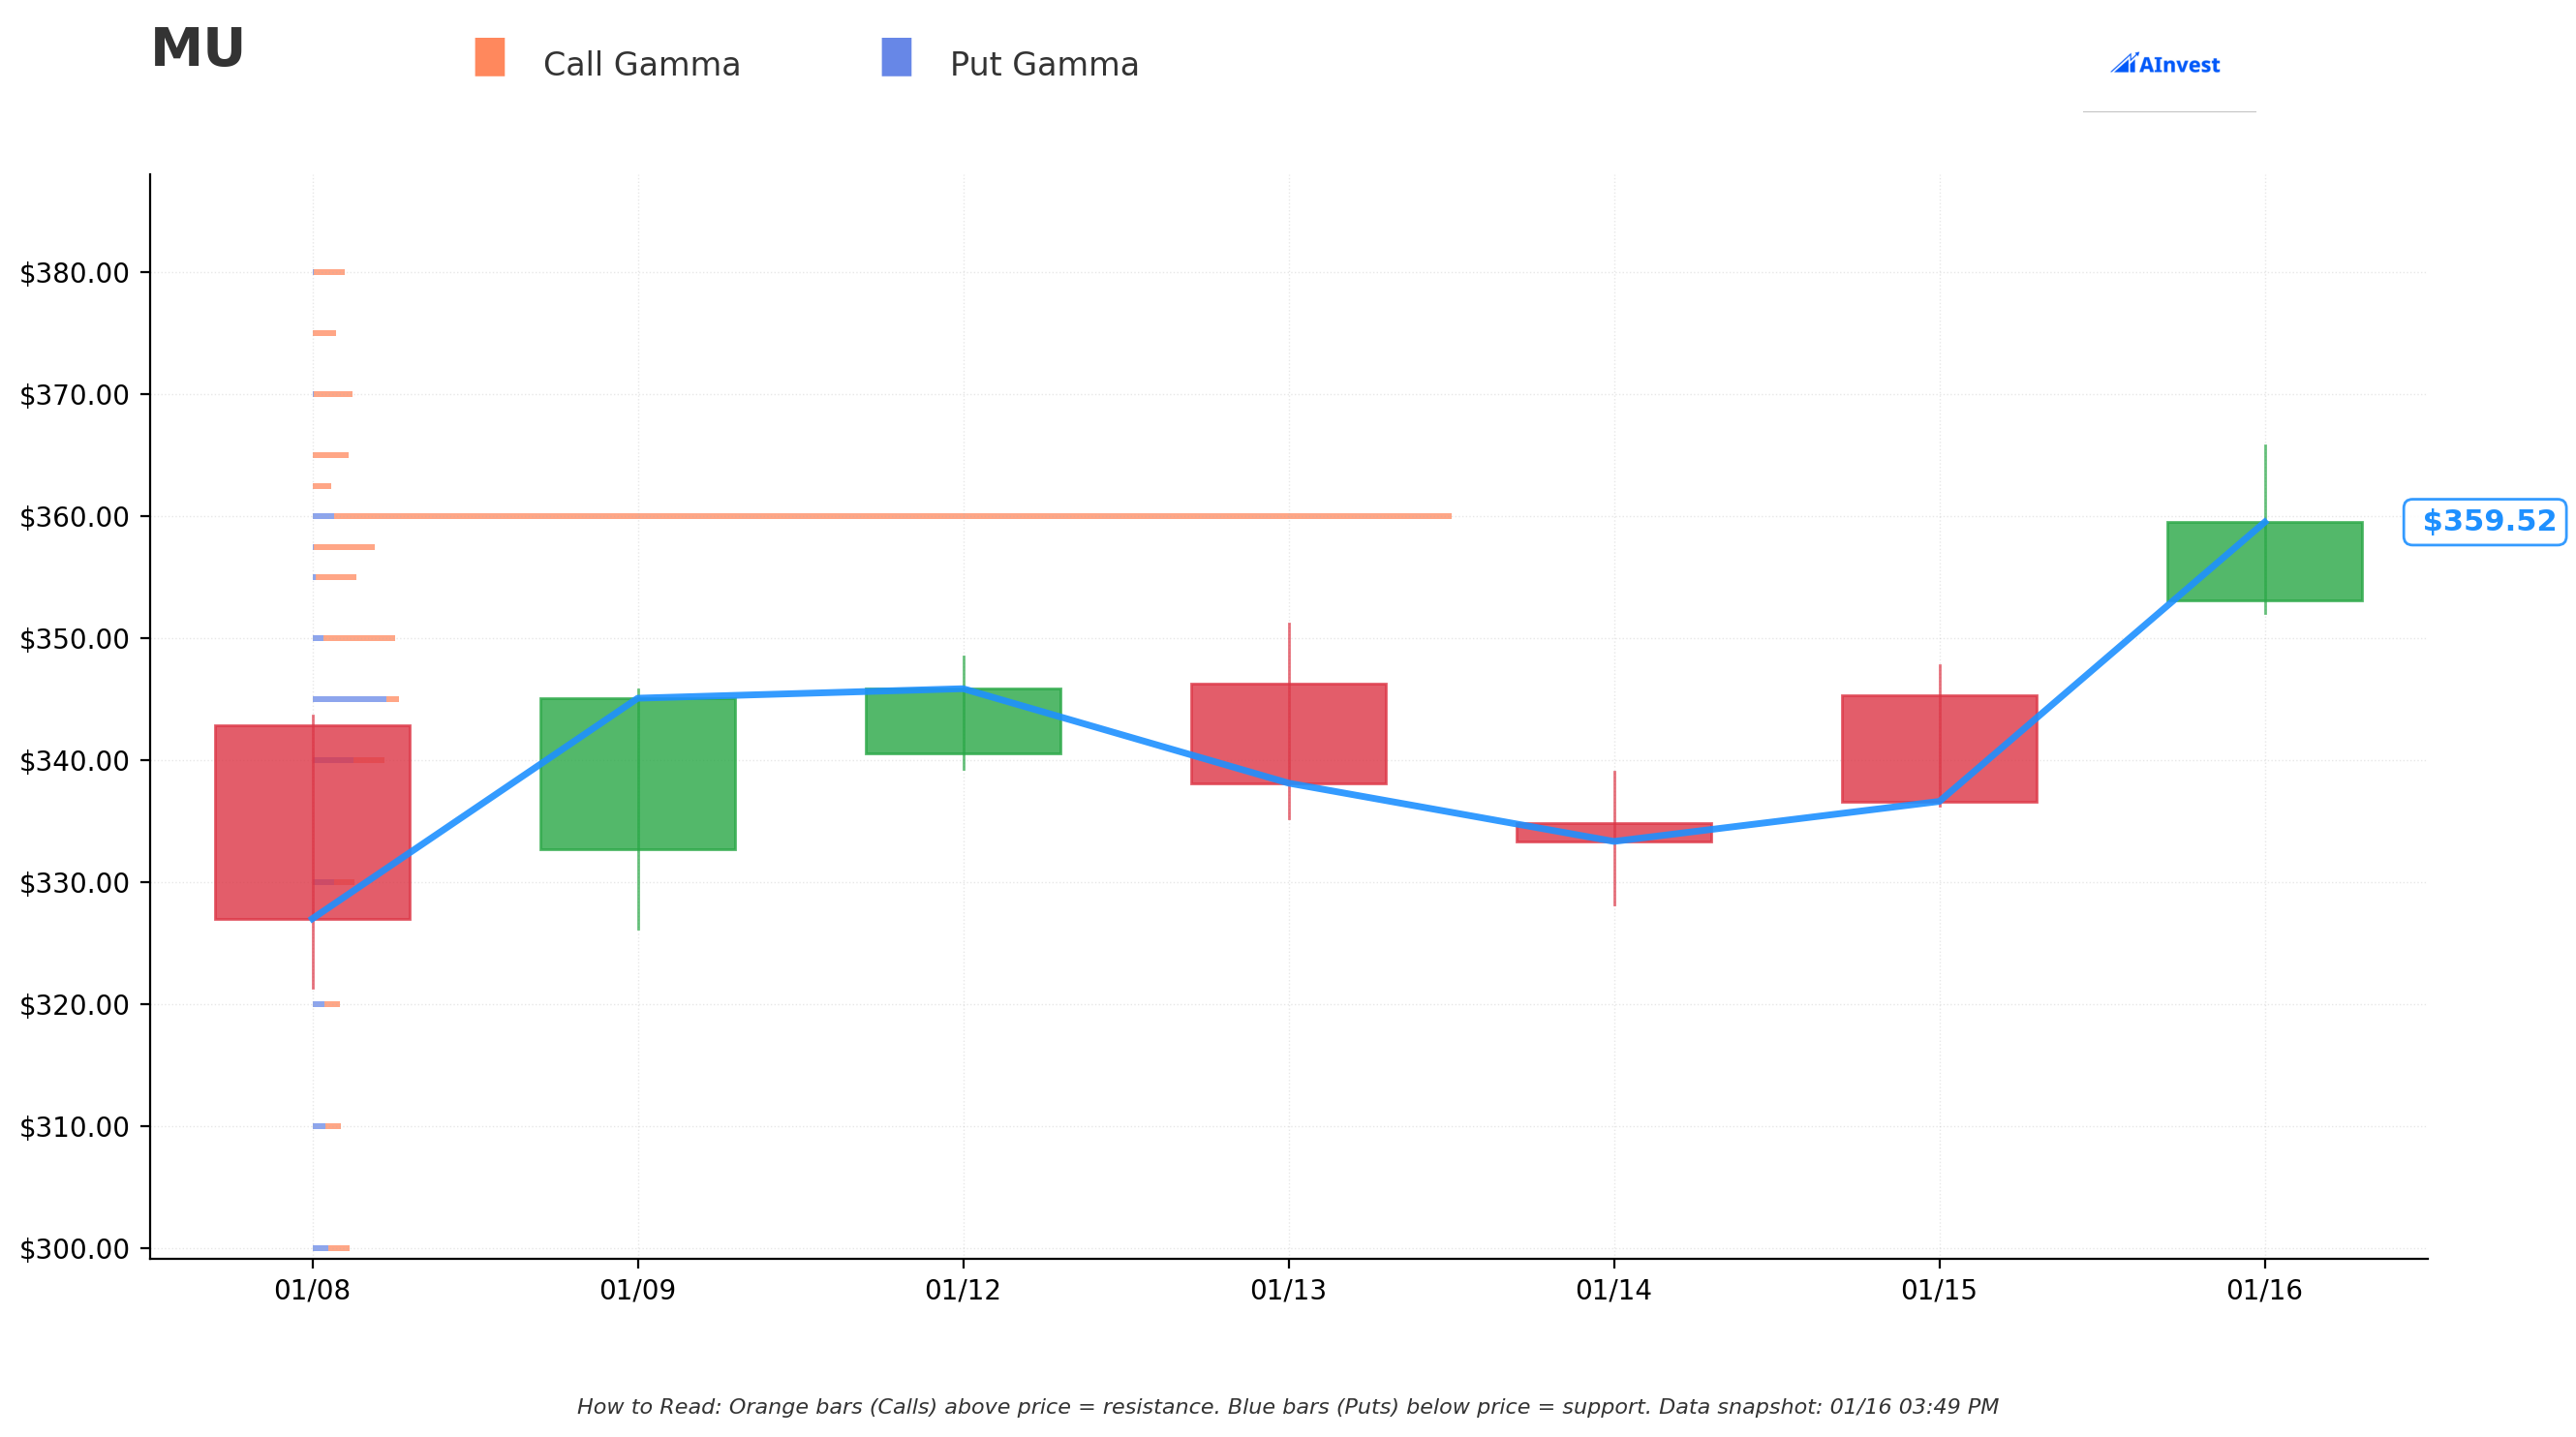
The gamma exposure chart reveals key levels where market makers have significant hedging obligations:
| Level | Type | Significance |
|---|---|---|
| $380 | Resistance | Heavy call gamma wall |
| $350 | Support | Strong put gamma accumulation |
| $330 | Support | This trade's strike - major put OI cluster |
| $300 | Support | Psychological level with gamma support |
The $330 strike selection is not random. It sits at a major gamma support level where dealer hedging could provide a floor if the stock pulls back.
Implied Move Analysis
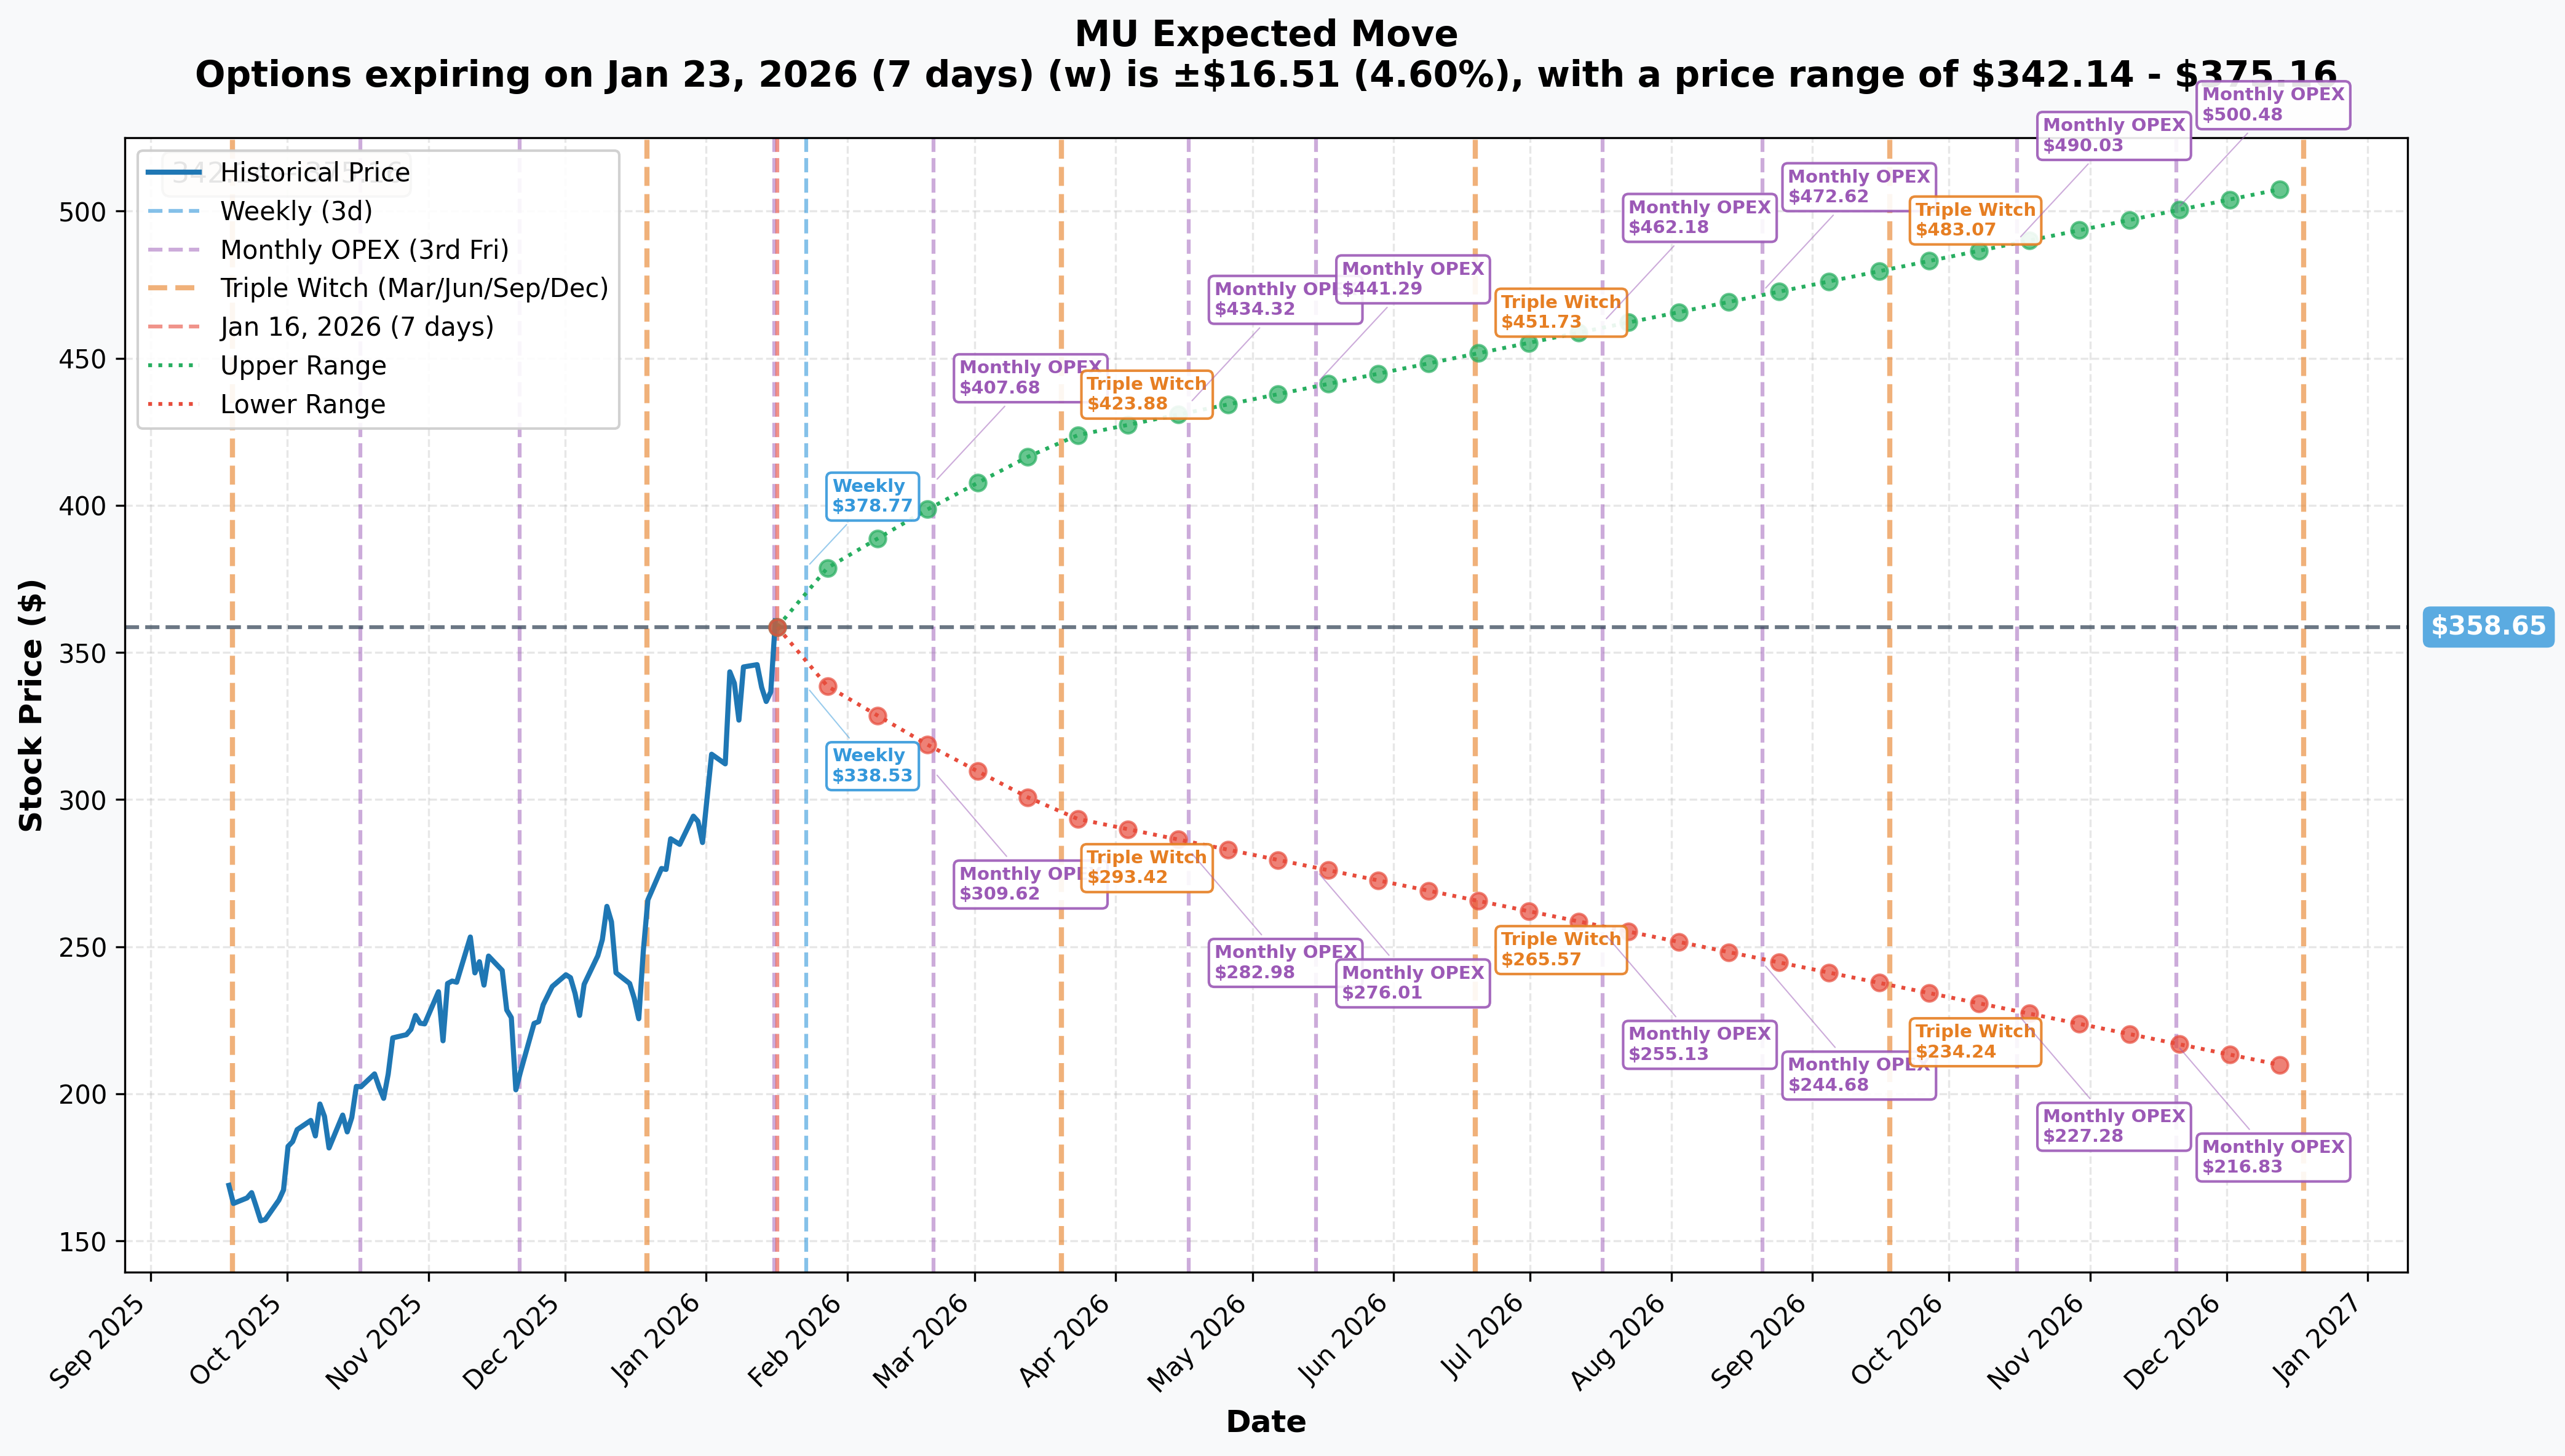
The options market is pricing in significant volatility through the March expiration.
| Timeframe | Expiry | Implied Move | Range |
|---|---|---|---|
| Weekly | Jan 23 | +/- 4.6% | $342 - $375 |
| Monthly OPEX | Feb 20 | +/- 11.65% | $317 - $400 |
| Triple Witch | Mar 20 | +/- 17.92% | $294 - $423 |
| LEAPS | Dec 18 | +/- 42.01% | $208 - $509 |
Key Insight: The March 20 options are pricing in an 18% move - right in line with Q2 earnings on March 19. The $330 strike sits at the lower bound of the 1-standard-deviation implied range ($294 - $423).
What Is This Trade? Two Scenarios
Scenario 1: Protective Put (Hedging a Long Position)
The Bull's Insurance Policy
If the trader owns 955,500 shares of MU (worth ~$345 million at current prices), this put purchase makes perfect sense as downside protection. Here is the math:
- Shares Protected: 955,500 (100 shares per contract x 9,555 contracts)
- Notional Value: ~$345 million in stock
- Protection Cost: $21M / $345M = 6.1% of position value
- Downside Floor: $330 (8.7% below current)
- Max Loss: ($361.44 - $330) x 955,500 + $21M = $51M (vs unlimited without hedge)
Why This Makes Sense:
- Q2 FY2026 earnings drop March 19 - one day before expiration
- Guidance of $8.42 EPS is astronomically high - any miss could crater the stock
- Memory stocks are notoriously cyclical - protecting gains is prudent
- Morningstar fair value is $618 2 - someone with that conviction wants to stay long
Scenario 2: Bearish Bet (Directional Short)
The Bear's Conviction Play
Alternatively, this could be a pure directional bet that MU is due for a correction. The case:
- Breakeven: $308 (strike minus premium per share = $330 - $22)
- Required Move: -14.8% from current levels
- Max Profit: Theoretically unlimited if stock crashes toward zero
- Risk/Reward: Risking $21M to potentially make multiples if MU revisits $250-$300
Why Someone Might Be Bearish:
- Memory cycles historically peak violently - 2018 saw MU drop 50% in months
- 68% gross margins guided for Q2 may be unsustainable 3
- SK Hynix holds 53-60% HBM market share vs Micron's 11% 4
- Consumer electronics weakness (PC market may contract 4.9-8.9% in 2026) 5
Catalyst Calendar
| Date | Event | Significance |
|---|---|---|
| Jan 23 | Weekly OPEX | Near-term gamma unwind |
| Feb 20 | Monthly OPEX | Position adjustment deadline |
| Feb 2026 | HBM4 Mass Production Begins | Execution risk catalyst |
| Mar 19 | Q2 FY2026 Earnings | MAJOR - $18.7B rev, $8.42 EPS guided |
| Mar 20 | Triple Witch OPEX | THIS TRADE EXPIRES |
| H2 2026 | NVIDIA Rubin Platform Launch | Demand validation catalyst |
The March 19 earnings report is the key event. Management has guided to record-breaking numbers:
- Revenue: $18.7B (+37% QoQ, record)
- Gross Margin: 68% (+21 percentage points YoY)
- EPS: $8.42 (record)
Any shortfall from these lofty expectations could trigger significant downside - exactly what this trade is positioned for.
Price Targets & Probabilities
Based on gamma levels, implied move data, and technical analysis:
| Target | Price | Probability | Scenario |
|---|---|---|---|
| Bullish | $423 | 25% | Blowout Q2 earnings, HBM4 ramp flawless |
| Base Case | $350-$380 | 50% | Meets expectations, normal volatility |
| Bearish | $294-$330 | 25% | Earnings miss or margin compression |
For This Trade:
- Put ITM by Expiration: 25% probability (stock below $330)
- Put Profitable by Expiration: 15% probability (stock below $308)
The options market implies roughly a 1-in-4 chance this trade ends up in-the-money.
Trading Strategies
Conservative: Monitor and React
Best For: Existing MU shareholders wanting to understand positioning
- Action: Watch the $330 level as key support
- Trigger: If MU breaks below $345 with volume, consider adding hedges
- Risk Management: Set stop-loss at $330 for any long positions
- Cost: $0 (information-based approach)
Balanced: Earnings Straddle
Best For: Traders expecting a big move but unsure of direction
- Action: Buy March 20 $360 straddle (ATM call + put)
- Cost: Approximately $50-55 per share ($5,000-$5,500 per contract)
- Breakeven: MU below $305 or above $415 by expiration
- Max Loss: Premium paid if stock sits at $360
- Edge: Implied move of 18% suggests market expects volatility
Aggressive: Follow the Flow
Best For: Traders who believe this is informed institutional activity
- Action: Buy March 20 $330 puts (following this trade)
- Cost: $22 per share ($2,200 per contract)
- Breakeven: $308 (-14.8%)
- Max Profit: Substantial if MU crashes
- Risk: 100% loss of premium if MU stays above $330
- Position Size: Risk no more than 2% of portfolio
Note: Following large trades blindly is risky. This could be a hedge, not a directional bet.
Risk Factors
For Put Buyers (Bearish Position)
- AI Memory Supercycle: Demand for HBM is genuinely unprecedented - fundamentals support the rally
- Pricing Power: Micron has HBM sold out through 2026 with locked-in pricing 6
- CHIPS Act Tailwind: $6.4 billion in federal funding supports long-term competitiveness 7
- Analyst Consensus: 93% Buy/Strong Buy ratings with $317 average target 8
- Short Squeeze Risk: Any positive surprise could trigger rapid covering
For Put Sellers (Bullish Position)
- Cyclical Peak Risk: Memory margins historically compress violently after peaks
- Competition: SK Hynix (53-60% HBM share) and Samsung are formidable rivals 4
- Consumer Weakness: PC/smartphone markets may contract in 2026 5
- Valuation: 224% gain in one year leaves little room for error
- Execution Risk: HBM4 production challenges could delay revenue recognition
Institutional Flow Context
This trade has the hallmarks of institutional activity:
- Size: $21M is beyond retail capacity
- Timing: Early morning execution suggests overnight decision
- Strike Selection: $330 aligns with gamma support and analyst price targets (HSBC, Bernstein both at $330)
- Expiration: Perfectly bracketing Q2 earnings
Recent insider activity shows Director Teyin M. Liu bought shares on January 13, 2026 9 - an interesting counterpoint to this put purchase.
Institutional ownership stands at 19.24%, with Vanguard (9.38%) and BlackRock (8.41%) as top holders 10.
Bottom Line
What We Know:
- Someone just committed $21 million to March $330 puts on Micron
- This is either a massive hedge on a ~$345M long position, or a bold bearish bet
- The trade expires one day after Q2 earnings - timing is not coincidental
- At 8.7% OTM, the strike aligns with major gamma support at $330
What This Means For You:
If you are long MU: This is a reminder that even the hottest stocks can pull back. Consider whether your position is sized appropriately for a potential 15-20% correction around earnings.
If you are considering a position: The March earnings event is a binary catalyst. The market is pricing in an 18% move - if you believe the actual move will be larger, options strategies may offer edge.
If you are neutral: Watch the $330 level. If MU breaks below it with conviction, the gamma dynamics could accelerate the move lower.
Action Plan:
- Before Feb 20: Assess your MU exposure and risk tolerance
- March 15-18: Watch pre-earnings positioning for additional flow signals
- March 19 (Earnings): Be prepared for a significant move in either direction
- March 20 (OPEX): Monitor gamma-driven price action
The smart money is clearly paying attention to downside risk in Micron. Whether this is prudent hedging or prescient bearishness, only time will tell.
Sources
Disclaimer: This analysis is for informational purposes only and does not constitute investment advice. Options trading involves significant risk of loss. Past performance does not guarantee future results. Always conduct your own due diligence before making investment decisions.
Data sourced from Polygon.io, ThetaData, and public filings. Analysis generated January 16, 2026.
Footnotes
-
Micron Technology Q1 FY2026 Earnings Release, December 17, 2025 - Record $13.64B revenue, Q2 guidance $18.7B ↩
-
Morningstar Fair Value Estimate, December 18, 2025 - $618.00 ↩
-
Micron Q2 FY2026 Guidance - 68% gross margin outlook ↩
-
TrendForce/Astute Group HBM Market Share Data, January 2026 - SK Hynix 53%, Samsung 35%, Micron 11% ↩ ↩2
-
IDC Global Memory Shortage Analysis, January 2026 - PC market contraction forecast ↩ ↩2
-
CEO Sanjay Mehrotra Earnings Call Comments - HBM sold out through 2026 ↩
-
CNBC/U.S. Dept of Commerce - $6.165B CHIPS Act funding finalized ↩
-
MarketBeat Analyst Consensus, January 2026 - 93% Buy/Strong Buy ↩
-
Funanc1al Insider Activity Report, January 2026 - Director Teyin M. Liu purchase ↩
-
MarketBeat Institutional Ownership Data, January 2026 ↩