🐋 MU: $26M LEAP Call Spread Roll Signals Peak-Cycle Positioning!
📅 February 3, 2026 | 🔥 Extremely Unusual Activity Detected
🎯 The Quick Take
Someone just executed a $26 MILLION LEAP call spread roll on Micron Technology (MU) - and they're selling the upside! 💰 Two simultaneous trades hit the tape at 14:52:06: a $15M sell-to-open at the $550 strike and an $11M sell-to-close at the $650 strike, both targeting January 2027 expiration. With Z-scores of 6.37 and 5.3 (EXTREMELY UNUSUAL - this type of volume happens only a few times per year), this looks like a major institution rolling their covered call position or adjusting a spread to collect premium at what they believe is peak-cycle pricing. Translation: Big money thinks MU's 247% rally might be running out of steam above $550 by early 2027.
🏢 Company Overview
Micron Technology, Inc. is one of the world's largest semiconductor manufacturers, specializing in memory and storage chips. Their bread and butter? DRAM (dynamic random access memory) - the stuff that powers everything from your smartphone to massive AI data centers.
| Metric | Value |
|---|---|
| Ticker | MU |
| Industry | Semiconductors & Related Devices |
| Market Cap | $492.7B |
| Current Price | $414.50 |
| 52-Week Performance | +247% 🚀 |
| Headquarters | Boise, Idaho |
| Employees | 53,000 |
Micron is riding the AI memory supercycle with HBM (High Bandwidth Memory) sold out through 2026. They're vertically integrated - meaning they control the whole process from design to manufacturing - which gives them an edge in quality and margins.
💰 The Option Flow Breakdown
📊 What Just Happened
Two massive LEAP trades hit simultaneously at 14:52:06 ET:
| Trade | Direction | Strike | Expiration | Volume | Premium | Order Type | Z-Score |
|---|---|---|---|---|---|---|---|
| 🔴 Trade 1 | SELL | $550 Call | 2027-01-15 | 2,800 | $15M | STO (Sell to Open) | 6.37 |
| 🔴 Trade 2 | SELL | $650 Call | 2027-01-15 | 2,100 | $11M | STC (Sell to Close) | 5.3 |
Total Premium Collected: $26,000,000 💵
🤓 What This Actually Means
Let me break this down for you:
This is a ROLL transaction - a sophisticated institutional move where someone is:
- Closing their $650 strike calls (STC = Sell to Close) - They previously owned these calls and are now cashing out for $11M
- Opening new $550 strike calls (STO = Sell to Open) - They're writing new covered calls at a LOWER strike, collecting $15M in fresh premium
Why would they do this? 🤔
- Taking chips off the table - By rolling down from $650 to $550, they're effectively saying "I don't think MU gets much above $550 by January 2027"
- Locking in gains - The $650 calls they bought probably appreciated significantly during MU's 247% rally
- Collecting premium - Now they're selling the $550 strike to generate income while capping their upside
- Peak cycle hedge - This screams "I think we're near the top of the memory cycle"
The Z-Scores tell the story:
- 6.37 Z-score means this trade is about 555x larger than average daily volume for that contract
- These scores put this activity in the "happens a few times per year" category
- Definitely NOT your neighbor Bob's Robinhood account - this is institutional money repositioning
📈 Technical Setup / Chart Check-Up
YTD Performance
MU has been on an absolute tear! The stock is up +20% YTD and +247% over the past 12 months. That's the kind of performance that makes even seasoned traders nervous about chasing.
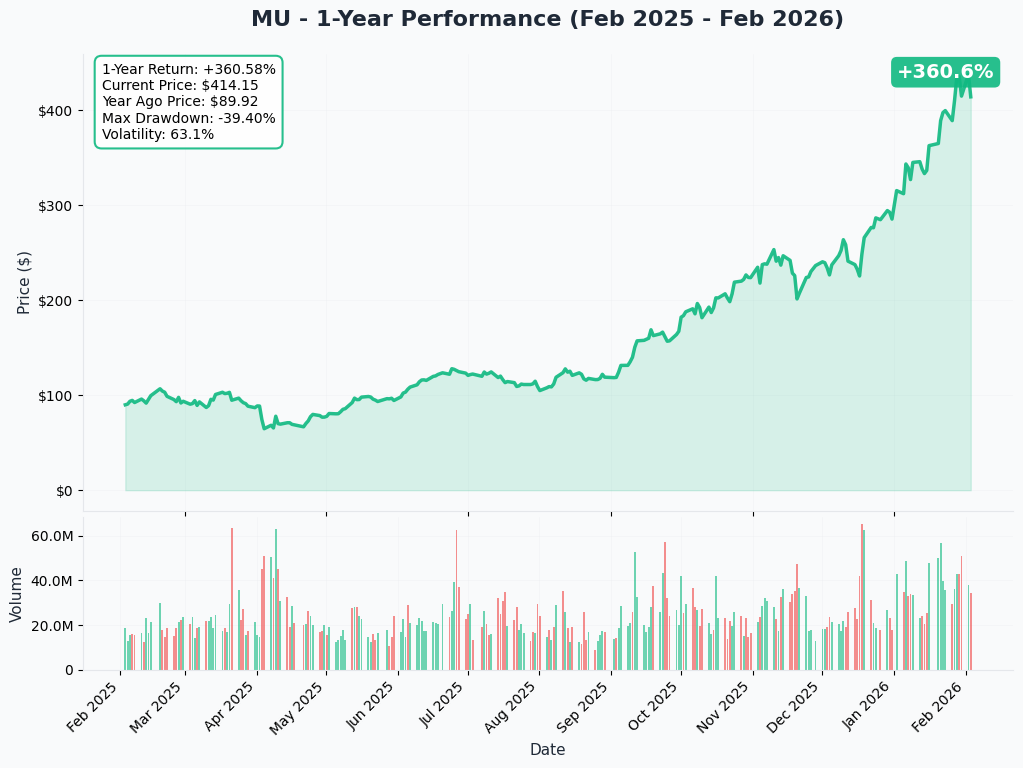
The chart shows MU consolidating after its massive run. We're seeing the classic "exhaustion after euphoria" pattern where the stock needs to digest gains before the next leg up (or down).
🎯 Gamma-Based Support & Resistance Analysis
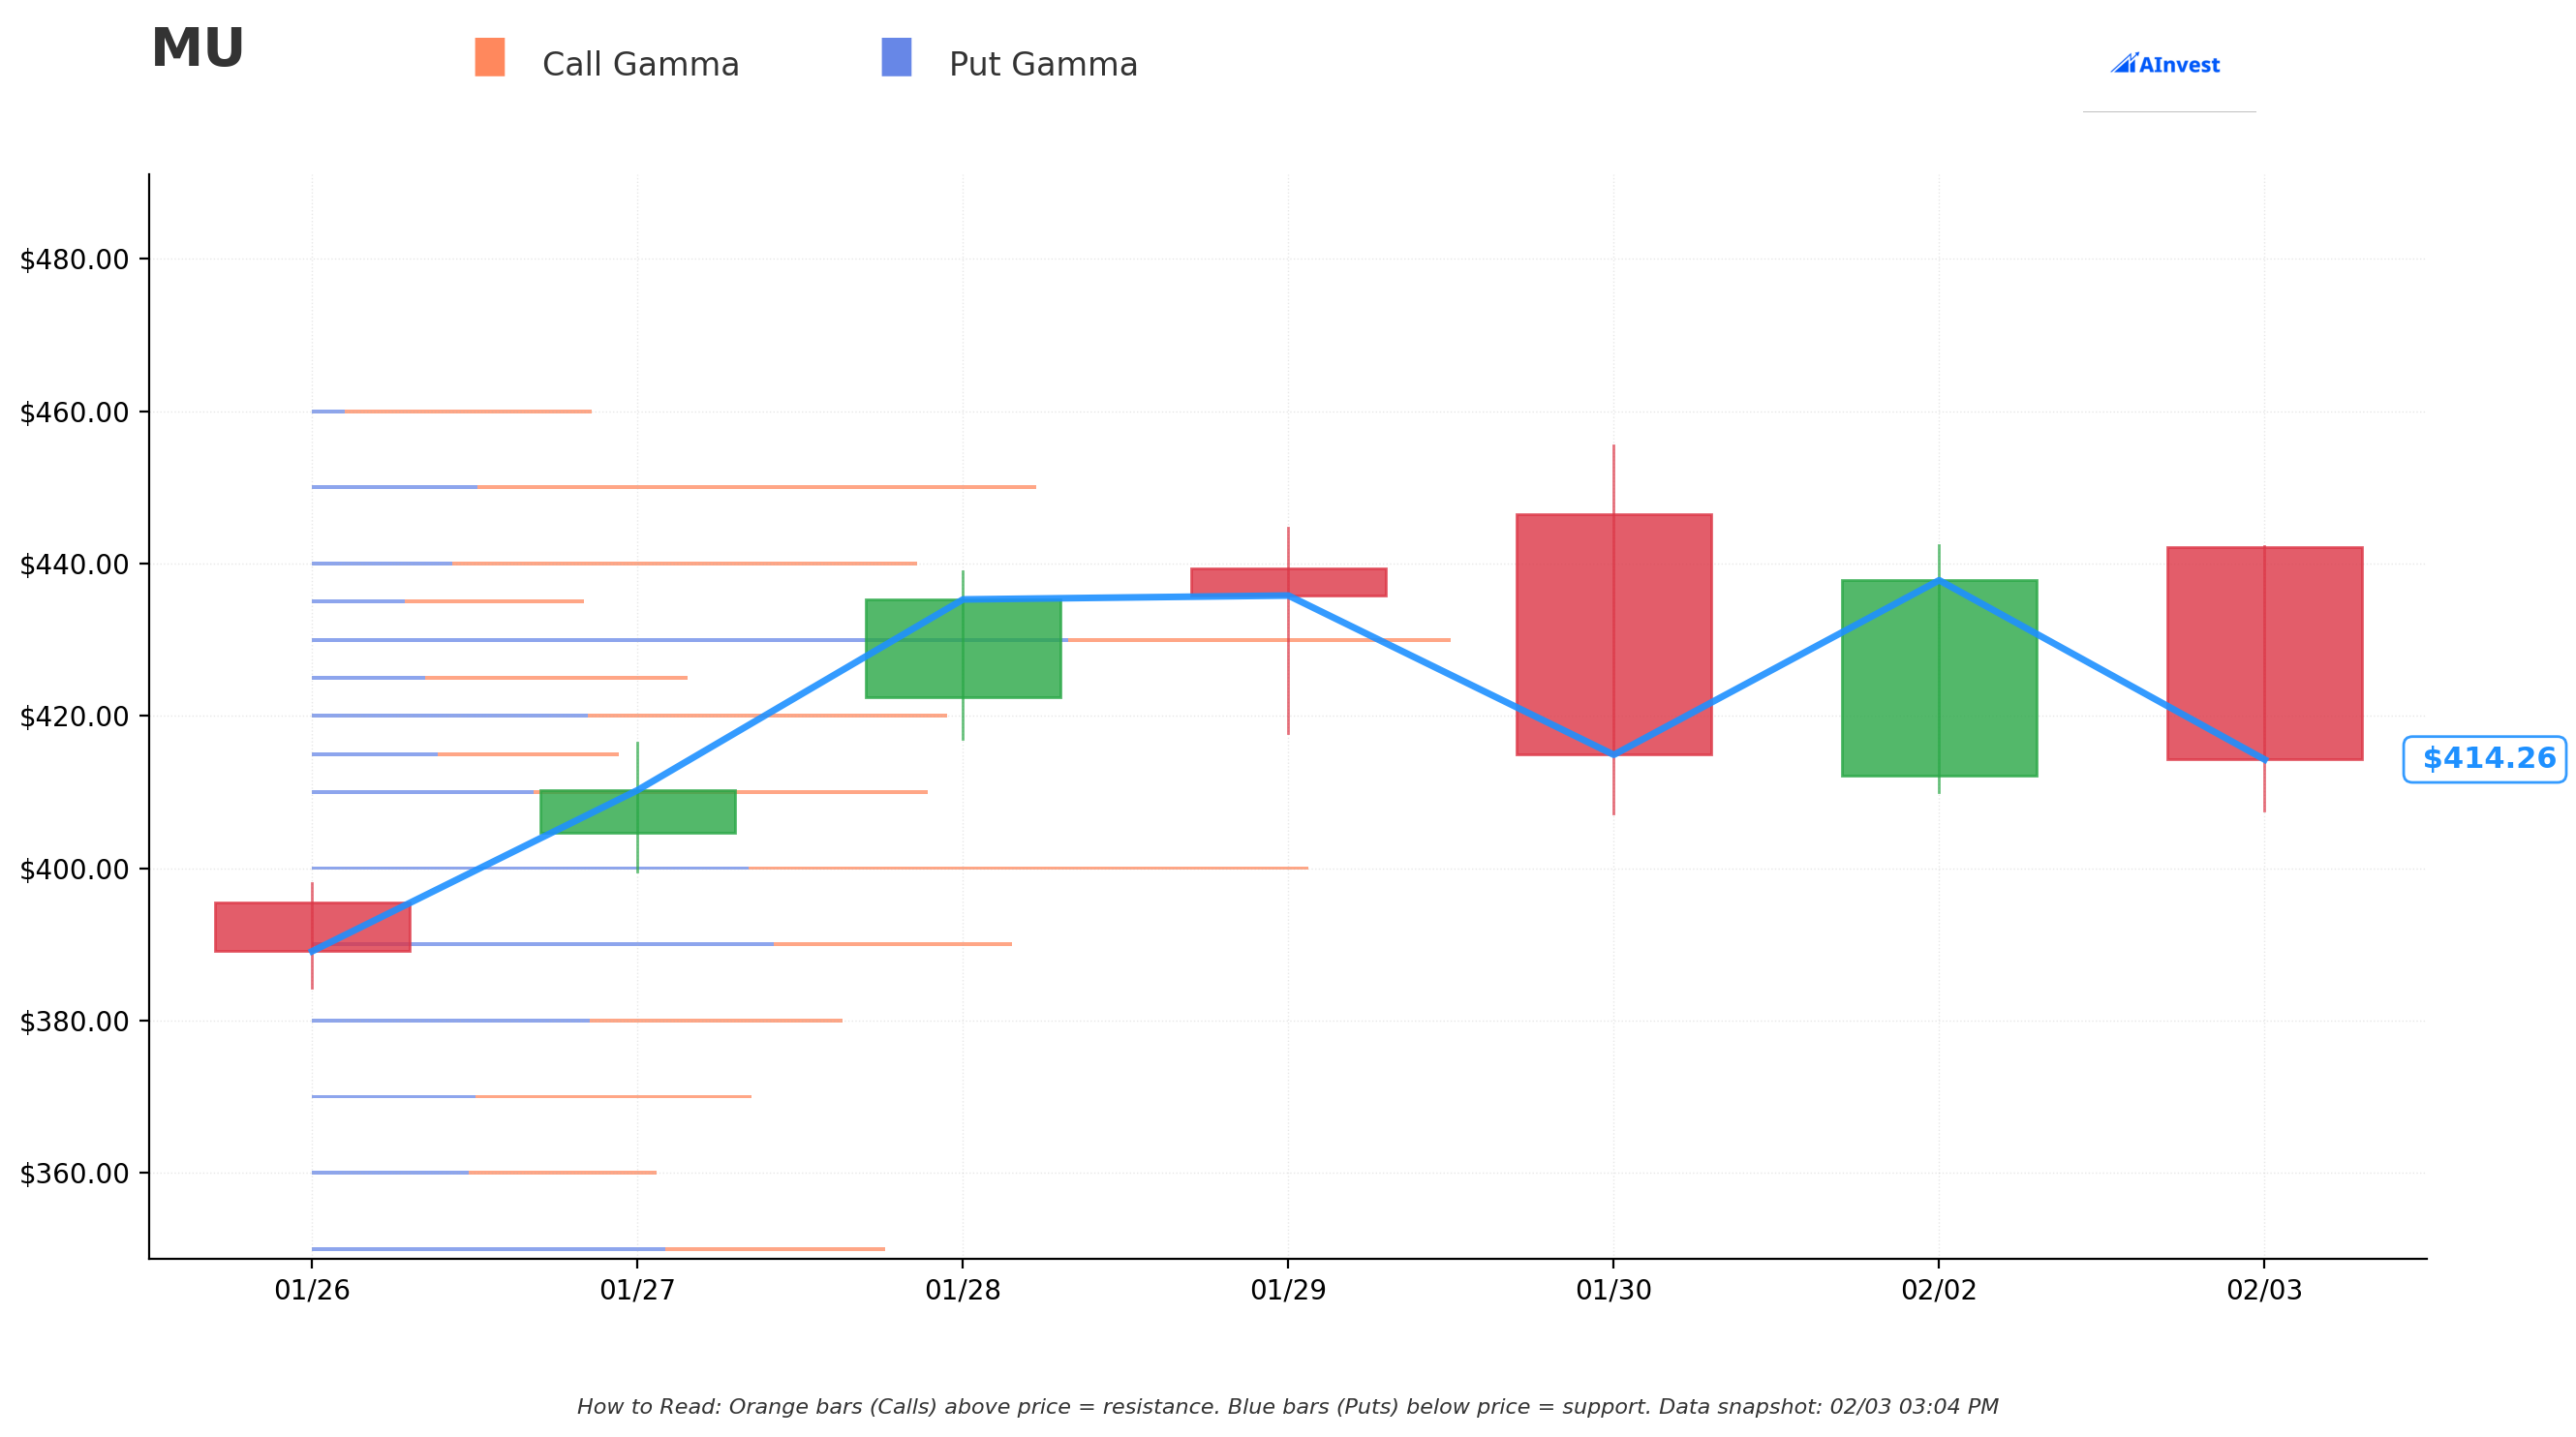
Current Price: $414.50 - Stuck in the middle of a gamma sandwich! 🥪
Key Support Levels (Blue Bars = Put Gamma):
| Strike | Total GEX | Distance | Strength |
|---|---|---|---|
| $410 | $5.4B | 1.1% | Strong |
| $400 | $8.7B | 3.5% | 💪 Major Support Wall |
| $390 | $6.2B | 5.9% | Strong |
Key Resistance Levels (Orange Bars = Call Gamma):
| Strike | Total GEX | Distance | Strength |
|---|---|---|---|
| $420 | $5.6B | 1.3% | Strong |
| $430 | $10.1B | 3.7% | 🧱 MAJOR Resistance Wall |
| $440 | $5.4B | 6.2% | Strong |
| $450 | $6.4B | 8.6% | Strong |
What does this mean in plain English?
MU is caught between the $410 support floor and the $430 resistance ceiling. The $430 level has the highest gamma concentration - market makers have massive positions there, which means price will likely bounce around this zone like a pinball. Breaking above $430 opens the door to $450, but failing here could send us back to test $400.
📊 Implied Move Analysis
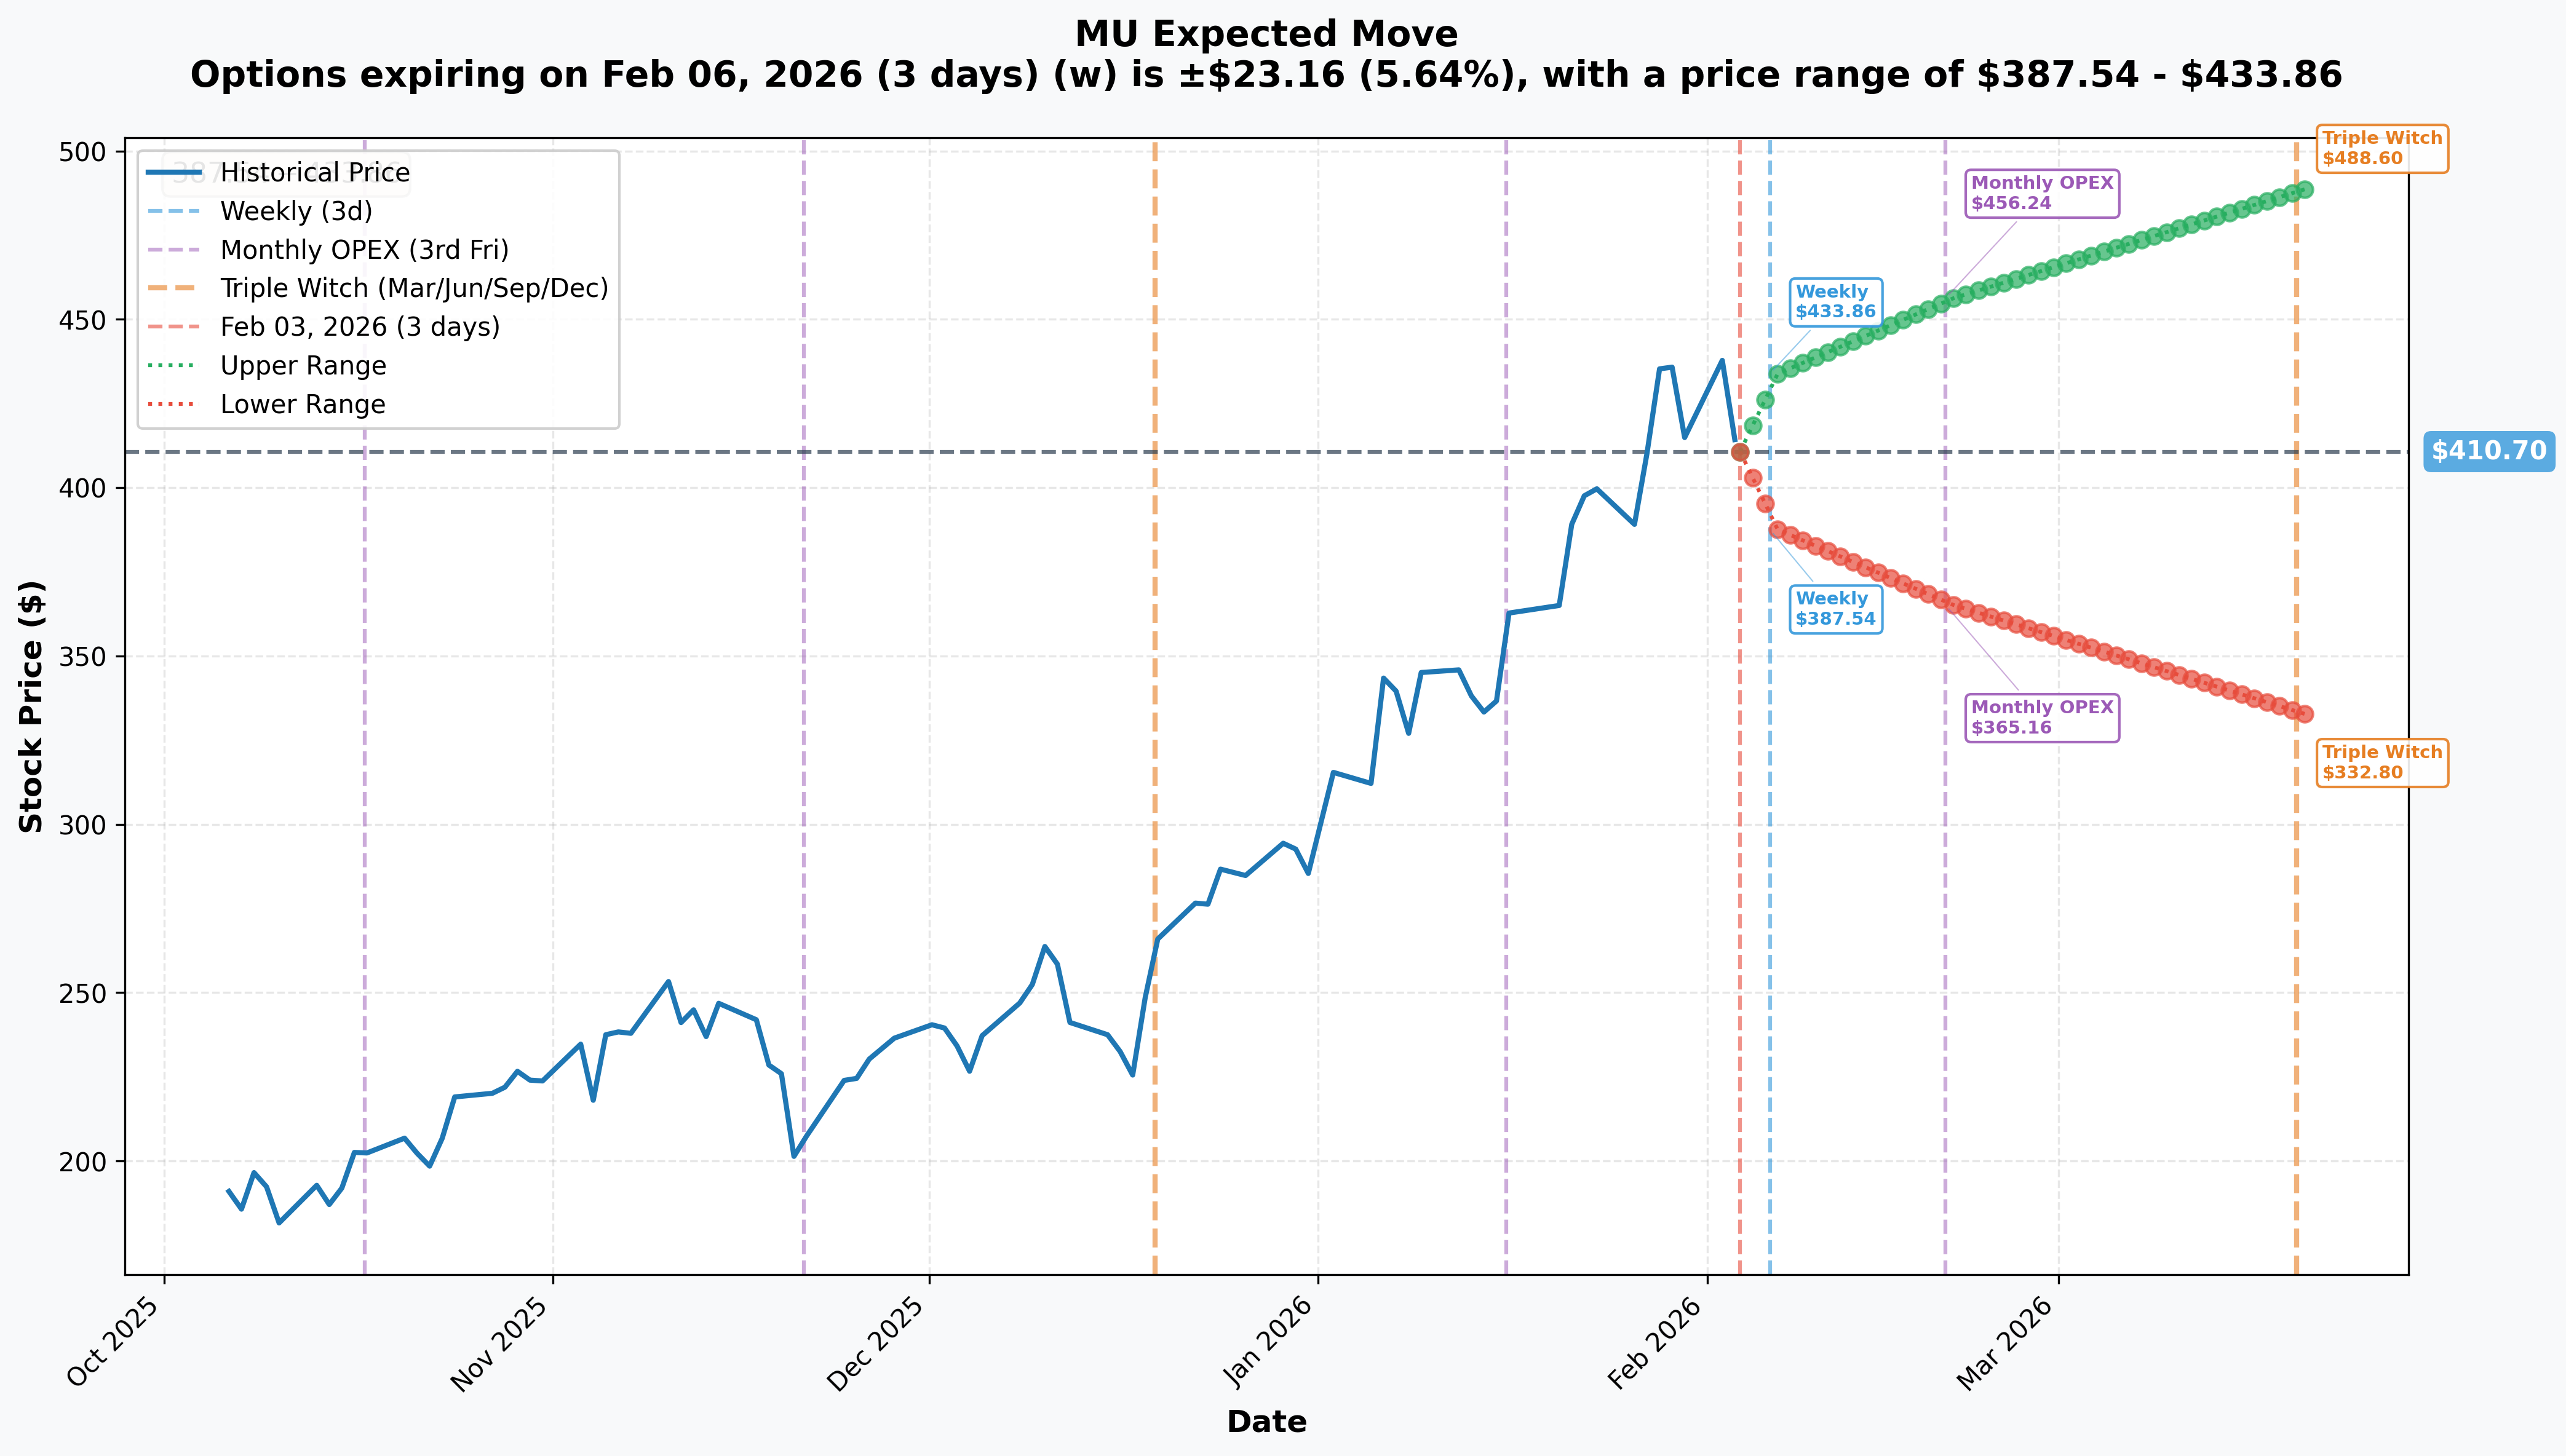
The options market is pricing in significant volatility ahead:
| Timeframe | Expiration | Expected Range | Move % |
|---|---|---|---|
| Weekly | 2026-02-06 | $387.54 - $433.86 | ±5.64% |
| Monthly OPEX | 2026-02-20 | $365.16 - $456.24 | ±11.09% |
| Triple Witch | 2026-03-20 | $332.80 - $488.60 | ±18.97% |
Translation: The market expects MU could swing nearly $46 in either direction by February OPEX. That's a lot of implied volatility - options are expensive right now! 💸
🎪 Catalysts
✅ Recent Catalysts (Already Happened)
| Date | Event | Impact |
|---|---|---|
| Dec 17, 2025 | Q1 FY2026 Earnings | Crushed it! $13.64B revenue (+57% YoY), $4.78 EPS beat by $1.01 |
| Dec 2025 | HBM Sold-Out Confirmation | HBM capacity sold out through CY2026, $8B annualized run-rate |
| June 2025 | CHIPS Act Expansion | $150B domestic investment, $6.4B CHIPS funding secured |
| Q3 2025 | DRAM Market Share Gains | +3.7 percentage points global market share |
📅 Upcoming Catalysts (Mark Your Calendar!)
| Expected Date | Event | Potential Impact |
|---|---|---|
| Late March 2026 | Q2 FY2026 Earnings | Record guidance: $18.7B revenue, 68% gross margins, $8.42 EPS 🎯 |
| Q2-Q3 2026 | HBM4 Mass Production Ramp | First-mover advantage vs SK Hynix and Samsung |
| CY 2026 | Memory Price Increases | DRAM prices +88-110% QoQ per TrendForce |
| 2027 | Idaho DRAM Production Start | New fab capacity coming online |
🎲 Price Targets & Probabilities
Based on the gamma levels, implied moves, and the $26M LEAP positioning, here's how I see the odds:
🐻 Bear Case: $365-$390
Probability: 25%
- Memory cycle peaks in late 2026 (per semiconductor memory cycle historical patterns)
- Samsung's HBM4 comeback triggers pricing pressure
- Hyperscaler CapEx pullback accelerates downturn
- Stock trades down to $390 support, possibly lower to $365 monthly OPEX floor
- The LEAP roll seller profits handsomely
⚖️ Base Case: $400-$450
Probability: 50%
- MU consolidates between major gamma walls
- Q2 earnings meet elevated expectations but don't surprise
- Stock oscillates in the $400-$450 range through H1 2026
- HBM supercycle continues but growth rate moderates
- The LEAP roll seller keeps most of their premium
🚀 Bull Case: $488-$550
Probability: 20%
- AI demand extends supercycle beyond expectations
- Memory shortage persists through 2027
- MU breaks $430 resistance and runs to $488 (triple witch upper bound)
- Could approach $550 strike by Jan 2027 if everything goes right
- The LEAP roll seller faces assignment pressure
🎰 Moonshot Case: >$550
Probability: 5%
- Agentic AI creates unprecedented HBM demand
- Industry consolidation (unlikely but possible)
- Stock exceeds $550 strike - LEAP seller loses upside
- Reaching >$550 would require significant expansion in use cases beyond current AI infrastructure buildout
💡 Trading Ideas
🛡️ Conservative: "The Income Harvester"
Strategy: Sell Feb 2026 $450 Covered Call (if you own shares)
- Risk Level: Low
- Setup: Own 100 shares of MU, sell the 2026-02-20 $450 call
- Premium: ~$8-10 per contract ($800-1,000)
- Max Gain: Stock appreciation to $450 + premium collected
- Why This Works: Mimics institutional positioning - collect premium at elevated IV while capping upside at 8.6% above current price. If MU stays below $450 by Feb OPEX, keep the premium and repeat.
⚖️ Balanced: "The Range Rider"
Strategy: Iron Condor on March 2026 Expiration
- Risk Level: Medium
- Setup:
- Sell $390 Put / Buy $380 Put
- Sell $450 Call / Buy $460 Call
- Max Profit: Net credit received (~$4-5 per spread)
- Max Loss: $10 spread width minus credit
- Why This Works: Gamma walls suggest MU stays range-bound between $390-$450. Collect premium while implied volatility is elevated. March triple witch gives you time for the thesis to play out.
🚀 Aggressive: "Fade the Whale"
Strategy: Long March 2026 $430/$460 Call Debit Spread
- Risk Level: High
- Setup: Buy $430 Call, Sell $460 Call (March 2026)
- Cost: ~$8-10 per spread
- Max Gain: $30 spread width minus cost = ~$20-22 per spread
- Why This Works: If you disagree with the LEAP seller and think the HBM supercycle has legs, this gives you leveraged upside exposure to a breakout above $430 resistance. Q2 earnings catalyst could trigger a move to $450+.
⚠️ Risk Factors
🔴 Peak Cycle Risk (HIGH)
The memory industry is notoriously cyclical. Historical precedent (2018) shows memory peaks can be followed by 50% price collapses. Semiconductor analysts widely expect industry moderation by 2027 after the AI supercycle peaks. The $26M LEAP seller is clearly betting on this cyclicality.
🟠 Valuation Stretched (MEDIUM-HIGH)
MU's trailing P/E of 34.19 is 2.5x its 20-year average of 13.44, according to GuruFocus. At $437, the stock trades above most analyst price targets (avg: $319.79). A lot of optimism is already priced in.
🟡 Samsung Comeback (MEDIUM)
Samsung is aggressively pursuing HBM4 market share recovery with >30% market share targets. Their pricing and capacity expansion could trigger oversupply and margin compression for everyone in the HBM space.
🟡 Customer Concentration (MEDIUM)
After exiting consumer memory, MU depends heavily on data center customers. A hyperscaler CapEx pullback (Amazon, Microsoft, Google) could trigger rapid demand destruction.
🟢 Execution Risk (LOW-MEDIUM)
Q2 guidance of $18.7B revenue and 68% gross margins is VERY aggressive. Any miss could trigger a significant pullback given current valuations.
🎯 The Bottom Line
Real talk: This $26M LEAP roll is a major institutional player saying "I've made my money on MU's rally, now I'm capping my upside and collecting premium." They're not necessarily bearish - they likely still own shares - but they're clearly not expecting MU to blow through $550 by January 2027.
Here's the deal:
📈 If you're bullish: MU has legitimate tailwinds - HBM sold out through 2026, record margins, AI demand explosion. But consider the LEAP seller's positioning. Maybe buy pullbacks to $400-$410 gamma support rather than chasing here. Use defined-risk strategies like call spreads rather than naked long calls.
👀 If you're watching: Wait for the Q2 earnings report in late March. If they beat and raise again, the supercycle thesis strengthens. If they guide down or margins compress, the LEAP seller was right. The $430 resistance level is your key - a clean break above confirms bulls remain in control.
🐻 If you're bearish: The LEAP roll is your tell. Consider put spreads for March/April expiration targeting the $390-$400 support zone. But respect the gamma walls - don't fight the $410 support without a catalyst.
Mark your calendar: Q2 FY2026 earnings (late March 2026) is the next major catalyst. That report will tell us if the supercycle extends or if we're at peak memory.
The LEAP roll tells a story: At nearly $500B market cap, MU would need to reach ~$605B to hit that $550 strike. Possible? Sure. Probable by Jan 2027 if the cycle is peaking? The institutions placing this trade don't think so. 👀
Disclaimer: This analysis is for educational purposes only. Options involve significant risk and are not suitable for all investors. Always do your own research and consider your risk tolerance before trading. Past performance does not guarantee future results.
📊 Data Sources:
- Option flow data from proprietary tape analysis
- Gamma exposure data from GEX calculations
- Catalyst research from Micron Investor Relations, TrendForce, MarketBeat
- Company data from Polygon.io
🔗 Quick Links: