🧠 MU $12M Put Bet - Whale Hedging the AI Memory King at All-Time Highs!
📅 February 5, 2026 | 🔥 Unusual Activity Detected
🎯 The Quick Take
Someone just dropped $12 MILLION on MU puts this morning at 09:55:46! This massive trade bought 11,000 contracts of the $350 strike puts expiring March 20th - positioning for significant downside protection while Micron trades at $384.20 after an incredible +123.82% YTD rally driven by insatiable AI demand for high-bandwidth memory (HBM). With Q2 FY2026 earnings on March 25th expected to deliver record $18.7B revenue and $8.42 EPS, smart money is buying insurance before the next big catalyst. Translation: Institutional investors aren't selling the dream - they're just protecting a monster position heading into earnings!
📊 Company Overview
Micron Technology (MU) is one of the largest semiconductor companies in the world, specializing in memory and storage chips that power everything from AI data centers to your smartphone:
- Market Cap: $427.0 Billion (24th most valuable company globally)
- Industry: Semiconductors & Related Devices
- Current Price: $384.20 (near all-time highs)
- Employees: 53,000 globally
- Headquarters: Boise, Idaho
- Primary Business: DRAM (79% of revenue), NAND flash (20%), serving data centers, mobile devices, consumer electronics, and automotive sectors
- Key Differentiator: HBM (High-Bandwidth Memory) production sold out through calendar 2026, with technology leadership in HBM4
💰 The Option Flow Breakdown
The Tape (February 5, 2026 @ 09:55:46):
| Time | Symbol | Buy/Sell | Call/Put | Expiration | Premium | Strike | Volume | OI | Size | Spot | Option Price |
|---|---|---|---|---|---|---|---|---|---|---|---|
| 09:55:46 | MU | BUY | PUT | 2026-03-20 | $12,000,000 | $350 | 11,000 | 4,000 | 4,638 | $384.20 | $25.00 |
🤓 What This Actually Means
This is a defensive hedge protecting a massive long position! Here's what went down:
- 💸 Huge premium paid: $12M ($25.00 per contract x 4,638 contracts traded at this size level)
- 🛡️ Protection strike: $350 provides 8.9% downside cushion below current price
- ⏰ Strategic timing: 43 days to expiration captures Q2 FY2026 earnings on March 25th (5 days before expiration!)
- 📊 Size matters: 11,000 contracts total volume represents 1.1 million shares worth ~$422M of underlying exposure
- 🏦 Institutional insurance: This is sophisticated portfolio hedging ahead of a binary earnings event, not a bearish bet
What's really happening here:
This trader likely holds a MASSIVE long position in MU accumulated during the explosive rally from $171 to $384 (+124% YTD). Now, with the stock near all-time highs and the most important earnings report of the year just 48 days away, they're paying $25 per share for the March 20 $350 puts as insurance. If MU drops below $350 by Triple Witch expiration, these puts pay off dollar-for-dollar. Think of it like buying a $12M homeowner's policy when you live in a mansion worth hundreds of millions.
Option Strategy Detection: This trade was classified as a Long Put (standalone position) - a straightforward directional hedge or bearish bet, not part of a spread or complex multi-leg structure.
Unusual Score: 🔥 EXTREME (Z-Score: 14.22 - EXTREMELY UNUSUAL) - This happens maybe a few times a year! The volume-to-OI ratio of 2.75x signals high activity relative to existing positions, and the BTO (Buy-to-Open) classification with medium confidence confirms new position building. No similar trades detected in the lookback period makes this a standout institutional move.
📈 Technical Setup / Chart Check-Up
YTD Performance Chart
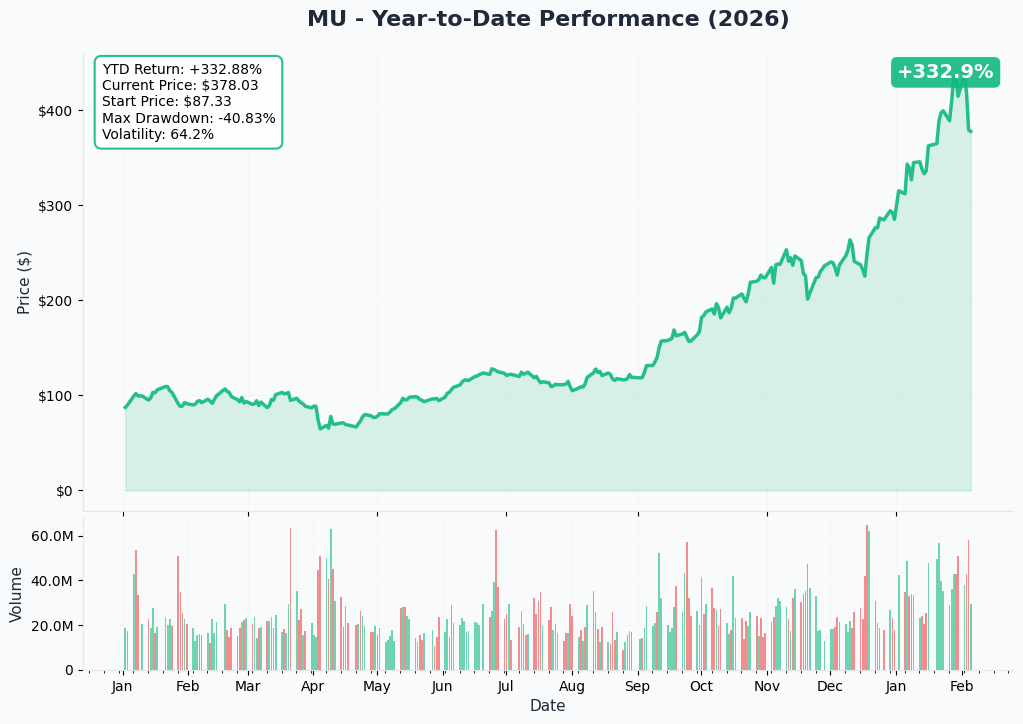
MU is absolutely CRUSHING it - up +123.82% YTD with current price around $384 (started the year at $171.74). This is one of the most explosive rallies in mega-cap semiconductor history. The chart tells an insatiable AI memory demand story:
Key observations:
- 🚀 Parabolic rally: Vertical move driven by HBM demand that's sold out through 2026
- 📈 Breakout confirmed: Smashed through prior resistance levels, now trading at all-time highs
- 🎢 High volatility: Stock has shown 80% moves over 3 months - this isn't your grandma's memory stock
- 📊 Volume explosion: Massive institutional accumulation as AI catalysts materialize
- ⚠️ Extended territory: After 303% gains over six months, technical pullback risk is elevated
Gamma-Based Support & Resistance Analysis
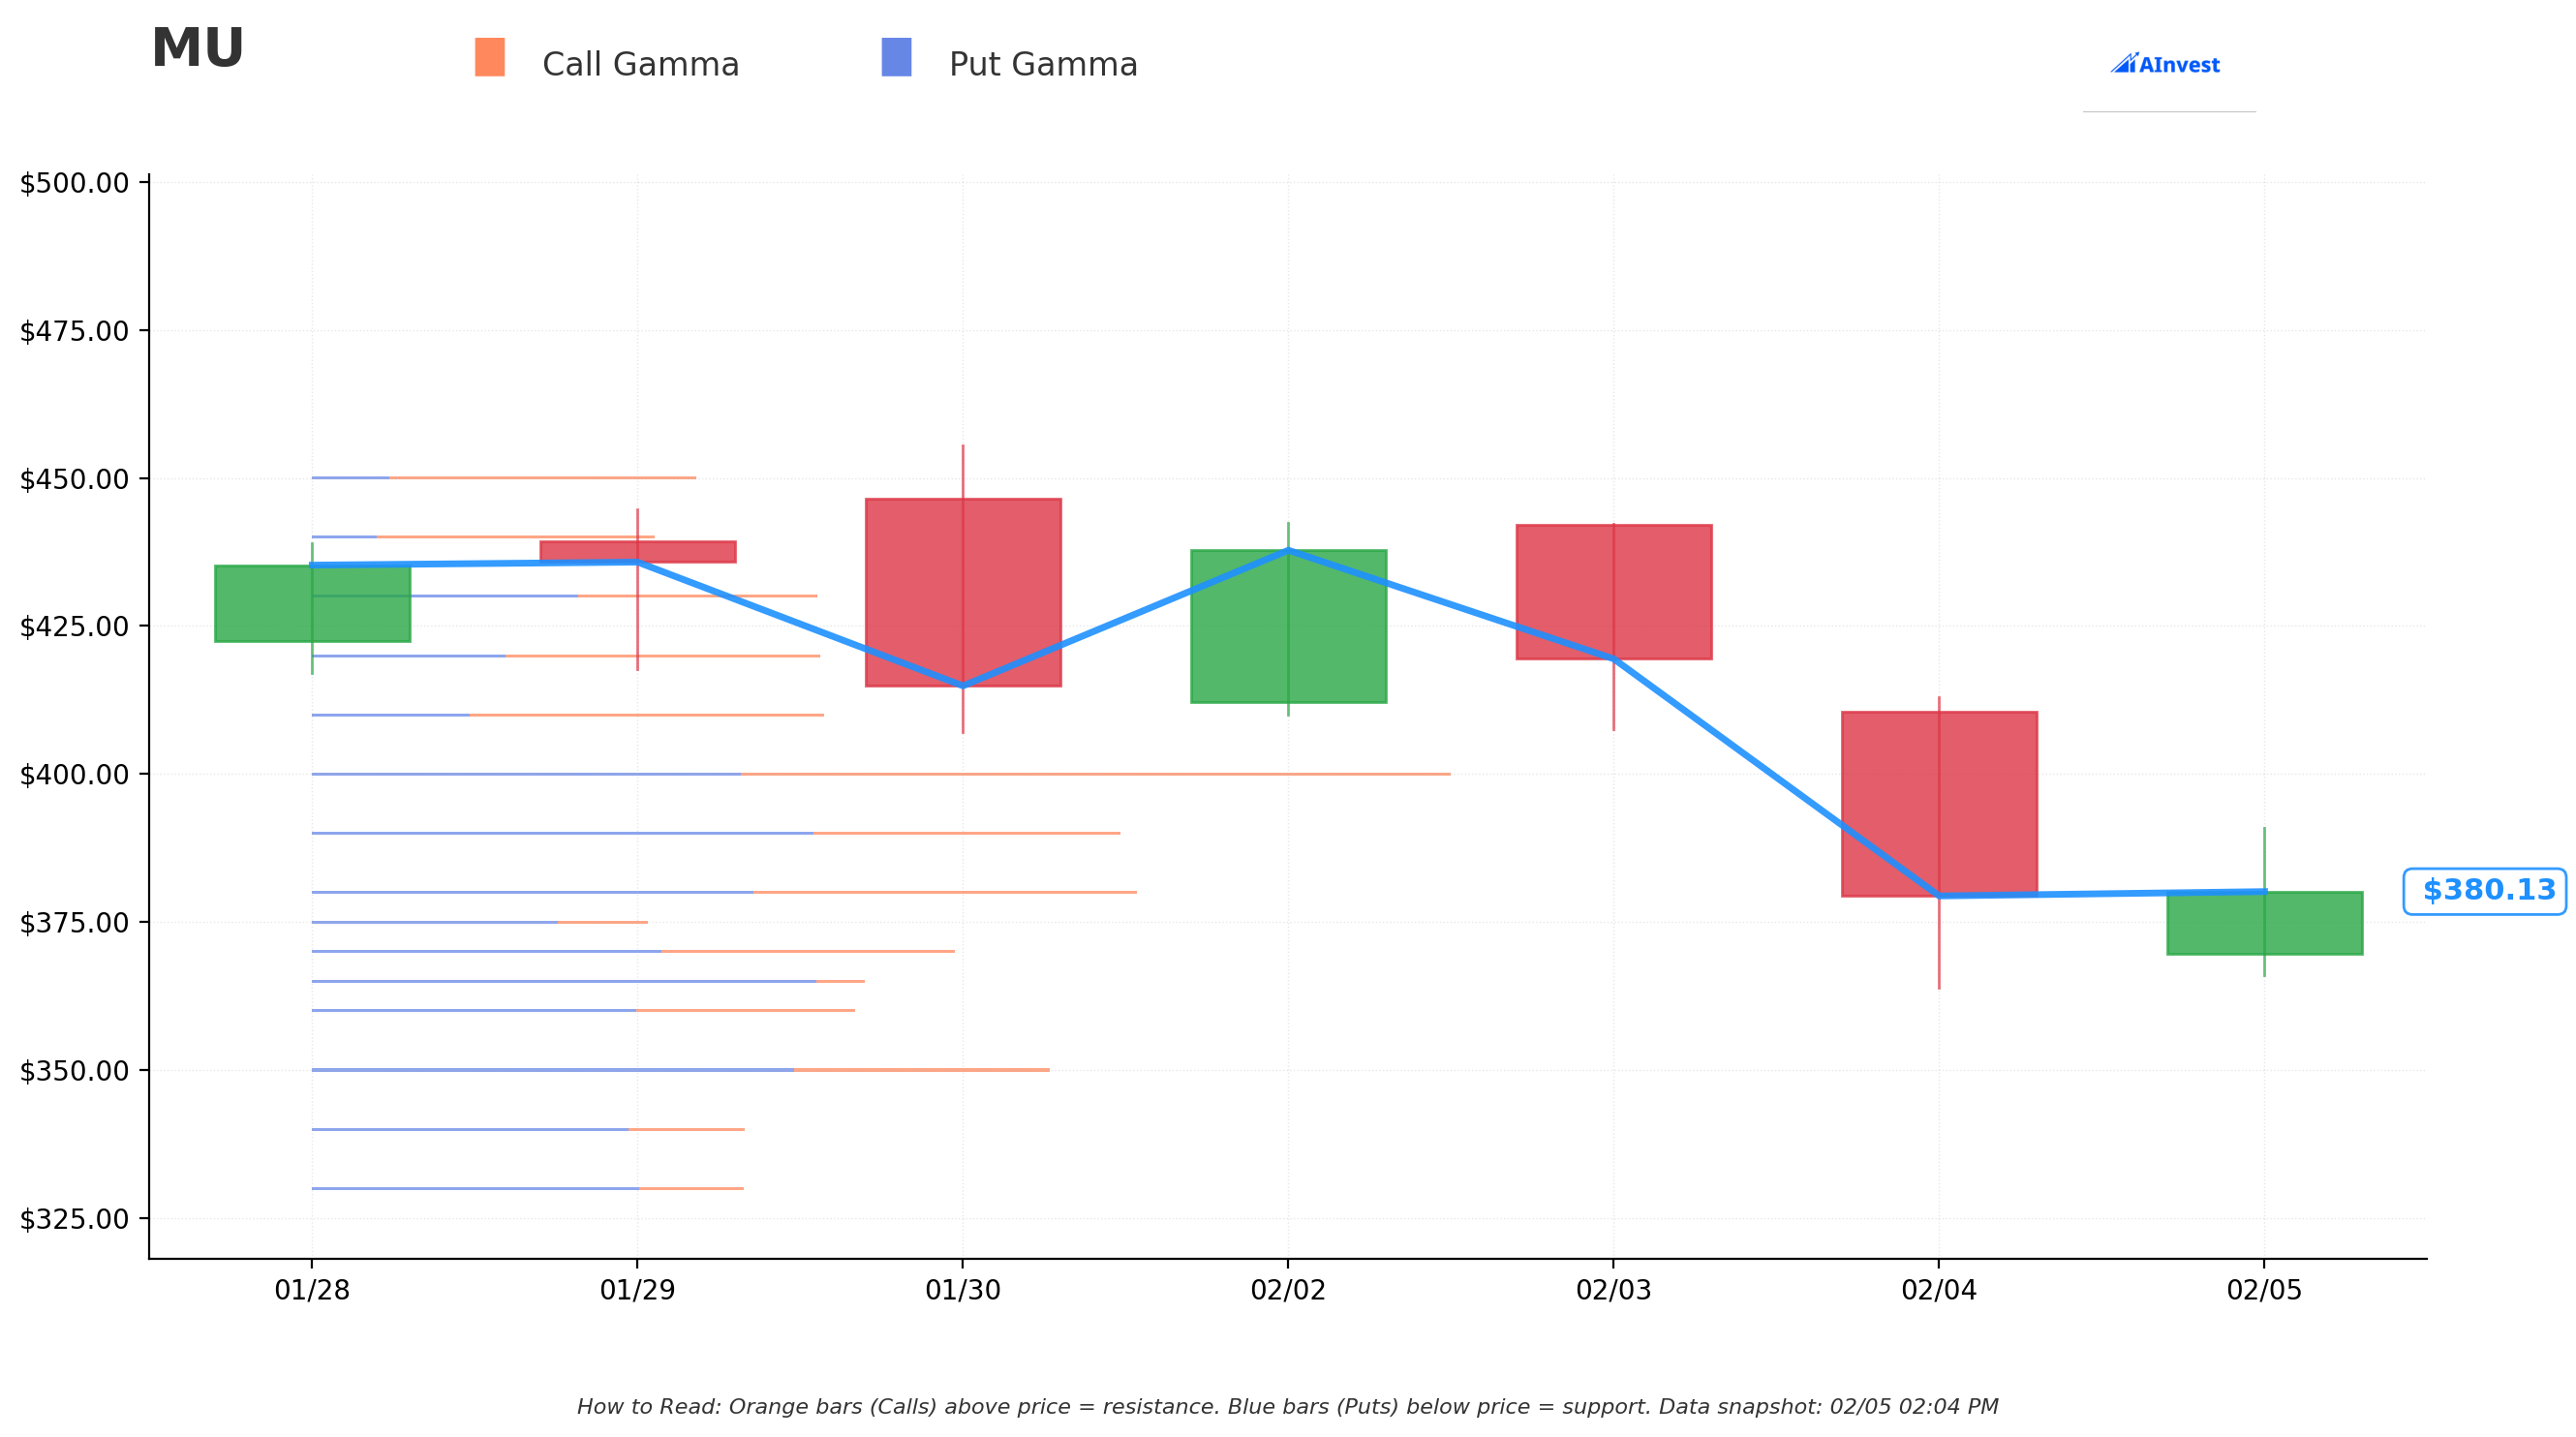
Current Price: $380.32
The gamma exposure map reveals critical price magnets and barriers that will govern near-term price action:
🔵 Support Levels (Put Gamma Below Price):
- $380 - Immediate support with 9.1B total gamma exposure (strongest nearby floor!)
- $370 - Secondary support at 7.1B gamma (dealers will buy dips aggressively here)
- $365 - Deep support with 6.2B gamma and massive put gamma wall (-5.1B net GEX)
- $360 - Structural floor at 6.0B gamma
- $350 - Major support at 8.2B gamma (exactly where this put trade is struck! Not coincidental)
🟠 Resistance Levels (Call Gamma Above Price):
- $390 - Immediate ceiling with 8.9B gamma (2.5% overhead)
- $400 - Major resistance at 12.4B gamma (STRONGEST LEVEL - massive call gamma wall)
- $410 - Secondary resistance at 5.5B gamma
- $420 - Extended upside at 5.4B gamma
- $430 - Further resistance at 4.8B gamma
What this means for traders:
MU is trading just above major $380 support with significant overhead resistance at $390-$400. The gamma data shows market makers holding enormous positions at $400 (12.4B - the single largest level) which creates natural selling pressure as price approaches. This setup suggests "consolidation range" behavior between $370-$400 before the next big move.
Notice anything? The put buyer struck EXACTLY at $350 where there's 8.2B gamma support. They're positioning below the major $365 and $360 support levels, expecting that if MU cracks through those levels, it could flush quickly to $350. Smart hedging aligned with market structure.
Net GEX Bias: Bearish (82.97B call gamma vs 89.63B put gamma) - Overall positioning slightly favors downside, supporting the protective put thesis.
Implied Move Analysis
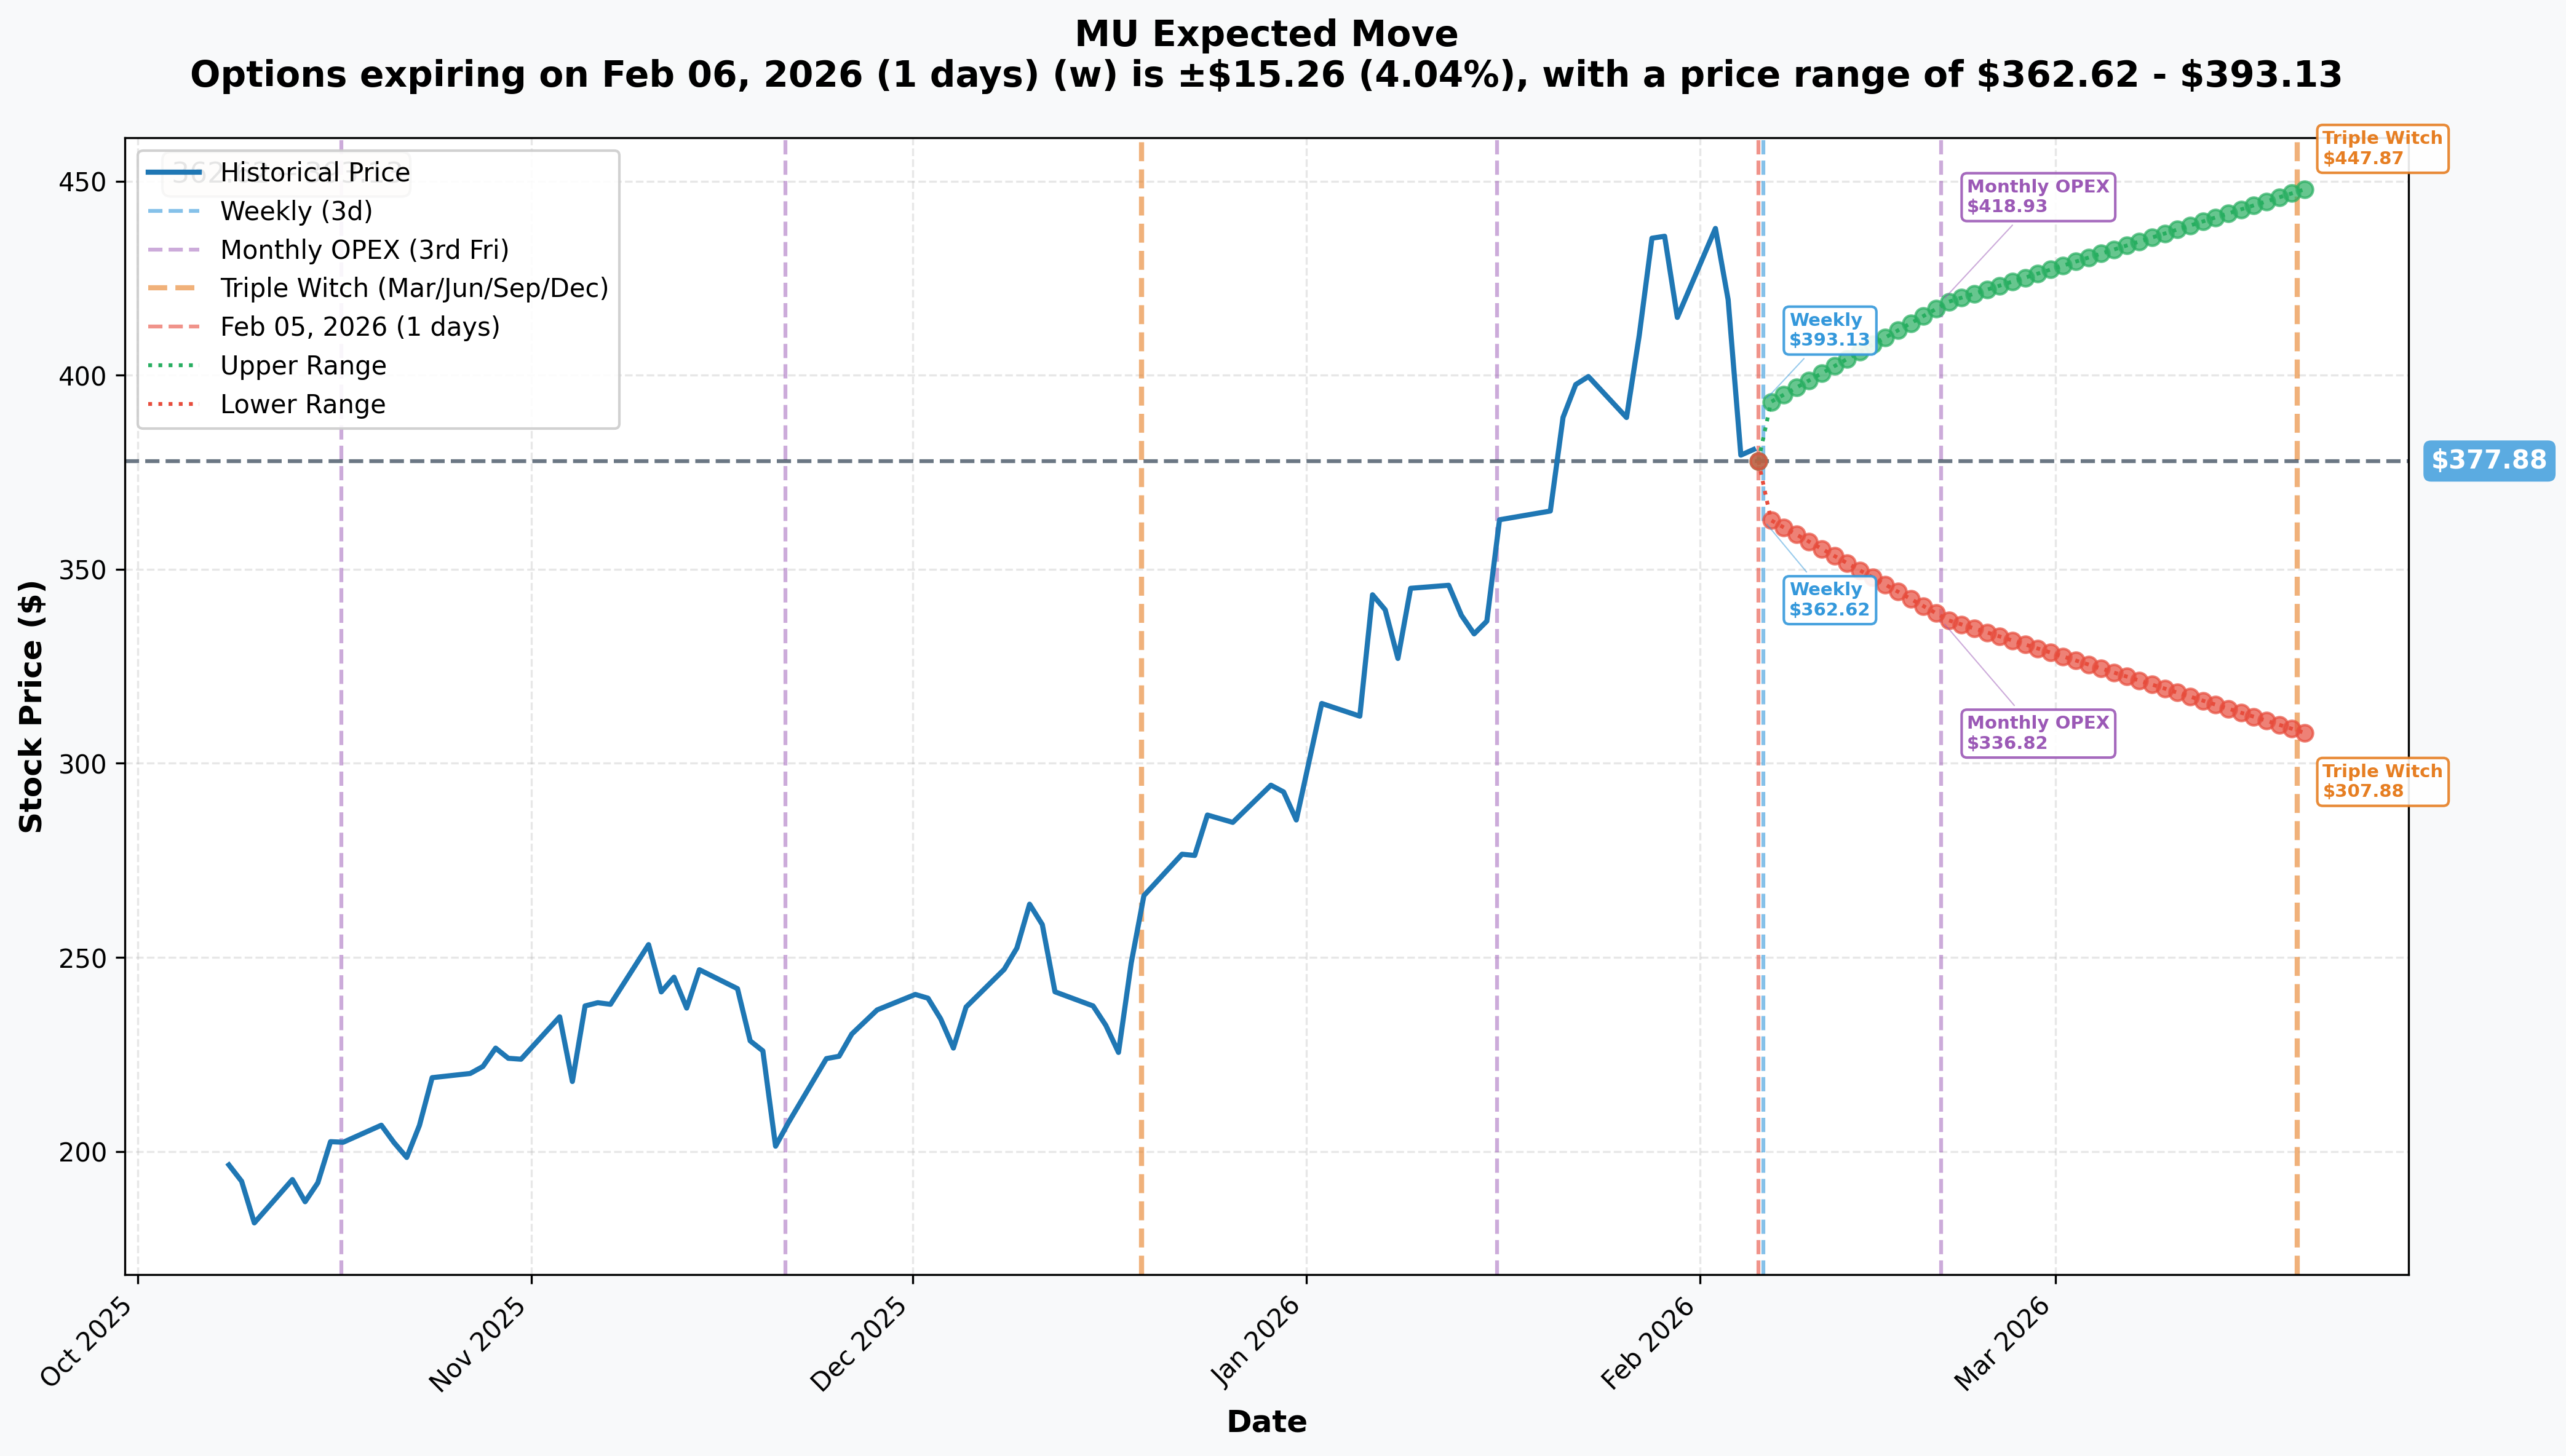
Options market pricing for upcoming expirations:
- 📅 Weekly (Feb 6 - 1 day): +/-$15.26 (+/-4.04%) → Range: $362.62 - $393.13
- 📅 Monthly OPEX (Feb 20 - 15 days): +/-$41.05 (+/-10.86%) → Range: $336.82 - $418.93
- 📅 Triple Witch (Mar 20 - 43 days - THIS TRADE!): +/-$70.00 (+/-18.52%) → Range: $307.88 - $447.87
Translation for regular folks:
Options traders are pricing in a 4% move ($15) by tomorrow for weekly expiration, but a MASSIVE 18.5% move ($70) through the March Triple Witch which expires just 5 days BEFORE earnings on March 25th. The market expects FIREWORKS around the earnings window - that's a huge implied move for a $427B mega-cap stock!
The March 20th expiration (when this $12M trade expires) has a lower range of $307.88 - meaning the market thinks there's a real possibility MU could trade below $310 over the next 43 days. This aligns with the put buyer's thesis: protect against an 8-15% drawdown if momentum stalls or earnings expectations get too frothy before the actual report.
Key insight: The sharp increase in implied volatility from 4% (weekly) to 18.5% (Triple Witch) reflects massive earnings anticipation and quarter-end positioning uncertainty. Smart money is paying up for protection into this binary event window.
🎪 Catalysts
🔥 Upcoming Catalysts (Next 60 Days)
Q2 FY2026 Earnings - March 25, 2026 (After Market) 📊
MU reports fiscal Q2 results on Wednesday, March 25, 2026 after market close. This is THE catalyst that will validate or challenge the incredible rally. According to MarketBeat's earnings forecast, consensus expectations are:
| Metric | Company Guidance | Analyst Consensus |
|---|---|---|
| Revenue | $18.7B +/- $400M (record) | $18.80B |
| Gross Margin | 68% +/- 100bps | -- |
| Operating Expenses | $1.38B +/- $20M | -- |
| Non-GAAP EPS | $8.42 +/- $0.20 (record) | $8.43 |
Key Metrics to Watch:
- 🤖 HBM revenue contribution and mix (currently ~$8B annualized run-rate expected)
- 💾 DRAM/NAND pricing trends and ASP changes
- 📈 Gross margin expansion trajectory (already at 47%, guiding 68%!)
- 📊 Updated FY2026 guidance and HBM TAM outlook
HBM4 Production Ramp (H2 2026)
According to IO Fund's analysis, Micron began shipping HBM4 samples in January 2026 with full-scale production aligned for H2 2026:
- 🚀 HBM4 specifications: 2048-bit interface, >2.0 TB/s per stack
- 💪 60%+ performance improvement over previous generation
- 🎯 Targeting next-generation AI platforms
- 📊 All 2026 HBM price and volume agreements already finalized
New York Megafab Construction Progress (Throughout 2026)
Per Governor Hochul's announcement, the January 16, 2026 groundbreaking marked the start of Micron's $100 billion total investment:
- 🏭 Official groundbreaking at Onondaga County site
- 💰 Expected to create 50,000 direct and indirect jobs
- 📊 Part of broader $150B U.S. manufacturing expansion
- 🇺🇸 Supported by CHIPS Act awards up to $6.4 billion
✅ Recent Catalysts (Already Happened)
Q1 FY2026 Record Results (December 17, 2025)
According to Micron Investor Relations, Micron delivered blockbuster results:
| Metric | Q1 FY2026 | YoY Change |
|---|---|---|
| Revenue | $13.6B (record) | +57% |
| Non-GAAP EPS | $4.78 | +167% |
| Operating Margin | 47% | +20pp |
| Free Cash Flow | $3.9B (record) | -- |
Segment Performance:
- 💾 DRAM Revenue: $10.8B (record), +69% YoY, 79% of total revenue
- 🗄️ NAND Revenue: $2.7B (record), +22% YoY, 20% of total revenue
PSMC Taiwan Acquisition (January 17, 2026)
Per Micron's newsroom:
- 💰 Signed $1.8 billion Letter of Intent to acquire PSMC's Tongluo Site in Taiwan
- 🏭 300,000-square-foot 300mm fab cleanroom acquisition
- 📅 Expected to contribute meaningful DRAM wafer output beginning H2 2027
Crucial Consumer Business Exit (December 3, 2025)
According to Micron Investor Relations:
- 🚪 Exiting Crucial consumer brand after 29 years
- 🎯 Strategic pivot to prioritize enterprise, data center, and AI infrastructure customers
- 💡 Reflects management conviction that AI demand requires full capacity allocation
HBM4 Shipments Commenced (January 2026)
- 🚀 Began shipping HBM4 samples to key customers
- 🎯 Targeting next-generation AI platforms from major hyperscalers
🎲 Price Targets & Probabilities
Using gamma levels, implied move data, and upcoming catalysts, here are the scenarios through March 20th expiration:
📈 Bull Case (30% probability)
Target: $420-$450
How we get there:
- 💪 Pre-earnings momentum continues as analysts raise Q2 estimates toward high-end guidance
- 🚀 HBM4 customer adoption announcements (major hyperscaler deployments confirmed)
- 📊 DRAM/NAND pricing rises 20-25% QoQ as TrendForce forecasts
- 🌐 Market share gains accelerate vs Samsung's HBM recovery struggles
- 📈 Breakout above $400 gamma resistance triggers technical rally toward $447 implied move upper range
- 🤖 AI capex cycle continues unabated with hyperscaler orders expanding
Probability assessment: 30% because it requires sustained bullish momentum through a period of elevated valuations (57x P/E). Gamma resistance at $400 creates natural selling pressure, but the fundamental story remains incredibly strong.
🎯 Base Case (45% probability)
Target: $350-$400 range (CONSOLIDATION)
Most likely scenario:
- ✅ Stock consolidates gains ahead of March 25th earnings
- 📊 Traders take profits after 124% YTD gain, creating natural pullback toward $370-$380
- ⚖️ Market digests massive rally, waits for earnings confirmation
- 🔄 Trading within gamma support ($350-$380) and resistance ($390-$400) bands
- 💤 Elevated IV keeps options expensive, limiting new directional bets
- 📈 Post-expiration, stock rallies into earnings if guidance remains strong
This is the put buyer's sweet spot: Stock consolidates in $350-$400 range, puts provide portfolio insurance during volatile pre-earnings period, and if stock holds $350+ the insurance simply expires as planned cost of risk management.
Why 45% probability: Stock at technical inflection point after massive rally. Fundamentals exceptional but valuation stretched. Most institutional players will hold and wait for earnings confirmation.
📉 Bear Case (25% probability)
Target: $300-$350 (TEST THE PUT STRIKE!)
What could go wrong:
- 😰 Pre-earnings jitters create "sell the news ahead of the news" dynamic
- 🚨 HBM4 yield issues or production delays surface
- ⏰ Samsung's HBM4 recovery accelerates faster than expected, triggering competitive concerns
- 🇨🇳 China trade restrictions escalate beyond current status
- 💸 Broader tech selloff drags semis lower (Nvidia weakness, macro recession fears)
- 📉 Insider selling concerns noted by Timothy Sykes create sentiment headwinds
- 🔨 Break below $365 gamma support triggers cascade to $350, then $330
Critical support levels:
- 🛡️ $380: Immediate gamma support - first line of defense
- 🛡️ $370: Secondary support with 7.1B gamma
- 🛡️ $365: Deep support with major put gamma wall
- 🛡️ $350: THIS PUT STRIKE - major support at 8.2B gamma
Probability assessment: 25% because it requires multiple negative catalysts to align. Micron's fundamentals remain exceptional (HBM sold out, record margins, CHIPS Act funding), but execution risk at peak-cycle valuations and insider selling create downside scenarios.
Put P&L in Bear Case:
- Stock at $330 on Mar 20: Puts worth $20.00, profit = -$5/share loss (paid $25, worth $20)
- Stock at $300 on Mar 20: Puts worth $50.00, profit = $25/share gain (100% ROI!)
- Stock at $350 on Mar 20: Puts worth $0 (at-the-money), loss = -$25/share (100% loss)
💡 Trading Ideas
🛡️ Conservative: Cash Until Clarity
Play: Stay on sidelines until after March 25th earnings volatility settles
Why this works:
- ⏰ Earnings in 48 days with expiration 5 days BEFORE creates maximum uncertainty
- 💸 Implied volatility at 18.5% through March - options EXPENSIVE
- 📊 Stock at all-time highs with 57x P/E after 124% YTD gain - zero margin of safety
- 🎯 Better entry likely post-earnings after IV crush reduces option premiums
- 📉 Historical pattern: Memory stocks often pull back post-earnings even on beats (buy the rumor, sell the news)
- 🤔 The $12M institutional put buy signals smart money is HEDGING - why fight the tape?
Action plan:
- 👀 Watch March 25th earnings for revenue ($18.7B+ target), margins (68%+ needed), and HBM outlook
- 🎯 Look for pullback to $350-$370 gamma support post-earnings for stock entry with 8-15% margin of safety
- ✅ Need to see HBM revenue trajectory and Q3 guidance quality before committing capital
- 📊 Monitor unusual options activity - if institutions add MORE puts, stay defensive
Risk level: Minimal (cash position) | Skill level: Beginner-friendly
⚖️ Balanced: Post-Earnings Put Spread (Copy The Pros)
Play: After earnings, sell put spread mirroring institutional positioning
Structure: Buy $360 puts, Sell $350 puts (March 20 expiration - SAME as the $12M trade)
Wait until: March 26th (day after earnings) when IV crushes
Why this works:
- 🎢 IV crush after earnings makes put spreads much cheaper
- 📊 Defined risk spread ($10 wide = $1,000 max risk per spread)
- 🎯 Targets gamma support zone at $350-$360 where institutions are positioned
- 🤝 Essentially "copying" the smart money positioning at better prices post-IV crush
- 🛡️ Protects against "sell the news" scenario even if earnings beat
Estimated P&L (adjust after seeing post-earnings IV):
- 💰 Pay ~$3-4 net debit per spread post-earnings (vs $6-7 now)
- 📈 Max profit: $600-700 if MU below $350 after earnings
- 📉 Max loss: $300-400 if MU above $360 (defined and limited)
- 🎯 Breakeven: ~$356-357
Risk level: Moderate (defined risk, bearish directional) | Skill level: Intermediate
🚀 Aggressive: Pre-Earnings Call Spread (Ride the Momentum)
Play: Bull call spread betting on continued rally into earnings
Structure: Buy $390 calls, Sell $420 calls (March 20 expiration)
Why this could work:
- 💥 Momentum remains strong with HBM demand narrative intact
- 🎯 Analysts continue raising estimates heading into record quarter
- 📊 $400 gamma resistance could break on strong pre-earnings positioning
- 🚀 Implied move upper range is $447 - significant upside room
Why this could blow up (SERIOUS RISKS):
- 💸 EXPENSIVE: IV elevated ahead of earnings makes spreads costly
- ⏰ TIMING RISK: Expiration is 5 days BEFORE earnings - may miss the move
- 😱 VALUATION: 57x P/E at all-time highs with 124% YTD gain
- 📉 PROFIT-TAKING: Institutions may trim into strength ahead of event
Estimated P&L:
- 💰 Cost: ~$8-10 per spread
- 📈 Max profit: $20-22 if MU above $420 (100-120% ROI)
- 📉 Max loss: $8-10 (full premium paid)
- 🎯 Breakeven: ~$398-400
CRITICAL WARNING - Only attempt if you:
- ✅ Can afford to lose entire premium
- ✅ Understand expiration is BEFORE earnings
- ✅ Accept reduced probability due to stretched valuation
Risk level: HIGH | Skill level: Advanced only
⚠️ Risk Factors
Don't get caught by these potential landmines:
-
⏰ Earnings binary event in 48 days: Results March 25th after close create MASSIVE volatility risk. Stock could gap 10-15% either direction based on revenue ($18.7B vs $19B+ makes huge difference), margins (68% vs 65% changes narrative), and HBM supply outlook. The put trade expires 5 days BEFORE earnings, creating unique timing dynamics.
-
💸 Valuation at nosebleed levels: Trading at ~57x P/E after 124% YTD gain and 303% over six months. According to The Motley Fool's analysis, this is EXTREMELY stretched even for the AI memory leader. Requires perfect execution to justify current multiple. Any disappointment magnified at this valuation.
-
🇨🇳 China export restrictions ongoing: Per TechCrunch reporting, China banned Micron chips in critical infrastructure citing "national security." This limits revenue opportunity in the world's largest semiconductor market. Future escalation could hit new products without warning.
-
⚖️ Competitive threats intensifying: According to Astute Group's market share analysis, SK Hynix holds 62% HBM share vs Micron's 21%. Samsung's HBM4 recovery and aggressive pricing could trigger oversupply as early as 2027. All three players racing for NVIDIA 16-Hi HBM4 supply contracts.
-
🏭 Peak cycle concerns: Per Seeking Alpha's risk analysis, earnings and margins anticipated to peak in 2026 or early 2027. Memory industry historically cyclical - downturn risk post-peak. Current valuation reflects peak expectations with zero cushion.
-
📉 Insider activity raising flags: According to Timothy Sykes reporting, recent insider disposition of ~$5 million in shares may signal management caution at current valuations. Bears interpret as lack of confidence in near-term upside.
-
🐋 Smart money buying $12M insurance at peak: This institutional put purchase signals sophisticated players are HEDGING despite bullish fundamentals. When funds pay $12M for protection rather than staying fully long, it's a caution flag. The 14.22 Z-score (EXTREMELY UNUSUAL) shows this isn't normal hedging activity.
-
📊 Gamma ceiling at $400 creates natural resistance: Massive 12.4B call gamma at $400 (strongest level) means market makers will systematically SELL into rallies to hedge their exposure. This creates mechanical selling pressure making breakouts difficult without sustained institutional buying.
🎯 The Bottom Line
Real talk: Someone just spent $12 MILLION protecting a massive MU position heading into the company's most important earnings quarter. This isn't bearish on Micron's long-term AI memory story - it's smart risk management by institutions who've made HUGE money on the 124% YTD rally and don't want to give it back in one bad print.
What this trade tells us:
- 🎯 Sophisticated player expects VOLATILITY through March (protecting against 9-15% downside scenario)
- 💰 They're worried enough about a $384→$350 move to pay $25/share for insurance (6.5% of stock price!)
- ⚖️ The timing (48 days pre-earnings, expiring 5 days before the report) shows they see elevated risk in the pre-earnings window
- 📊 They structured at $350 strike (8.9% below current) which sits at major gamma support - expects that IF stock breaks, this level holds
This is NOT a "sell everything" signal - it's a "take some chips off the table and manage risk" signal.
If you own MU:
- ✅ Consider trimming 20-30% at $380-$400 levels (lock in triple-digit gains, reduce concentration)
- 📊 If holding through March, set MENTAL STOP at $350 (major gamma support) to protect remaining position
- ⏰ Don't get greedy - you've already won! Up 124% YTD is INCREDIBLE.
- 🛡️ Consider buying protective puts per 100 shares if holding large position
If you're watching from sidelines:
- ⏰ March 25th after close is the moment of truth - consider waiting for clarity
- 🎯 Post-earnings pullback to $350-$370 would be EXCELLENT entry (10-15% off highs with gamma support)
- 📈 Looking for confirmation of: HBM revenue trajectory, Q3 guidance $20B+, gross margins holding 65%+
- 🚀 Longer-term, the AI memory supercycle thesis remains INCREDIBLY compelling with HBM TAM projected to reach $100B by 2028
If you're bearish:
- 🎯 Wait for technical breakdown before initiating shorts - fighting 124% momentum is dangerous
- 📊 First support at $380 (gamma), major support at $365 (put gamma wall), deeper support at $350 (this put strike)
- ⚠️ Post-earnings put spreads offer defined-risk way to play downside after IV crush
- 📉 Watch for break below $365 - that's the trigger for cascade to $350
Mark your calendar - Key dates:
- 📅 February 6 - Weekly OPEX (+/-4% implied move)
- 📅 February 20 - Monthly OPEX (+/-10.9% implied move)
- 📅 March 20 - Triple Witch / THIS PUT EXPIRES (+/-18.5% implied move)
- 📅 March 25 - Q2 FY2026 Earnings (After Market) - THE BIG ONE
- 📅 H2 2026 - HBM4 full production ramp
- 📅 H2 2027 - PSMC Taiwan fab contribution begins
Final verdict: MU's long-term AI memory story remains INCREDIBLY compelling - HBM sold out through 2026, record margins expanding to 68%, CHIPS Act funding securing U.S. manufacturing, and the $100B+ New York Megafab investment. BUT, at 57x P/E after 124% YTD gain with earnings in 48 days, the risk/reward is NO LONGER favorable for aggressive new positioning. The $12M institutional put buy is a CLEAR signal: smart money is derisking at the peak.
Be patient. Let the earnings window clear. Look for better entry points at $350-$370. The AI memory supercycle will still be here, and you'll sleep better at night with a margin of safety.
This is a marathon, not a sprint. Protect your capital. 💪
Disclaimer: Options trading involves substantial risk of loss and is not suitable for all investors. This analysis is for educational purposes only and not financial advice. Past performance doesn't guarantee future results. The Z-score of 14.22 (EXTREMELY UNUSUAL) reflects this specific trade's statistical rarity relative to recent MU options activity - it does not imply the trade will be profitable or that you should follow it. Always do your own research and consider consulting a licensed financial advisor before trading. Earnings create binary event risk with potential for 10-15% gaps either direction. The put buyer may have complex portfolio hedging needs not applicable to retail traders.
About Micron Technology: Micron Technology is one of the largest semiconductor companies in the world, specializing in memory and storage chips. The company derives most revenue from DRAM production while maintaining minority involvement in NAND flash technology, serving customers across data centers, mobile devices, consumer electronics, and industrial/automotive sectors. Market cap: $427.0 billion in the Semiconductors & Related Devices industry.