🐋 MU: Someone Just COLLECTED $10M Selling ATM Puts Into Earnings - Maximum Bullish Conviction!
📅 March 5, 2026 | 🔥 Unusual Activity Detected
🎯 The Quick Take
Someone just sold 3,616 ATM put contracts on Micron and collected $10 MILLION in premium -- with earnings just 13 days away! This is an extremely bullish play: they're betting MU stays above $385 through a record earnings report and NVIDIA GTC. With a Z-score of 55.17 (EXTREMELY UNUSUAL), this kind of put-selling conviction shows up only a handful of times per year in MU options.
💰 The Option Flow Breakdown
📊 What Just Happened
| Field | Value |
|---|---|
| ⏰ Time | 12:43:31 |
| 🎯 Symbol | MU |
| 💼 Side | MID |
| 🟢 Buy/Sell | SELL |
| 📉 Type | PUT |
| 📅 Expiration | 2026-03-20 |
| 💵 Premium | $10M (collected) |
| 🎯 Strike | $385 |
| 📊 Volume | 5,200 |
| 📈 OI | 451 |
| 📏 Size | 3,616 contracts |
| 💹 Spot Price | $384.55 |
| 💲 Option Price | $28.00 |
| 📊 Vol/OI Ratio | 11.5x |
🤓 What This Actually Means
Let me break this down: This trader is selling at-the-money puts and pocketing $10M upfront. That means they're making a deal with the market: "I'll buy 361,600 shares of MU at $385 if the stock drops below that by March 20 -- and you're going to pay me $10 million for taking that risk."
🔥 Z-Score: 55.17 -- EXTREMELY UNUSUAL
Here's why this is such a big deal:
- 🐋 Volume is 11.5x open interest -- overwhelmingly new positioning, not rolling or closing
- 🏦 This is the size of a hedge fund position -- if assigned, that's $139M worth of MU shares they'd need to buy
- 📊 A Z-score of 55.17 means this trade is roughly 55 standard deviations above average activity -- you might see something like this only a few times a year in MU options
- ⏳ This expires in just 15 days, which includes both NVIDIA GTC (March 16) AND Micron earnings (March 18)
Translation for us regular folks: Somebody with very deep pockets is so confident MU won't crash through earnings that they're willing to buy $139M in shares at $385 if it does -- and they collected a cool $10M for making that bet. That's conviction.
🏢 Company Overview
Micron Technology (MU) is one of the largest semiconductor companies in the world, specializing in memory and storage chips -- primarily DRAM and NAND flash products serving data centers, mobile devices, and industrial markets.
- 💰 Market Cap: ~$451B
- 🏭 Sector: Semiconductors & Related Devices
- 👥 Employees: 53,000
- 📍 Headquarters: Boise, ID
- 📈 Exchange: NASDAQ
- 📆 Listed Since: June 1, 1984
Micron is the only U.S.-based memory manufacturer and sits at the epicenter of the AI memory supercycle with its HBM (High Bandwidth Memory) capacity completely sold out through all of 2026.
📈 Technical Setup / Chart Check-Up
YTD Chart
MU has had an incredible run -- up roughly +340% over the past 12 months from around $91 to today's levels near $385. The stock hit an all-time high of $455.50 on January 30, 2026, then pulled back ~15% during the geopolitical selloff triggered by U.S.-Iran conflict in early March. It's been bouncing off recent lows and is now consolidating.
The 50-day moving average sits around $380 and is acting as near-term support, while the 200-day MA around $215 confirms the long-term uptrend is firmly intact.
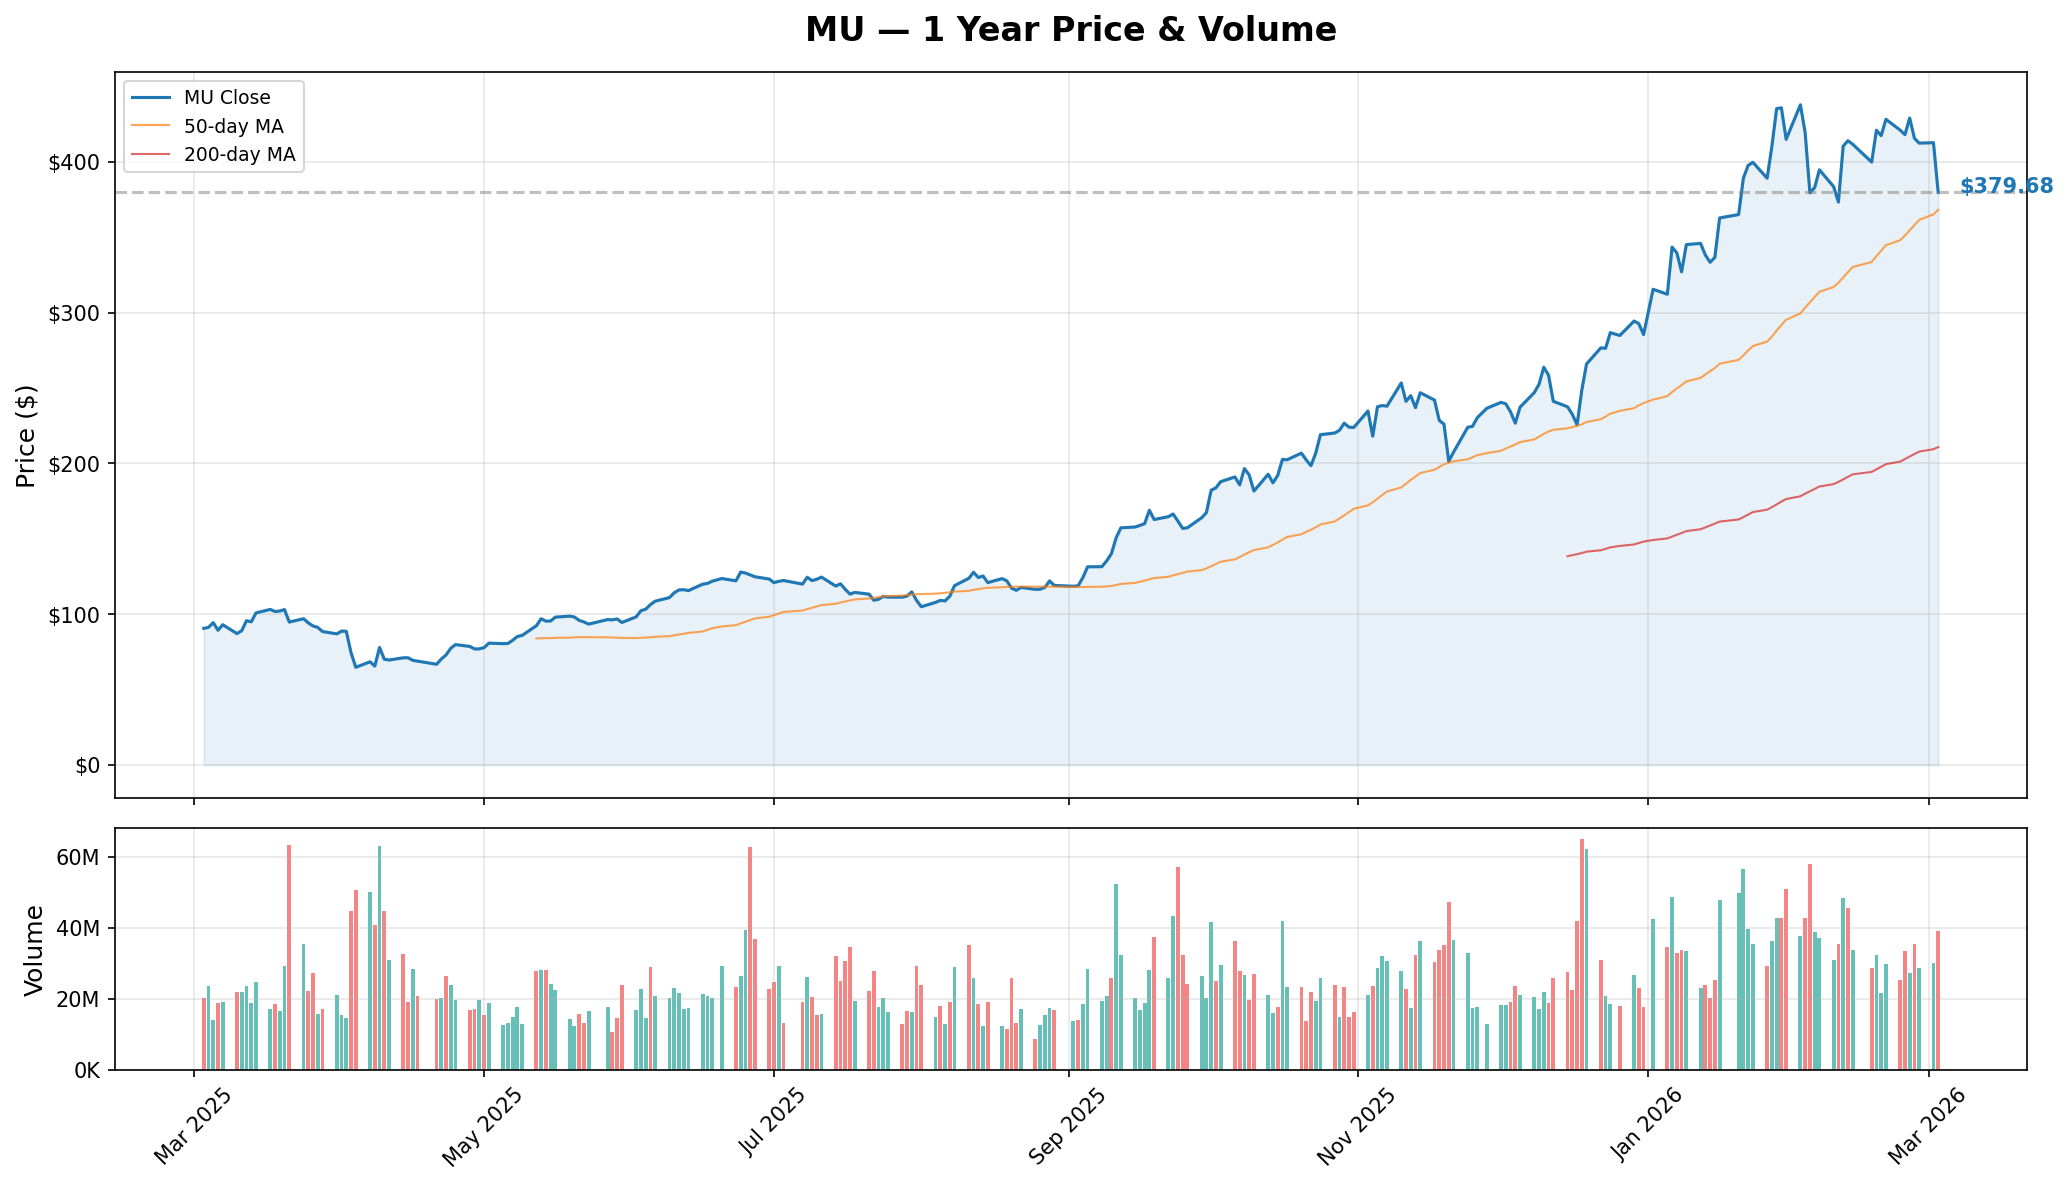
Key takeaways from the chart:
- 📈 Massive uptrend from the May 2025 lows, accelerating into January 2026
- 📉 Sharp pullback from $455 ATH to ~$367 low (March 5 intraday) on Iran conflict
- 🔄 Currently bouncing -- the dip-buyers are stepping in around $380-$385
- 📊 Volume spiked big on the recent selloff and recovery, showing active participation
🔵🟠 Gamma-Based Support & Resistance Analysis
The options market maker positioning gives us a view of where the "gravitational pulls" are for MU's stock price. Here's the gamma exposure chart:
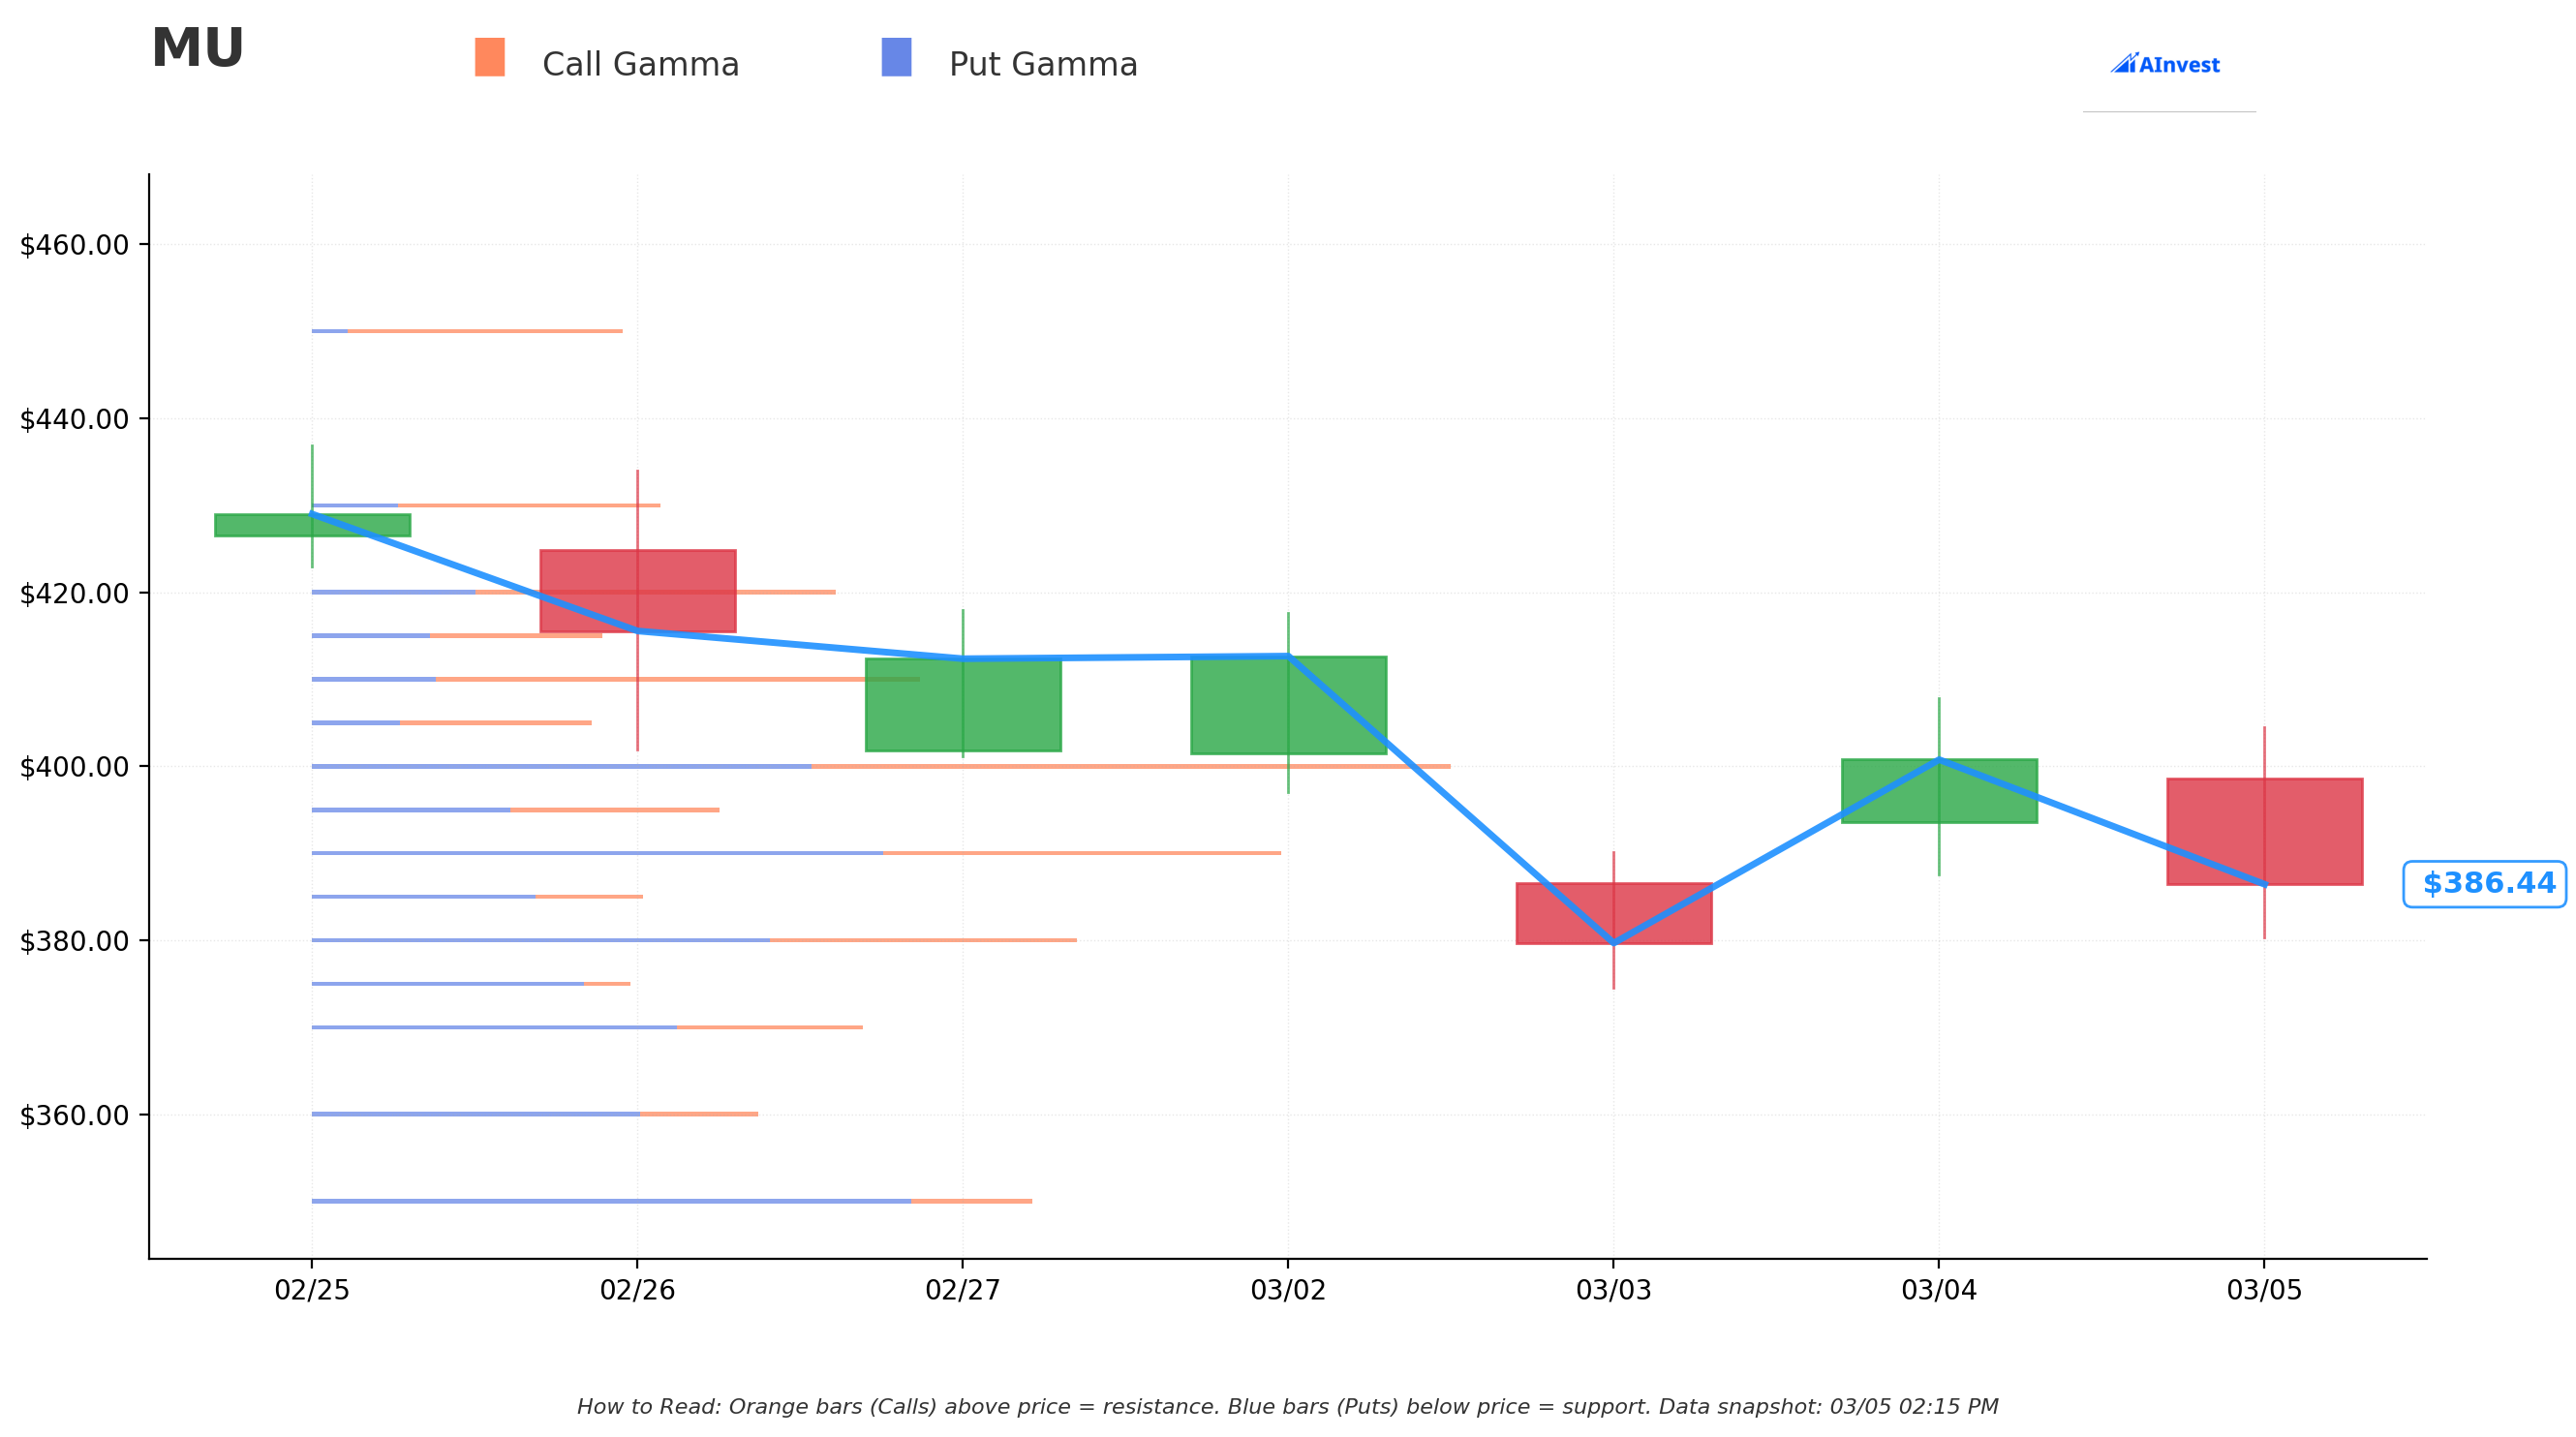
Current Price: $386.44
The gamma chart shows a few important dynamics over the past couple weeks:
- 🟢 Green bars (Call Gamma) above price = areas where market makers need to sell as price rises, creating natural resistance
- 🔴 Red bars (Put Gamma) below price = areas where market makers need to buy as price falls, creating natural support
- 📍 The price has been bouncing between put gamma support around $380 and call gamma resistance near $400
Key Gamma Levels:
🛡️ Support zones:
- $380 -- Strong put gamma concentration visible on the chart. This aligns with the 50-day moving average
- $370 -- Secondary floor from the recent selloff low ($367.05 intraday)
🎯 Resistance zones:
- $400 -- First major call gamma wall. The stock bounced off this area multiple times in late February and early March
- $410-$420 -- Thicker resistance band that capped price action before the selloff
- $430 -- Top of the gamma range from the data
What this means for you: The options market is telling us there's a solid floor forming around $380 and meaningful resistance at $400. A breakout above $400 (which a strong earnings beat could trigger) opens the door toward $420+. This aligns perfectly with why someone is comfortable selling $385 puts -- the gamma support is sitting right at that level.
📊 Implied Move Analysis
The options market is pricing in some serious fireworks for MU over the next few weeks:
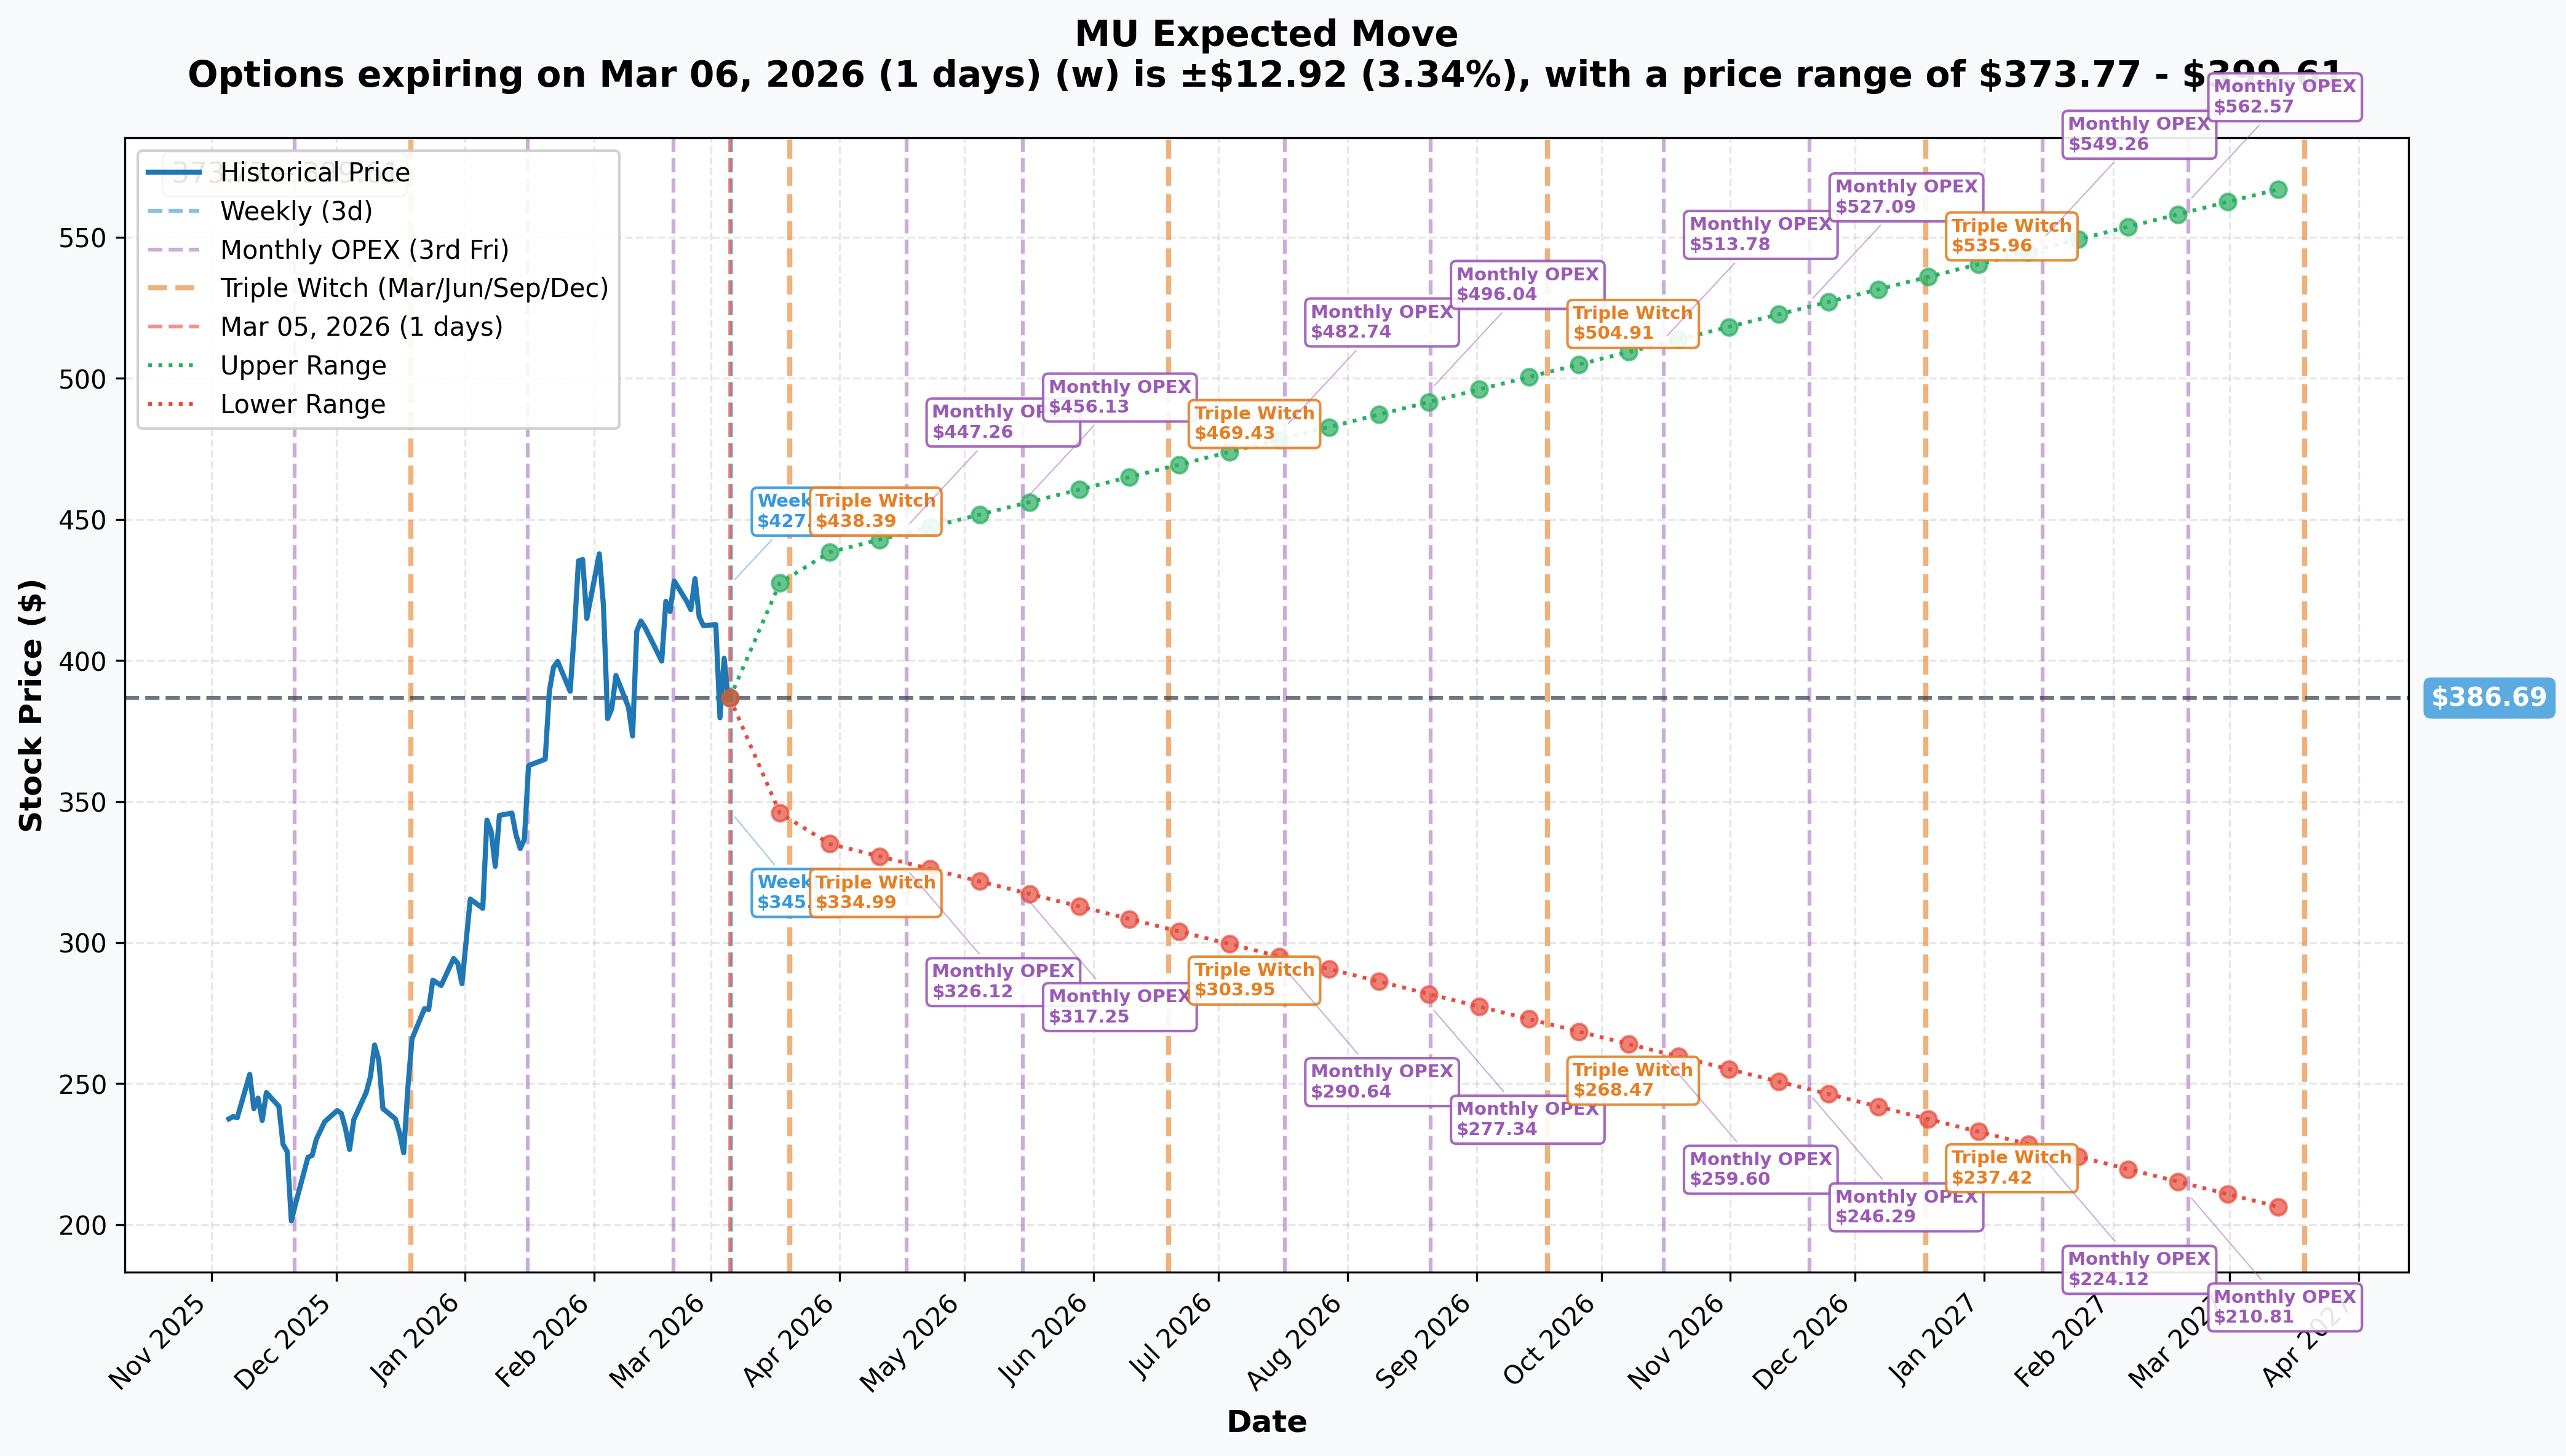
Near-Term Expected Moves:
| Timeframe | Expiry | Implied Move | Price Range |
|---|---|---|---|
| 📆 Weekly | 2026-03-06 | ±3.3% (±$12.92) | $373.77 - $399.61 |
| 📅 Monthly/Triple Witch | 2026-03-20 | ±12.5% (±$48.36) | $338.32 - $435.06 |
| 📆 Yearly LEAPS | 2027-03-19 | ±47.3% (±$182.90) | $203.79 - $569.59 |
👀 That ±12.5% implied move for the March 20 expiration is massive -- the market expects MU could move nearly $50 in either direction through earnings. This makes sense given we have TWO mega-catalysts (GTC + earnings) packed into the same week.
The put seller's $385 strike sits right at the bottom of the weekly range but well within the monthly implied move. Their breakeven is around $357 ($385 strike minus $28 premium collected), which would require a ~7.2% drop below current levels. Looking at the implied move range, that breakeven sits below even the lower bound of the monthly expected move ($338.32).
🎪 Catalysts
📅 Upcoming Events (Next 2 Weeks -- This Is Where It Gets WILD)
-
🟢 March 16, 2026 -- NVIDIA GTC 2026 Keynote (11 days away)
- Jensen Huang keynote with 30,000+ attendees and 1,000+ AI sessions
- Micron's industry-first 256GB SOCAMM2 module will be featured prominently, co-designed with NVIDIA for Vera Rubin servers
- NVIDIA expected to showcase Vera Rubin platform and potentially Feynman architecture
- Any positive memory demand signals from NVIDIA could re-rate the entire memory sector
-
🟢 March 18, 2026 -- Micron FQ2 2026 Earnings (13 days away, 4:30 PM EDT)
- Management guided to record $18.7B revenue (+37% QoQ), 68% gross margin, $8.42 EPS
- Street consensus is even higher at $8.61 EPS -- analysts expect a beat!
- Polymarket assigns 91% probability of beating the guided numbers
- Forward guidance (FQ3 2026) will be the key swing factor
Plot twist: These two catalysts happen within 48 hours of each other. GTC on Monday, earnings on Wednesday after the close. That's why implied volatility is cranked up to ~70%.
✅ Already Happened
- 📊 December 18, 2025 -- FQ1 2026 earnings crushed it: Revenue $13.64B (+57% YoY), GAAP EPS $4.60 -- third consecutive quarterly revenue record
- 🚀 February 12, 2026 -- HBM4 shipping a quarter ahead of schedule at 11+ Gbps, dismissing rumors of being sidelined from NVIDIA's Rubin platform
- 💰 Q1 2026 -- DRAM prices surged 90-95% QoQ, with conventional memory in structural shortage as capacity shifted to HBM for AI
- 📉 March 3, 2026 -- MU dropped ~7.1% during the broader geopolitical selloff triggered by U.S./Israel strikes on Iran; South Korean memory stocks hit even harder (Samsung -11.7%, SK Hynix -9.6%)
- 🔄 March 5, 2026 -- MU rebounded ~5.6%, suggesting dip-buying into the earnings catalyst
🎲 Price Targets & Probabilities
Based on gamma levels, implied move ranges, and the catalyst timeline:
🚀 Bull Case (35% probability) -- Target: $420-$435
If NVIDIA GTC delivers strong memory demand signals AND Micron beats consensus with robust FQ3 guidance, we could see a breakout through the $400 gamma wall toward the upper implied move range of $435. The analyst price target range is wildly bullish -- Aletheia at $650, Lynx Global at $550, Rosenblatt at $500. A strong earnings report could kickstart the next leg toward those targets.
Why it could happen: HBM capacity is sold out through 2026, DRAM prices are forecast to surge another 70% in Q2, and Street consensus already expects a beat. The geopolitical pullback created a coiled spring.
😐 Base Case (45% probability) -- Target: $380-$410 Range
The most likely scenario: MU meets or slightly beats guidance, gives in-line FQ3 outlook, and the stock consolidates in this range. The heavy gamma levels between $380-$410 act like magnets. The $10M put seller profits handsomely in this scenario -- they keep most or all of their $28 premium per contract.
Why it's most likely: Record revenue at $18.7B is already expected and somewhat priced in. The real question is FQ3 guidance and HBM4 qualification updates.
😰 Bear Case (20% probability) -- Target: $340-$370
If geopolitical tensions escalate further (Strait of Hormuz disruption), or Micron disappoints on forward guidance, or the 25% semiconductor tariffs create demand uncertainty, we could retest the recent selloff lows near $367. The put seller would be in trouble below $357 (their breakeven), but the implied move lower bound at $338 provides context for worst-case.
Why it's a risk: The stock trades at 38x P/E, gross margins may be approaching a cyclical peak, and the U.S.-Iran conflict remains a wild card. Memory stocks historically get hit hardest in global risk-off events.
💡 Trading Ideas
🛡️ Conservative -- "The Premium Collector's Special"
Sell MU March 20 $355/$350 Put Spread (Cash-Secured)
- 💵 Estimated credit: ~$1.20
- 🎯 Max profit: $120 per spread (if MU stays above $355 at expiry)
- ❗ Max loss: $380 per spread
- 📊 Breakeven: ~$353.80 (about 8% below current price)
- ⏰ 15 days to expiration
- ✅ Why this works: You're copying the whale's playbook but with defined risk. The $355 level is well below the implied move range and the recent selloff low. You need MU to not completely fall apart through earnings -- and with 91% probability of beating guidance, those odds are in your favor.
⚖️ Balanced -- "Earnings Strangle Seller"
Sell MU March 20 $350/$435 Strangle
- 💵 Estimated credit: ~$8.50
- 🎯 Max profit: $850 per contract if MU stays between $350-$435
- ❗ Risk: Unlimited beyond those strikes (use a spread to cap risk if needed)
- 📊 Breakeven: ~$341.50 on the downside, ~$443.50 on the upside
- ✅ Why this works: IV is elevated at ~70% due to GTC + earnings. The implied move prices in ±12.5%. As long as MU doesn't blow past $435 or crater below $350, you profit from the IV crush after earnings. The gamma chart shows strong "walls" near both boundaries.
🚀 Aggressive -- "GTC Momentum Ride"
Buy MU March 20 $400 Call
- 💵 Estimated cost: ~$15-$18 per contract
- 🎯 Breakeven: ~$415-$418
- 📈 Profit target: $420-$435 (2x-3x return if reached)
- ❗ Risk: 100% loss of premium if MU stays below $400
- ✅ Why this works: You're betting that the GTC + earnings one-two punch sends MU surging through the $400 gamma resistance. If Jensen Huang drops bombshells about Vera Rubin memory demand and then Micron beats two days later, this could print. But wait -- options are expensive (70% IV), so you're paying up for this ride. Only risk what you can afford to lose.
⚠️ Risk Factors
What could go wrong, honestly:
- 🌍 Geopolitical Escalation: The U.S.-Iran conflict is still active. A Strait of Hormuz disruption could spike energy costs and hammer semiconductor supply chains. South Korean memory stocks already got destroyed with Samsung down 11.7% last week.
- 📊 Peak Margins Risk: Gross margins approaching 68% may be near a cyclical top. Memory is a famously cyclical industry, and what goes up eventually comes down.
- 💸 Tariff Uncertainty: 25% semiconductor tariffs announced by the White House add a layer of pricing risk and potential demand destruction.
- 🎢 IV Crush Risk for Buyers: At ~70% implied volatility, long options are expensive. Even if MU moves in your direction, IV crush after earnings could eat your profits.
- ⚔️ HBM4 Competition: SK Hynix holds 62% HBM market share vs Micron's 21%. Any market share losses to SK Hynix or Samsung's integrated packaging approach would be a negative surprise.
- 💰 CapEx Burden: $20B FY2026 capex is aggressive. If AI spending slows, Micron is stuck with massive capacity buildout costs.
- 📉 Valuation Stretched: At 38x P/E after a 340% 12-month run, a lot of good news is already priced in. Any miss or soft guidance could trigger a sharp correction.
🎯 The Bottom Line
Real talk: When someone sells $10 million worth of at-the-money puts on a stock 13 days before earnings, they're telling you something. They believe so strongly that MU will hold above $385 that they're willing to buy $139M in shares if they're wrong -- and they collected $10M for that conviction.
The setup is objectively compelling: HBM capacity sold out through 2026, DRAM prices surging 90%+ QoQ, two back-to-back catalysts (GTC March 16 + earnings March 18), Street consensus already above company guidance, and a ~15% pullback from all-time highs creating a potential entry. The Z-score of 55.17 confirms this trade is extremely unusual -- you see activity like this only a few times a year.
Action Plan:
- 🟢 If you're bullish on MU: The dip from $455 to $385 could be your entry. Consider selling puts (like this whale) or buying shares with defined risk. The GTC + earnings combo in 11-13 days is the catalyst.
- 👀 If you're on the fence: Watch the $380 support level. If MU holds above the 50-day moving average and doesn't lose $370, the base case of $380-$410 range looks solid. Selling premium (strangles or put spreads) takes advantage of the 70% IV.
- 🔴 If you're bearish: Respect the size of this flow. A $10M put sale is not something to bet against lightly. But if geopolitics worsen or earnings miss, the $340-$370 zone is your target.
📅 Mark your calendar: NVIDIA GTC keynote March 16, Micron earnings March 18 at 4:30 PM EDT. These 48 hours will define MU's next move.
The whale collected $10M for a reason. Whether you follow their lead or fade them, now you know the stakes. 🎯
Options trading involves significant risk and can result in 100% loss of investment. This analysis is for educational purposes only and not financial advice. Always do your own research and consult with a financial advisor before making investment decisions.