🐋 MU: $17.4M in LEAP Call Selling Before Earnings -- Someone Just Capped Their Upside at $480 (2026-03-09)
📅 March 9, 2026 | 🔥 Extreme Unusual Activity Detected
🎯 The Quick Take
Two massive sell-to-open LEAP call trades in MU just dropped $17.4 MILLION in premium -- all within the same second. Someone sold 2,600 January 2027 $480 calls for $9.2M and another 2,200 January 2027 $510 calls for $8.2M. With MU trading at ~$378.78, that is 27-35% out of the money with 10 months of time. The Z-Score on the $480 strike hit 56.49 -- meaning this trade was 56 times the average daily size. With FQ2 earnings just 9 days away on March 18 and S&P 100 inclusion on March 23, this trader is either harvesting massive premium on a covered call position or making an extremely high-conviction bet that MU tops out well below $480 by January 2027.
💰 The Option Flow Breakdown
📊 What Just Happened
Here are the EXACT trades that lit up our scanners at 9:37 AM:
| Time | Symbol | Buy/Sell | Type | Strike | Expiry | Premium | Volume | OI | Spot | Option Price | Strategy | Z-Score |
|---|---|---|---|---|---|---|---|---|---|---|---|---|
| 09:37:21 | MU | SELL | CALL | $480.00 | 2027-01-15 | $9,200,000 | 2,600 | 398 | $364.00 | $64.34 | Short Call (STO) | 56.49 🚨 |
| 09:37:21 | MU | SELL | CALL | $510.00 | 2027-01-15 | $8,200,000 | 2,200 | 2,700 | $364.00 | $57.29 | Short Call (STO) | 13.46 🚨 |
🐋 Combined Premium Collected: $17,400,000
🤓 What This Actually Means
Let's break down why this trade is so significant:
💡 What They Did:
- ✅ Sold 2,600 contracts of the Jan 2027 $480 call -- that is 6.5x the existing open interest of 398
- ✅ Sold 2,200 contracts of the Jan 2027 $510 call against open interest of 2,700
- ✅ Both are SELL-TO-OPEN (STO) -- brand new short positions, not closing existing longs
- ✅ Both executed at the SAME second -- coordinated institutional desk execution
- ✅ Collected $17.4M in upfront premium
🧠 What They're Thinking:
- They believe MU will NOT exceed $480 by January 2027 -- that is a 27% rally from here
- The $480/$510 strike structure suggests either a bear call spread (defined risk) or two separate covered calls against a massive long stock position
- At $64.34 per contract on the $480 strike, they are selling rich premium -- LEAP implied volatility is elevated heading into earnings
- With 10 months of theta to collect, even if MU rallies 20%, these calls can still expire worthless
🚨 Why It's Extremely Unusual:
- The $480 strike Z-Score of 56.49 is off the charts -- this happens maybe once or twice a QUARTER across all tickers
- Vol/OI ratio of 6.53 on the $480 strike means today's volume was 6.5x the entire existing open interest
- The $510 strike Z-Score of 13.46 is also classified as EXTREMELY UNUSUAL
- $17.4M in combined premium is institutional-scale -- retail traders do not sell $17M in LEAPs before earnings
- Both trades hit at the SAME millisecond at the midpoint -- this is a professional desk with sophisticated execution
🔍 Two Possible Interpretations
Interpretation A: Covered Call / Overwrite (Most Likely)
This trader likely owns a massive long MU stock position -- potentially 260,000+ shares ($98M+ notional) -- and is writing covered calls against it to generate income. The logic: "I love MU long term, I am keeping my shares, but I'll collect $17.4M in premium by capping my upside at $480-$510." If the stock stays below $480, they pocket the entire $17.4M. If it runs to $500, they still participate in the move to $480 and keep the premium.
Interpretation B: Bearish Premium Harvest
The trader could be making a naked or spread-based bet that the HBM/AI rally in memory stocks is getting overextended. At ~11x forward P/E on consensus FY2026 EPS of ~$34, Micron looks cheap -- but if you believe earnings are peaking and FY2027 estimates will come down, selling calls 27-35% OTM with 10 months of time is a high-probability way to express that view. Memory cycles always peak. Maybe this trader thinks THIS is the peak.
🏢 Company Overview
Micron Technology (MU) is one of the largest semiconductor companies in the world, specializing in DRAM and NAND memory and storage chips. The company is a top-3 global DRAM producer alongside Samsung and SK Hynix, and has emerged as a critical supplier of HBM (High Bandwidth Memory) chips that power the AI revolution -- used in NVIDIA and AMD accelerators across every major hyperscaler data center on the planet.
Key Stats:
- 💰 Market Cap: ~$416.8 billion
- 🏭 Industry: Semiconductors & Related Devices
- 📍 Headquarters: Boise, Idaho
- 📊 FY2026E Revenue: ~$76B (consensus), +103% YoY
- 📈 Forward P/E: ~11.3x on FY2026 consensus EPS of ~$34
📈 Technical Setup / Chart Check-Up
YTD Performance
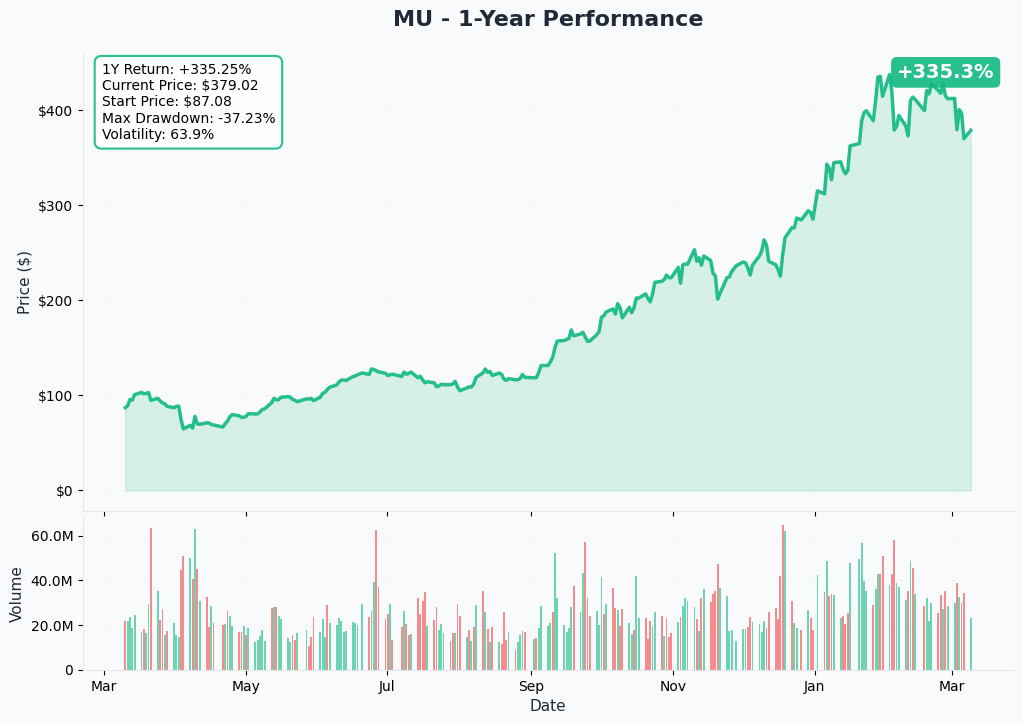
MU has had a wild ride in 2026 so far. After trading above $455 at its 52-week high, the stock has pulled back sharply to ~$378.78 amid a convergence of headwinds: weak February jobs data (92,000 losses vs 50,000 expected), potential new export licensing requirements for AI processors (Bloomberg reported March 6), and geopolitical uncertainty. March 6 alone saw a -6.74% drop on $12.83 billion in trading volume -- the fourth-largest volume day in MU history. Pre-market on March 9, the stock was down another ~7%, briefly touching $344 before recovering to the $369-$379 zone.
That is a ~17% drawdown from the 52-week high. The question: is this a buying opportunity before a massive earnings catalyst, or the beginning of a larger correction?
🎯 Gamma-Based Support & Resistance Analysis
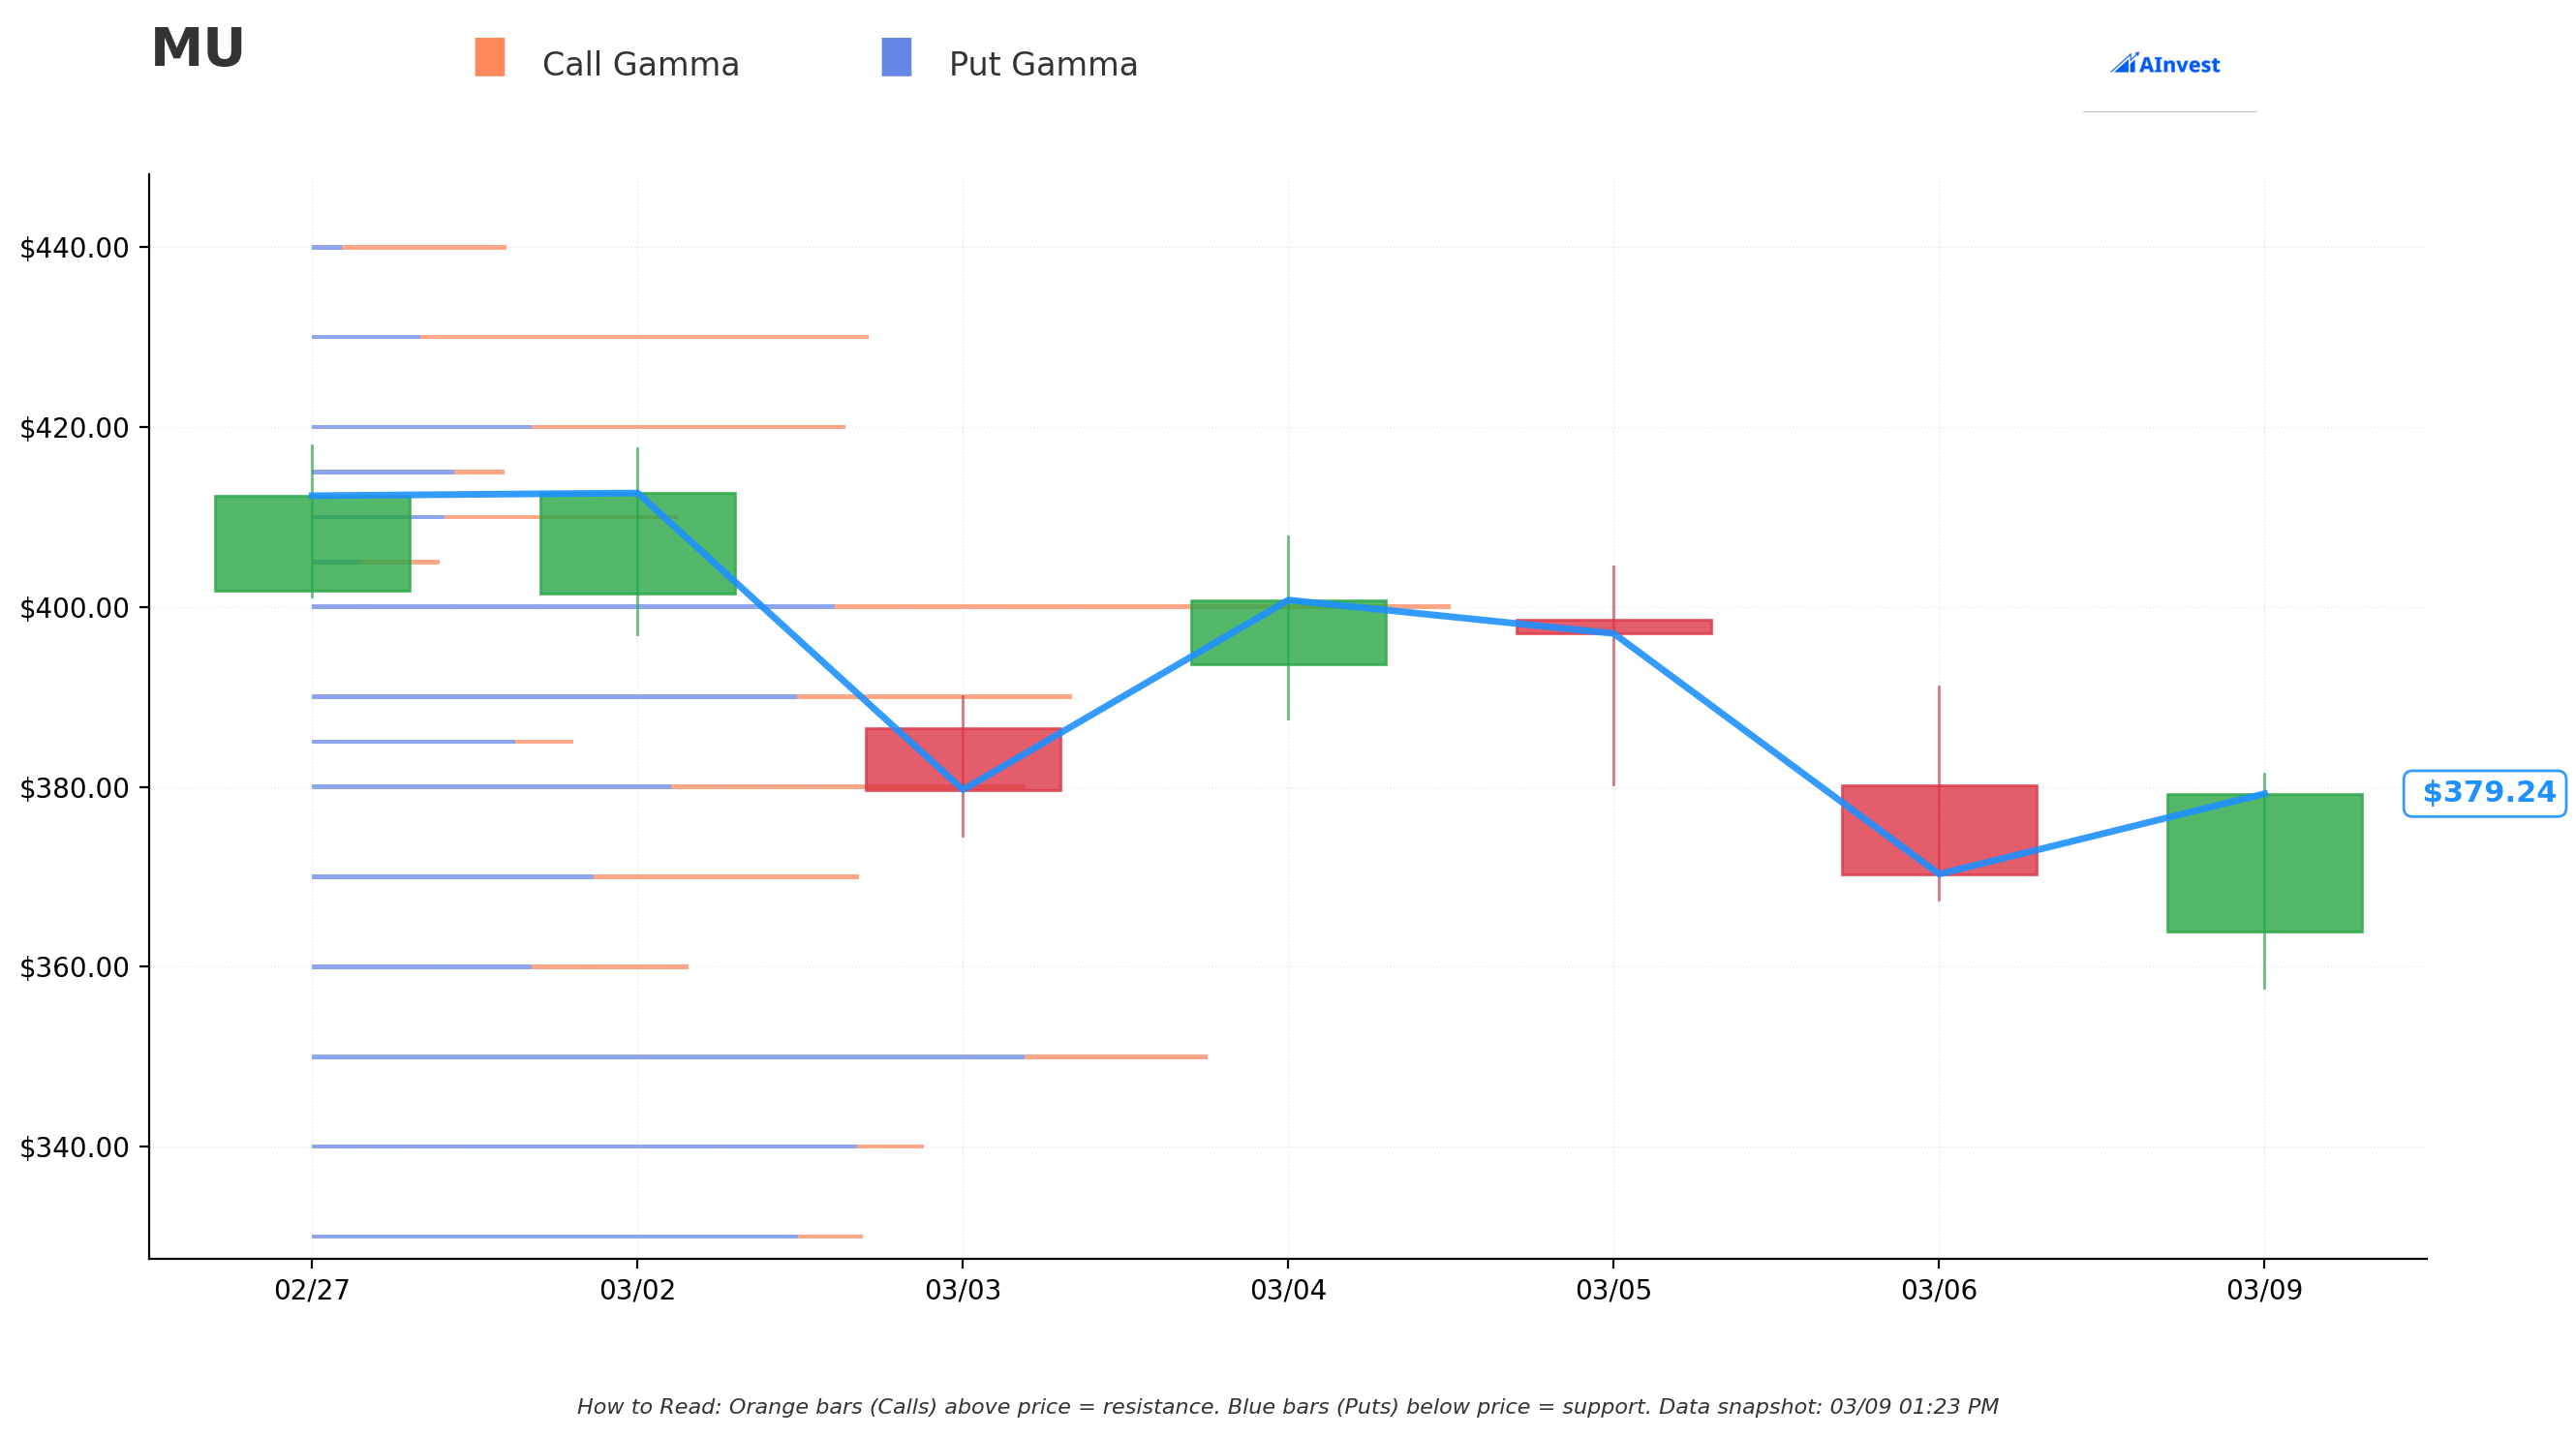
Current Price: $378.78
The gamma exposure (GEX) map tells us exactly where the market maker "walls" are -- levels where dealer hedging creates gravitational pull on the stock price:
🔵 Support Levels (Where Dealers Defend):
- $370.00 -- STRONGEST SUPPORT (6.4B total GEX) 🛡️
- Nearest major support just 2.3% below current price
- Heavy put gamma creates a dealer buying zone on any dip
- $360.00 -- Secondary support (4.5B GEX)
- ~5% below current price -- the "don't panic" level
- $350.00 -- MASSIVE FLOOR (10.6B total GEX) 🛡️🛡️
- The biggest gamma concentration on the entire chain
- Bernstein's price target also sits near here -- fundamental and technical confluence
- If $370 breaks, this is the line in the sand
- $340.00 -- Deep support (7.3B GEX)
- $330.00 -- Safety net (6.5B GEX)
🟠 Resistance Levels (Where Selling Pressure Lives):
- $380.00 -- IMMEDIATE RESISTANCE (8.4B total GEX) ⚠️
- MU is bumping right against this level -- needs a catalyst to break through
- Call gamma is dominant above here, creating dealer selling pressure
- $390.00 -- Next hurdle (8.9B GEX) 🚧
- $400.00 -- Psychological and technical barrier (13.3B GEX) 🎯
- Highest total gamma on the upside -- this is the "prove it" level
- The 200-day moving average zone sits at $398-$402, adding to resistance
- $420.00 -- Medium-term ceiling (6.2B GEX)
- $430.00 -- Upper resistance (6.5B GEX)
Net GEX Bias: Bearish -- Total put GEX (80.9B) exceeds total call GEX (75.1B), meaning dealers are positioned in a way that creates more downside acceleration than upside momentum. This aligns with the institutional decision to SELL calls rather than buy them.
📊 Implied Move Analysis
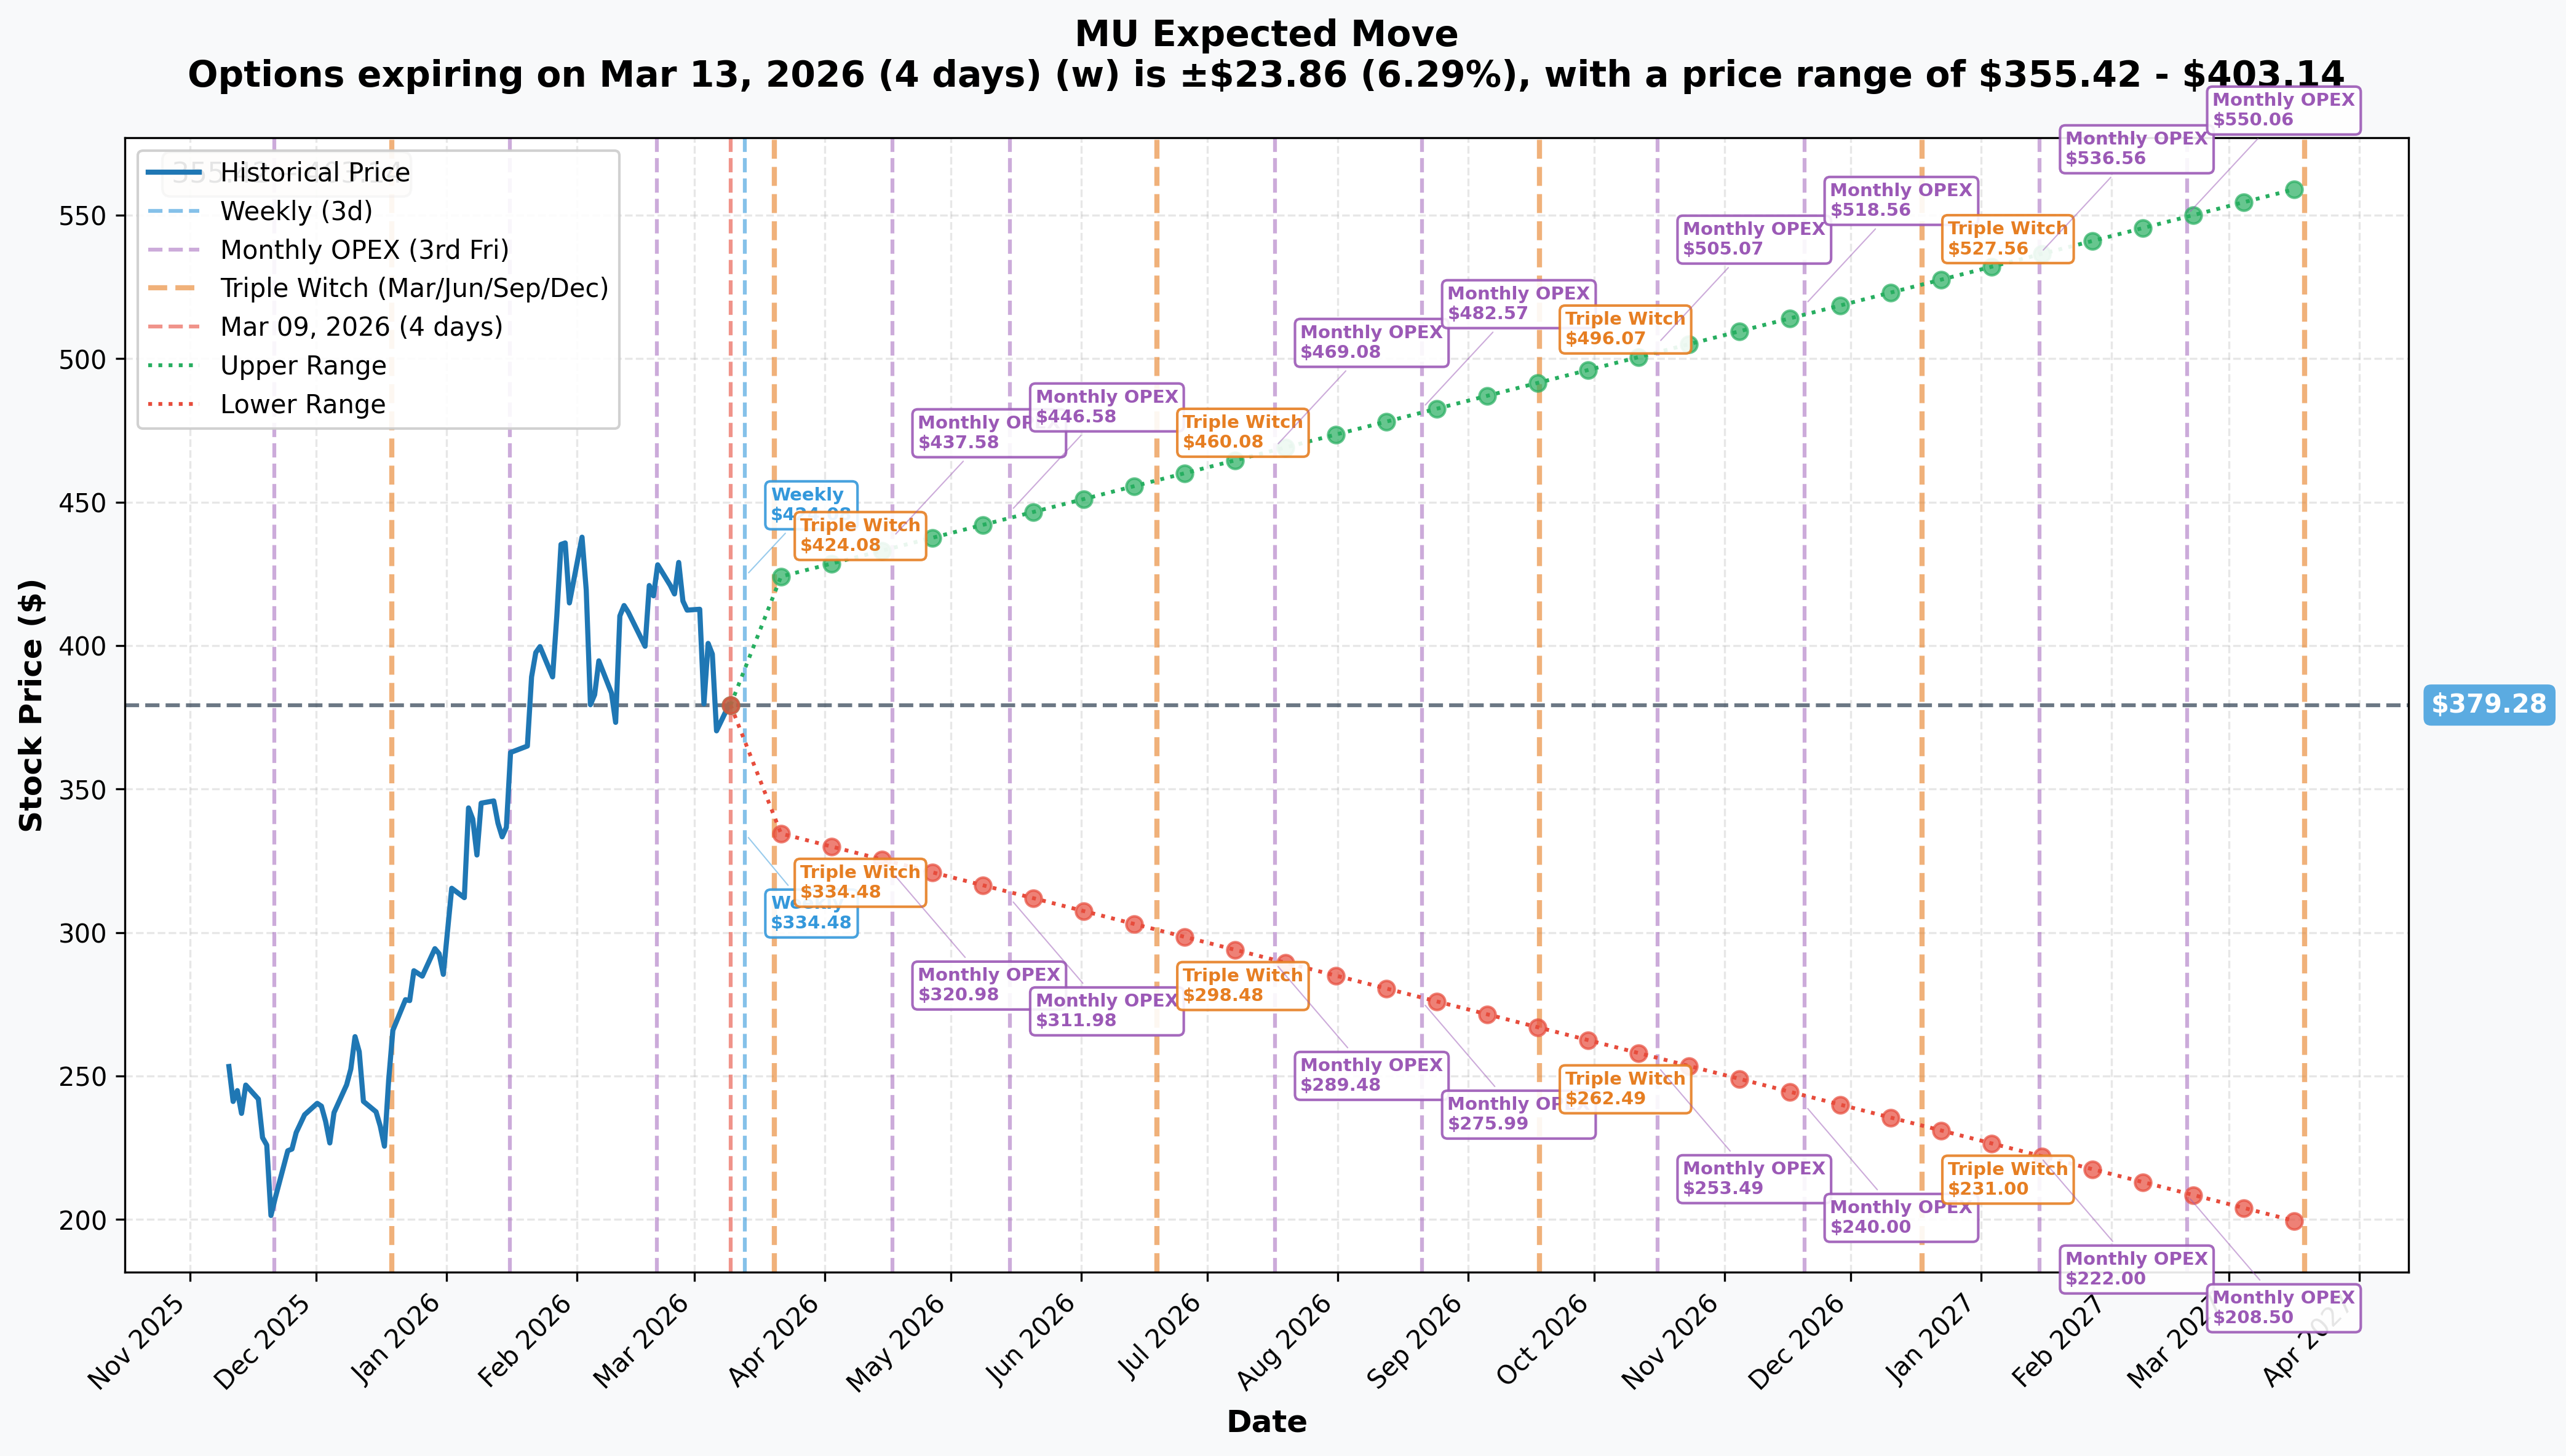
Current Price: ~$379.28
The options market is pricing in substantial moves across multiple timeframes:
📅 Weekly (Mar 13): +/-6.29% ($23.86)
- Range: $355.42 - $403.14
- Moderate volatility expected even before earnings
📅 Monthly OPEX / Triple Witch (Mar 20): +/-11.72% ($44.43)
- Range: $334.85 - $423.71
- THIS IS THE EARNINGS WINDOW -- FQ2 reports March 18, two days before March OPEX
- The upper band at $423.71 sits well below the $480 call strike -- market is NOT pricing a move that large in the near term
- Lower band at $334.85 aligns almost perfectly with the $340 gamma support level
📅 Jan 2027 LEAPS (matching the trade expiration): +/-47.7% ($180.90)
- Range: $198.38 - $560.18
- The $480 strike sits within the upper half of this range ($480 = +26.6%)
- The $510 strike is also within range ($510 = +34.5%)
- These strikes are achievable on a 10-month horizon but require SUSTAINED bullish momentum
🧠 Strategic Implications:
Here is the key insight: the LEAP implied move range goes as high as $560, but the call seller chose $480 and $510. They are NOT betting MU goes to zero -- they are betting MU does NOT sustain a rally above $480 for 10 months. Given that MU traded at $455.50 at its recent high, this is essentially a bet that MU does NOT break above its all-time high by a meaningful margin.
For context, the January 2027 monthly OPEX implied upper bound is $536.56. The $480 strike sits at the 73rd percentile of the implied distribution -- meaning the market assigns roughly a 27% probability that MU reaches $480 by January 2027. The call seller is betting on the ~73% probability side. This is a high-probability trade with defined but potentially large risk if wrong.
🎪 Catalysts
🔮 What Already Happened
💥 FQ1 2026 Blowout Earnings (December 17, 2025)
Micron delivered record revenue and significant margin expansion across all business units:
- Revenue: $13.64B (+57% YoY) vs $8.71B -- beat consensus by $640M
- GAAP EPS: $4.60 (+290% YoY)
- Gross Margin: ~55% (up 33 percentage points YoY)
- Operating Cash Flow: $8.41B
- HBM Revenue: Quarterly record, Cloud Memory Business Unit hit record at 40% of total sales
Management issued FQ2 guidance calling for "substantial records across revenue, gross margin, EPS and free cash flow" -- specifically $18.70B revenue (+132% YoY), 67% gross margins, and $8.19 EPS.
🏭 India Assembly Facility Grand Opening (February 28, 2026)
Micron opened India's first semiconductor assembly and test facility in Sanand, Gujarat -- a $2.75B investment with 500,000+ sq ft of cleanroom space. Commercial production has begun with the first shipment delivered to Dell.
💾 256GB LPDRAM SOCAMM2 Module Launch (March 3, 2026)
Micron shipped the world's first 256GB LPDRAM SOCAMM2 module, developed in collaboration with NVIDIA. The module improves LLM inference time-to-first-token by over 2.3x for key-value cache offload -- a critical metric for AI data centers.
📊 Crucial Consumer Business Exit (December 3, 2025)
Micron announced it will exit the Crucial consumer brand, redirecting supply capacity toward higher-margin enterprise and data center customers. This signals management conviction that enterprise AI demand will sustain premium pricing.
🔜 What's Coming Next
🚨 FQ2 2026 Earnings Report -- March 18, 2026 (9 DAYS AWAY!)
This is the single most important near-term catalyst. The earnings call webcast is scheduled March 18 at 2:30 PM MT.
| Metric | Company Guidance | Street Consensus |
|---|---|---|
| Revenue | $18.70B +/- $400M | ~$18.7B |
| EPS (GAAP) | $8.19 +/- $0.20 | $8.42 - $8.61 |
| Gross Margin | 67.0% +/- 1.0% | ~67% |
Key metrics to watch:
- HBM revenue run-rate (was ~$8B annualized) -- how fast is it accelerating?
- FQ3 guidance -- will signal whether margin expansion is SUSTAINING or peaking
- Data center revenue mix (was 40%) -- is it still growing?
- Any commentary on HBM4 yield and NVIDIA Vera Rubin qualification
- Updated FY2026 revenue guidance -- consensus is ~$76B for the full year
If Micron beats AND guides higher, the stock could reclaim $400+ quickly. If they disappoint on FQ3 guidance or signal peak margins, the selling could accelerate.
📈 S&P 100 Index Inclusion -- March 23, 2026 (14 DAYS AWAY!)
Micron will be added to the S&P 100 index effective before market open on March 23:
- Triggers mandatory buying from passive index funds that track the S&P 100
- Added alongside Lam Research, Applied Materials, and GE Vernova
- Historically, index inclusions provide near-term price support
- This happens just 5 days AFTER earnings -- a potential one-two punch catalyst
🤖 HBM4 Volume Production Ramp -- Q2 Calendar 2026
Micron confirmed HBM4 volume ramp in Q2 CY2026, one quarter ahead of schedule:
- Yield improvement progressing faster than HBM3E
- Aligns with NVIDIA Vera Rubin platform entering full production
- Entire 2026 HBM supply already committed under long-term contracts
📊 DRAM Pricing Tailwinds Continue
Industry conditions remain extremely tight:
- DRAM ASPs were up ~20% sequentially and ~30% YoY in FQ1
- Samsung raised DRAM chip list prices ~60% since September 2025
- Current supply meets only 50-66% of customer needs
- Industry forecasts call for another ~40% increase in memory prices in CY2026
🎲 Price Targets & Probabilities
Based on the gamma structure, implied moves, catalyst calendar, and the institutional call selling, here is how I see MU playing out:
🚀 Bull Case: $420-$455 by Jan 2027 (30-35% Probability)
Path to $420+:
- FQ2 earnings beat AND strong FQ3 guide on March 18
- S&P 100 inclusion buying wave on March 23
- HBM4 ramp validates in Q2 CY2026
- Memory pricing sustains through year-end
What This Means for the Trade: Even at $455 (the previous 52-week high), both call strikes remain out of the money. The seller keeps ALL $17.4M in premium. This is the core thesis -- MU can rally 20% from here and the trade STILL wins. The seller only starts losing money above $480 on the lower strike, which represents a +27% move.
⚖️ Base Case: $370-$420 Range Through 2026 (40-45% Probability)
The Consolidation Thesis: MU delivers strong earnings but forward guidance signals peak margins approaching. The stock trades in a wide band as the market debates whether the AI memory supercycle sustains or if we are near the top. Memory cycles historically peak with record margins -- and 67% gross margin is unprecedented for Micron.
For the Call Seller: This is the DREAM scenario. The stock stays well below $480, and all $17.4M in premium decays to zero over 10 months. They collect every penny.
😰 Bear Case: Below $350 (20-25% Probability)
The Peak Cycle Scenario: FQ2 meets expectations but FQ3 guidance disappoints. Margins normalize. The $20B CapEx cycle (combined with Samsung's 50% capacity increase and SK Hynix's 4x infrastructure investment) creates oversupply fears. Some bearish DCF models suggest fair value near $163, implying severe downside if the AI premium unwinds.
For the Call Seller: Even better -- the calls expire worthless and MU drops. They keep all $17.4M AND benefit from any hedged stock decline.
💥 Tail Risk: Above $480 by Jan 2027 (~15% Probability)
What Would Need to Happen:
- HBM4 ramp exceeds ALL expectations
- Memory pricing goes parabolic
- AI capex spending re-accelerates in H2 2026
- MU achieves $40+ EPS in FY2027 (consensus is ~$34 for FY2026)
For the Call Seller: This is where it HURTS. At $480, the lower strike starts losing money. At $510, the upper strike joins in. If both are naked shorts (no underlying stock), losses are theoretically unlimited. However, given the institutional size, this is almost certainly a covered position where gains on the stock offset losses on the calls.
💡 Trading Ideas
🛡️ Conservative: Sell Put Spreads at Gamma Support
Strategy: Sell a $360/$350 Bull Put Spread expiring April 17 (Monthly OPEX)
Setup:
- Sell $360 Put at ~$12.00
- Buy $350 Put at ~$8.50
- Net Credit: ~$350 per spread
- Max Risk: $650
- Breakeven: $356.50
Why This Works: The gamma data shows MASSIVE support at $350 (10.6B total GEX) and $370 (6.4B). You are selling premium behind two walls of dealer support. With FQ2 earnings expected to deliver 132% YoY revenue growth and S&P 100 inclusion creating a buying floor, the probability of MU crashing below $356.50 by April is low (~20-25%).
Risk Management:
- Close at 50% max profit ($175 per spread)
- Set stop loss if MU breaks below $360 with conviction
- Position size: max loss = 1-2% of portfolio
Who This Is For: Income-oriented traders who want to capitalize on elevated pre-earnings IV while staying behind strong gamma support levels.
⚖️ Balanced: Post-Earnings Iron Condor
Strategy: Iron Condor around earnings, expiring April 17
Setup:
- Sell $340 Put / Buy $330 Put (Bull Put Spread leg)
- Sell $430 Call / Buy $440 Call (Bear Call Spread leg)
- Net Credit: ~$300-$400 per iron condor (estimate based on current IV)
- Max Risk: ~$600-$700
- Breakeven: ~$336 on the downside, ~$434 on the upside
Why This Works: The implied move for the March 20 OPEX is +/-11.72%, giving a range of $334.85-$423.71. Your iron condor wings sit OUTSIDE this range. You are selling the idea that the market has correctly priced the earnings move. The $17.4M call seller clearly agrees that $430+ is unlikely -- you are aligning with the whale.
Risk Management:
- Enter AFTER FQ2 earnings report (March 18) when IV crush works in your favor
- Close at 50% max profit to lock in gains
- If the stock breaches either short strike by more than $5, close the losing side
Who This Is For: Volatility sellers who want to take advantage of elevated pre-earnings IV and the institutional thesis that MU stays range-bound. You are betting on IV crush, not direction.
🚀 Aggressive: Pre-Earnings Bull Call Spread
Strategy: Buy a $380/$400 Call Debit Spread expiring March 20 (through earnings)
Setup:
- Buy $380 Call at ~$18.00
- Sell $400 Call at ~$9.00
- Net Debit: ~$900 per spread
- Max Profit: $1,100
- Breakeven: $389.00
Why This Works: You are betting AGAINST the call seller's broader thesis. The gamma data shows $380 is immediate resistance and $400 is the big magnet (13.3B GEX). If FQ2 earnings deliver a blowout with strong FQ3 guidance, the S&P 100 inclusion buying wave on March 23 could push MU back toward $400+. 93% of analysts rate MU a Buy or Strong Buy with an average price target of $349-$372.
Reality Check: This is a CATALYST-DEPENDENT trade. Without an earnings beat AND guidance raise, MU is unlikely to reclaim $400 in the current macro environment. The implied move for March 20 gives a range up to $423.71 -- so $400 is achievable if the quarter delivers.
Risk Management:
- Only enter this if you have a bullish earnings thesis
- Cut losses immediately if FQ2 misses or guidance disappoints
- Take profits at $395-$400 rather than holding for max gain
- Position size: risk no more than 3-5% of options portfolio
Who This Is For: Directional traders who believe the pullback to $378 is a gift before a monster earnings report. You are buying the dip into a confirmed growth story but using a spread to define your risk.
⚠️ Risk Factors
📉 Peak Cycle and Margin Normalization Risk
Memory cycles are brutally cyclical -- that is not a cliche, it is a law of semiconductors. Analysts anticipate earnings and margins peaking in FY2026 or early FY2027, with a downturn thereafter. Gross margins at 67% are historically unprecedented for Micron. The industry has NEVER sustained margins this high for more than a few quarters. If HBM pricing normalizes or conventional DRAM supply catches up to demand, margin compression could be severe. Some bearish DCF models suggest fair value near $163 -- that is a 57% haircut from current levels.
🏭 Industry CapEx Creating Future Oversupply
Micron raised FY2026 CapEx to $20B (45% increase over FY2025). Samsung is boosting production capacity by 50%. SK Hynix is increasing infrastructure investment by 4x. Historically, synchronized CapEx waves across the memory industry have ALWAYS produced oversupply. This is the single biggest structural risk for MU over the next 12-18 months.
🇨🇳 China Market Headwinds
China's ban on Micron products in critical infrastructure remains in effect. Micron is reportedly preparing to exit China's server memory market entirely. Mainland China and Hong Kong generated ~25% of Micron's $30.8B in FY2025 revenue -- losing this market is a material headwind, even with AI demand filling the gap.
🚫 Export Restriction Escalation
Bloomberg reported on March 6 that the U.S. is considering requiring export licenses for AI processors from NVIDIA and AMD. Since Micron's HBM chips are COMPONENTS in these processors, new licensing requirements could create indirect sales headwinds. This news already contributed to MU's -6.74% decline on March 6.
📱 Consumer Demand Weakness
IDC projects the global smartphone market will shrink 12.9% in 2026 -- the sharpest drop on record. NAND recovery remains sluggish with only 5-10% price increases expected. While data center demand is booming, the consumer side is struggling.
🌍 Macro and Geopolitical Turbulence
Weak February jobs data (92,000 losses vs 50,000 expected) raises recession concerns. Geopolitical tensions continue to create volatility. These factors already caused a ~17% pullback from the 52-week high. Any further deterioration could push MU below key support levels.
🎢 Earnings Volatility Works Both Ways
MU has an implied move of +/-11.72% around the March 18 earnings date. That is a $44 swing in either direction. While the call seller benefits from selling premium ahead of this event, anyone holding directional positions needs to understand that a -12% move ($45 lower to ~$334) is priced as equally likely as a +12% move ($45 higher to ~$424). Do not mistake the bullish fundamental story for certainty about the stock price reaction.
🎯 The Bottom Line
Here is what $17.4 MILLION in LEAP call selling tells us about how serious money is thinking about Micron right now:
The Message:
- ✅ The trader is NOT bearish on MU fundamentals -- they chose strikes 27-35% out of the money
- ✅ They DO believe there is a ceiling on how far MU can rally over the next 10 months
- ✅ They are harvesting rich LEAP premium ahead of a massive volatility event (FQ2 earnings in 9 days)
- ✅ The timing is strategic -- selling LEAPs when IV is inflated by near-term earnings uncertainty lets them collect maximum premium
- ✅ This is almost certainly a covered call or overwrite against a massive long stock position, NOT a naked short
What's Fascinating: The $480 strike represents a belief that MU will not sustain a move above $480 through January 2027. For context, MU's 52-week high was $455.50. So the trader is saying: "Even in the best case, MU does not break meaningfully above its all-time high and hold there for 10 months." Given that memory cycles historically peak and reverse, this is a VERY defensible thesis.
The Z-Score of 56.49 tells us this is not normal institutional activity -- this is a one-of-a-kind positioning event. When someone puts $17.4M on the line at exactly the same second in two LEAP strikes, they have done their homework.
The Setup:
- Earnings on March 18 will be the near-term catalyst that determines direction
- S&P 100 inclusion on March 23 provides a structural bid
- HBM4 ramp in Q2 CY2026 is the medium-term driver
- Peak-cycle risk and CapEx-driven oversupply are the longer-term concerns
Your Action Plan:
🟢 If You're Bullish: Buy defined-risk call spreads ($380/$400) through earnings if you believe FQ2 will deliver a guidance raise. The pullback to $378 gives you better entry than $400+ two weeks ago. But use spreads -- do not buy naked calls into an 11.72% implied move.
🟡 If You're Neutral/Income-Seeking: Follow the whale. Sell put spreads at $360/$350 to collect premium behind massive gamma support. Or wait for post-earnings IV crush and set up an iron condor. The institutional thesis is that MU stays in a range -- and they are backing it with $17.4M.
🔴 If You're Concerned About Peak Cycle: This trade validates your thesis. The biggest institutional flow of the day is SELLING upside above $480. If you own MU stock and worry about a cycle peak, writing covered calls at $480-$510 in January 2027 is exactly what the smart money just did. You keep your shares, collect premium, and cap your upside at a level that is already above the all-time high.
Mark Your Calendar:
- 📅 March 18: FQ2 2026 Earnings (2:30 PM MT) -- THE catalyst
- 📅 March 20: Monthly OPEX / Triple Witch -- massive options expiration
- 📅 March 23: S&P 100 inclusion effective date -- passive buying wave
- 📅 Q2 CY2026 (Apr-Jun): HBM4 volume production ramp
- 📅 Late June 2026: FQ3 2026 Earnings -- will confirm or deny peak-cycle thesis
- 📅 January 15, 2027: LEAP call expiration -- the final verdict on this $17.4M trade
Final Thought:
When someone sells $17.4 MILLION in LEAP calls 9 days before a potentially record-breaking earnings report, they are making a very specific statement: "I believe in Micron's story, but I also believe the market has priced in the best-case scenario -- or close to it." They are not betting against MU. They are betting that MU's upside is bounded. At ~11x forward earnings with a 67% gross margin, MU is either the cheapest AI play on the planet or a peak-cycle trap. This trader just told you which side they are on -- and they put $17.4M behind it.
The next 9 days will tell us a lot. Trade accordingly.
⚠️ Disclaimer: Options trading involves substantial risk and is not suitable for all investors. This analysis is for educational and informational purposes only and should not be construed as financial advice. The trades discussed involve significant risk of loss. Past performance is not indicative of future results. Always conduct your own due diligence and consider consulting with a licensed financial advisor before making investment decisions. The author may hold positions in securities discussed.
📚 Resources:
- Company Information: Micron Investor Relations
- Catalyst Research: Multiple financial news sources (see inline citations)
🔗 Related Resources:
Analysis prepared March 9, 2026 | Market conditions subject to change