January 14, 2026 | Institutional Flow Detected
The Quick Take
Someone just dropped $6.4 million in premium betting on Nucor's next move - and the positioning is interesting. We're seeing a $3.7M put purchase paired with $2.7M in call selling, suggesting a major player is either hedging a large stock position or setting up for downside ahead of Q4 earnings on January 26. With NUE trading at 52-week highs near $172, this is the kind of defensive repositioning that deserves attention.
Company Overview
Nucor Corporation (NYSE: NUE) is America's largest steel producer and recycler, operating under the "Steel Works, Blast Furnaces & Rolling Mills" sector.
| Metric | Value |
|---|---|
| Market Cap | $38.8B |
| Current Price | $171.48 - $172.58 |
| 52-Week Range | $97.59 - $172.78 |
| Sector | Steel Works & Rolling Mills |
Nucor manufactures sheet steel, plate steel, structural steel, and bar steel using electric arc furnace technology - a lower-cost, more flexible approach than traditional blast furnaces. They're particularly well-positioned for the data center construction boom, supplying 95%+ of steel products used in AI infrastructure builds.
The Option Flow Breakdown
Trade Details
| Time | Symbol | Buy/Sell | Call/Put | Expiration | Premium | Strike | Volume | OI | Size | Spot Price | Option Price | Option Symbol |
|---|---|---|---|---|---|---|---|---|---|---|---|---|
| 10:57:41 | NUE | BUY | PUT | 2026-06-18 | $3.7M | $170 | 2,500 | 45 | 2,500 | $171.10 | $14.90 | NUE20260618P170 |
| 11:18:03 | NUE | SELL | CALL | 2026-03-20 | $1.6M | $165 | 2,500 | 3,100 | 1,165 | $171.31 | $14.10 | NUE20260320C165 |
| 11:18:03 | NUE | SELL | CALL | 2026-03-20 | $1.1M | $165 | 1,300 | 3,100 | 776 | $171.31 | $14.10 | NUE20260320C165 |
Total Premium Traded: $6.4M
What This Actually Means
Let me break this down in plain English:
The $3.7M June $170 Put Purchase:
- This is extremely unusual volume - we see trades this size maybe a few times per year
- Someone paid a hefty premium for downside protection through mid-June
- The $170 strike is just below the current price (~$172), so this is close to at-the-money
- High Vol/OI ratio signals this is brand new positioning, not rolling old positions
The $2.7M March $165 Call Sales:
- Sold in two blocks within the same minute
- Highly unusual activity levels
- Selling calls at $165 (below current price!) suggests they're comfortable capping upside
- This brings in premium to offset the cost of those puts
Translation: This looks like a sophisticated hedge or collar on a large stock position. The trader is saying "I own a lot of NUE stock, I'm happy to cap my gains at $165, and I really want protection if this thing drops through $170."
Technical Setup / Chart Check-Up
YTD Chart Analysis
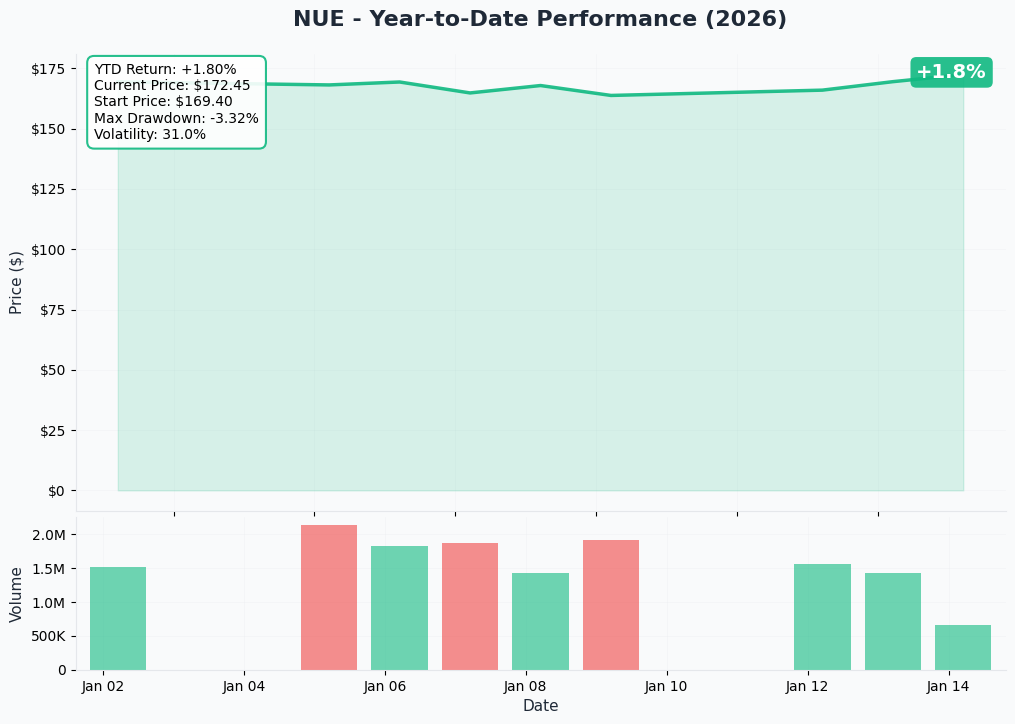
NUE has been on a tear, rallying 45%+ over the past year and hitting new 52-week highs at $171.99 on January 14. The stock is currently trading just 12.2% below its all-time high of $195.42 from April 2024. This is strength - but also raises the question: how much juice is left?
Gamma-Based Support & Resistance Analysis
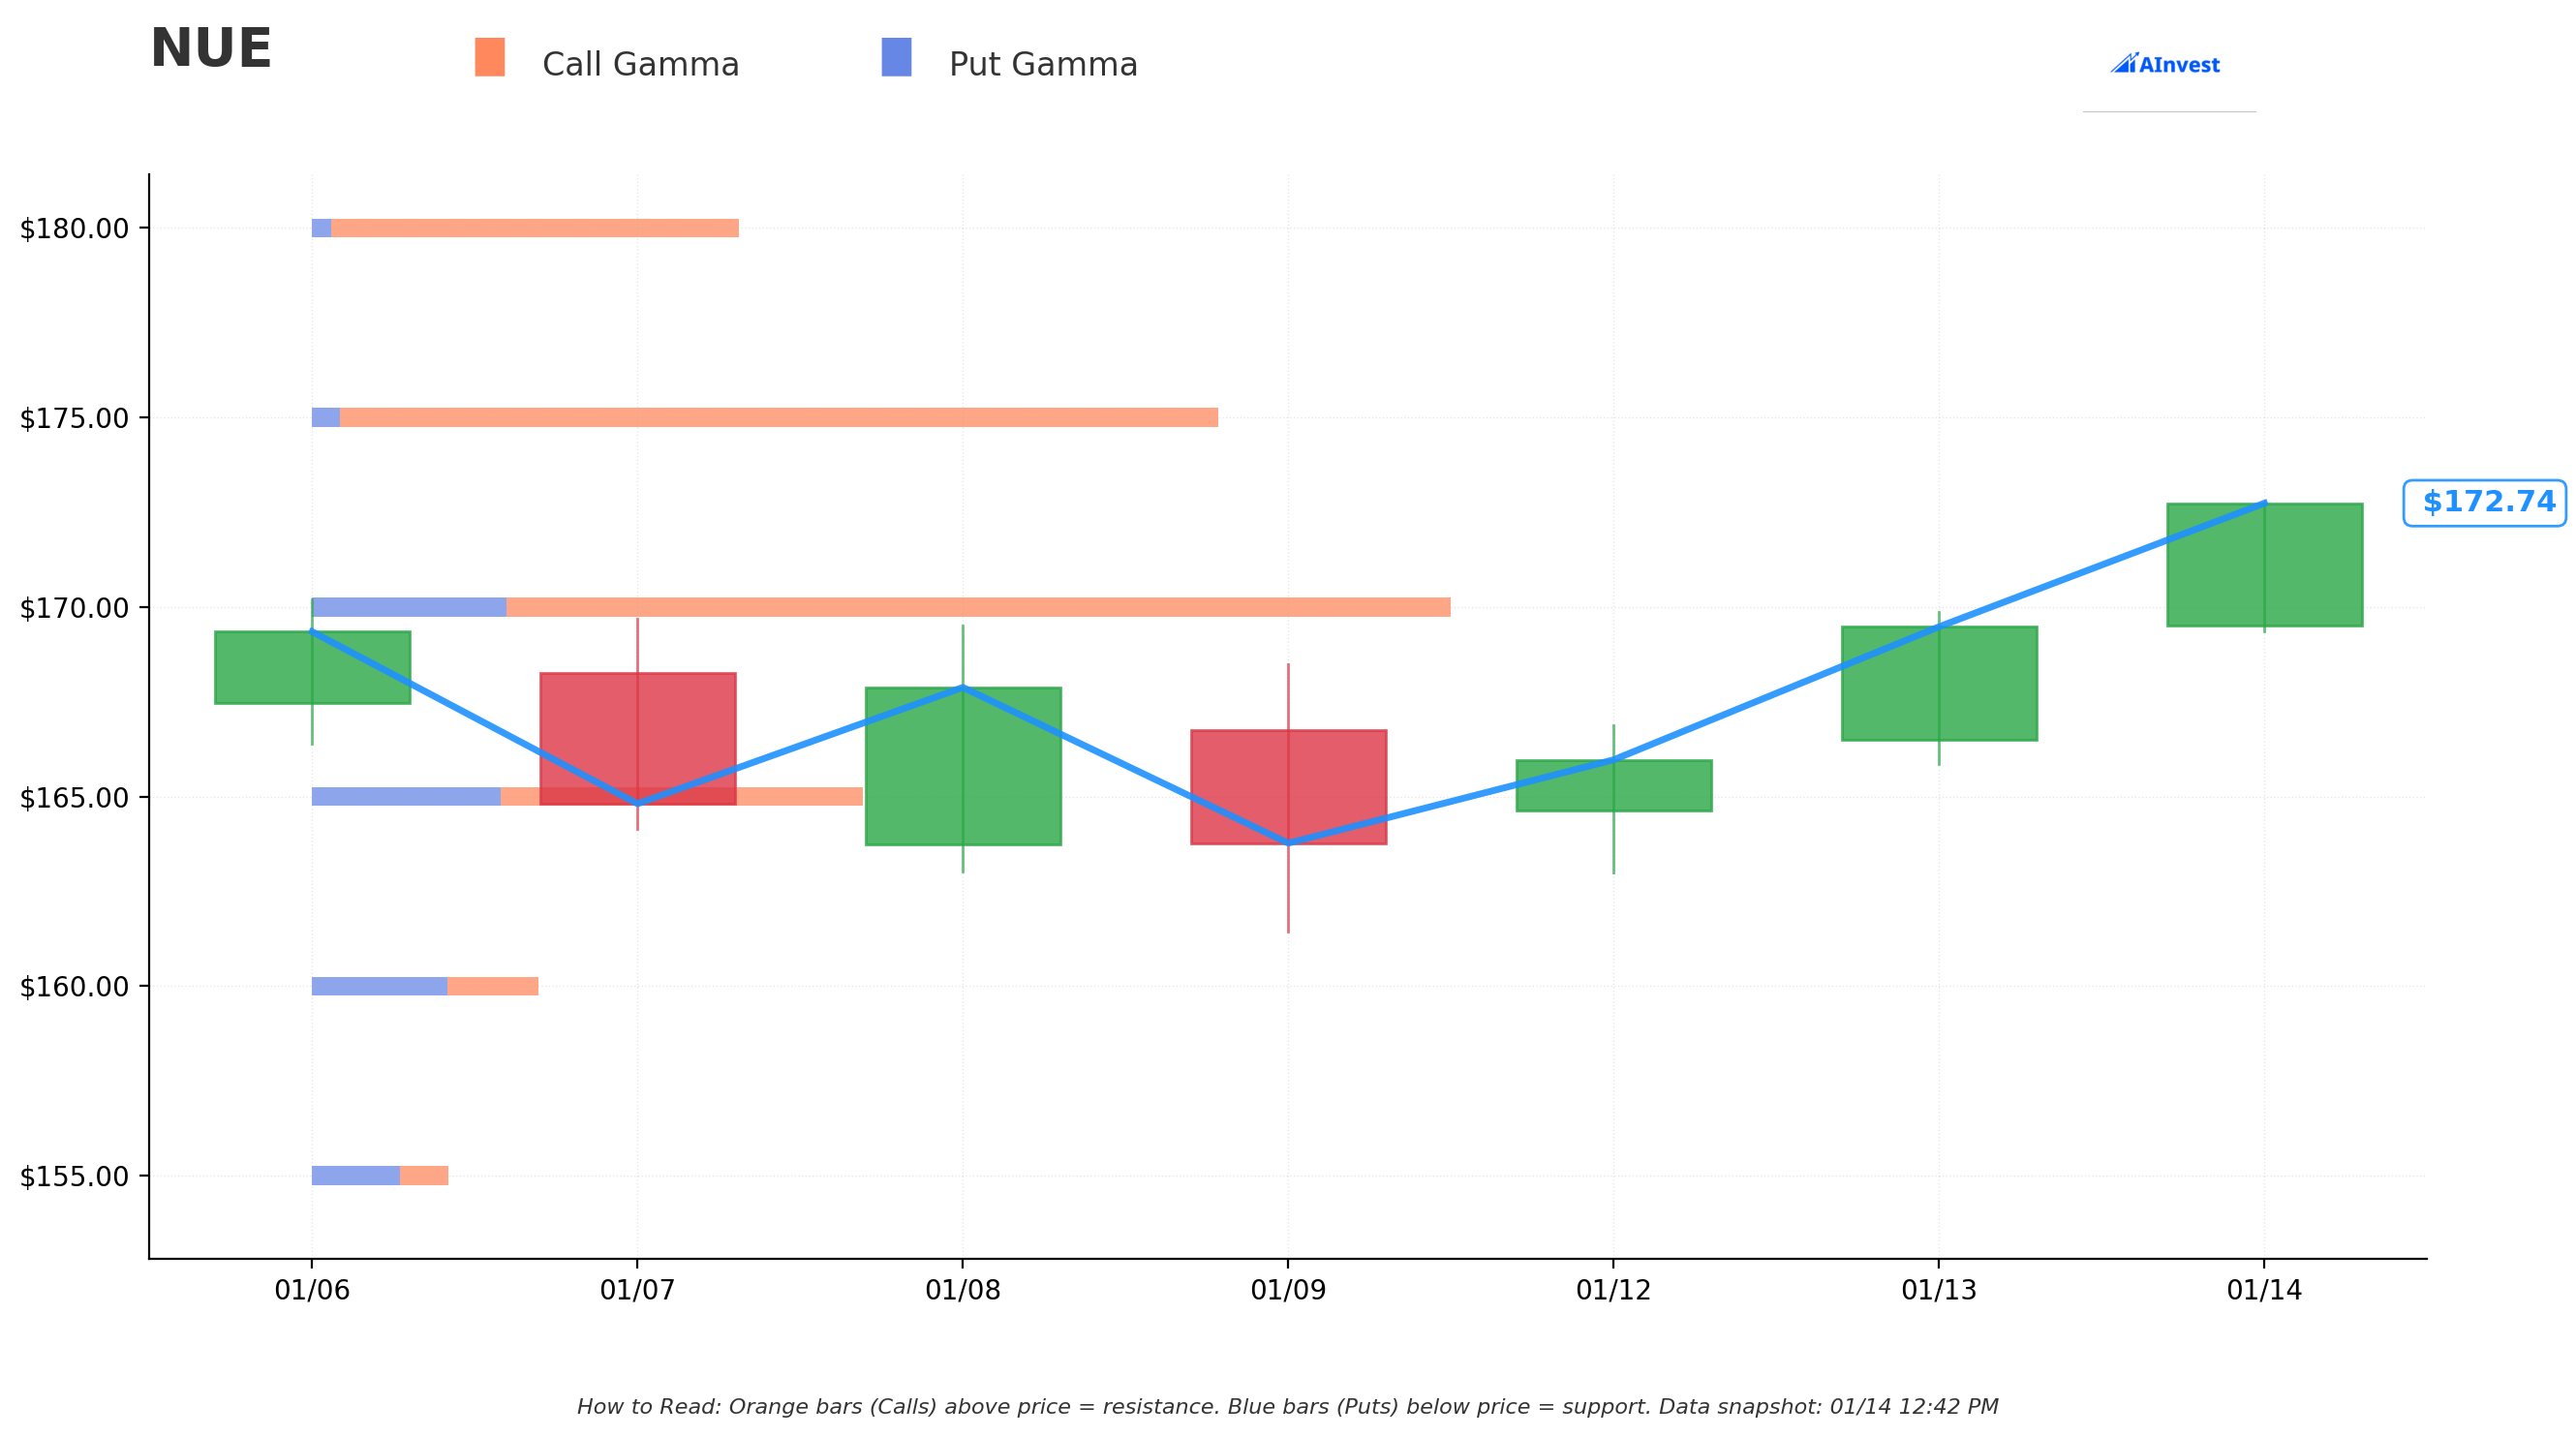
Current Price: $172.58
The gamma exposure (GEX) data shows where market makers are most exposed - and therefore where prices tend to "stick" or bounce:
Key Resistance Levels (Orange Bars):
| Strike | Distance | GEX Strength | What It Means |
|---|---|---|---|
| $175 | +1.4% | Strongest | Major call wall - expect turbulence here |
| $180 | +4.3% | Moderate | Secondary resistance |
| $185 | +7.2% | Light | If we break $180, this is next |
| $190 | +10.1% | Moderate | Upper target zone |
| $200 | +15.9% | Moderate | Dream scenario for bulls |
Key Support Levels (Blue Bars):
| Strike | Distance | GEX Strength | What It Means |
|---|---|---|---|
| $170 | -1.5% | Strongest | Major put activity - magnetic level |
| $165 | -4.4% | Strong | First real floor below $170 |
| $160 | -7.3% | Light | If $165 breaks, watch out |
| $155 | -10.2% | Light | Bear territory |
| $150 | -13.1% | Moderate | Worst-case floor |
Overall GEX Bias: Bullish (Call GEX of 9.56 vs Put GEX of 2.73)
The net positive gamma suggests market makers will likely buy dips and sell rips, which tends to compress volatility and keep prices pinned between major levels.
Implied Move Analysis
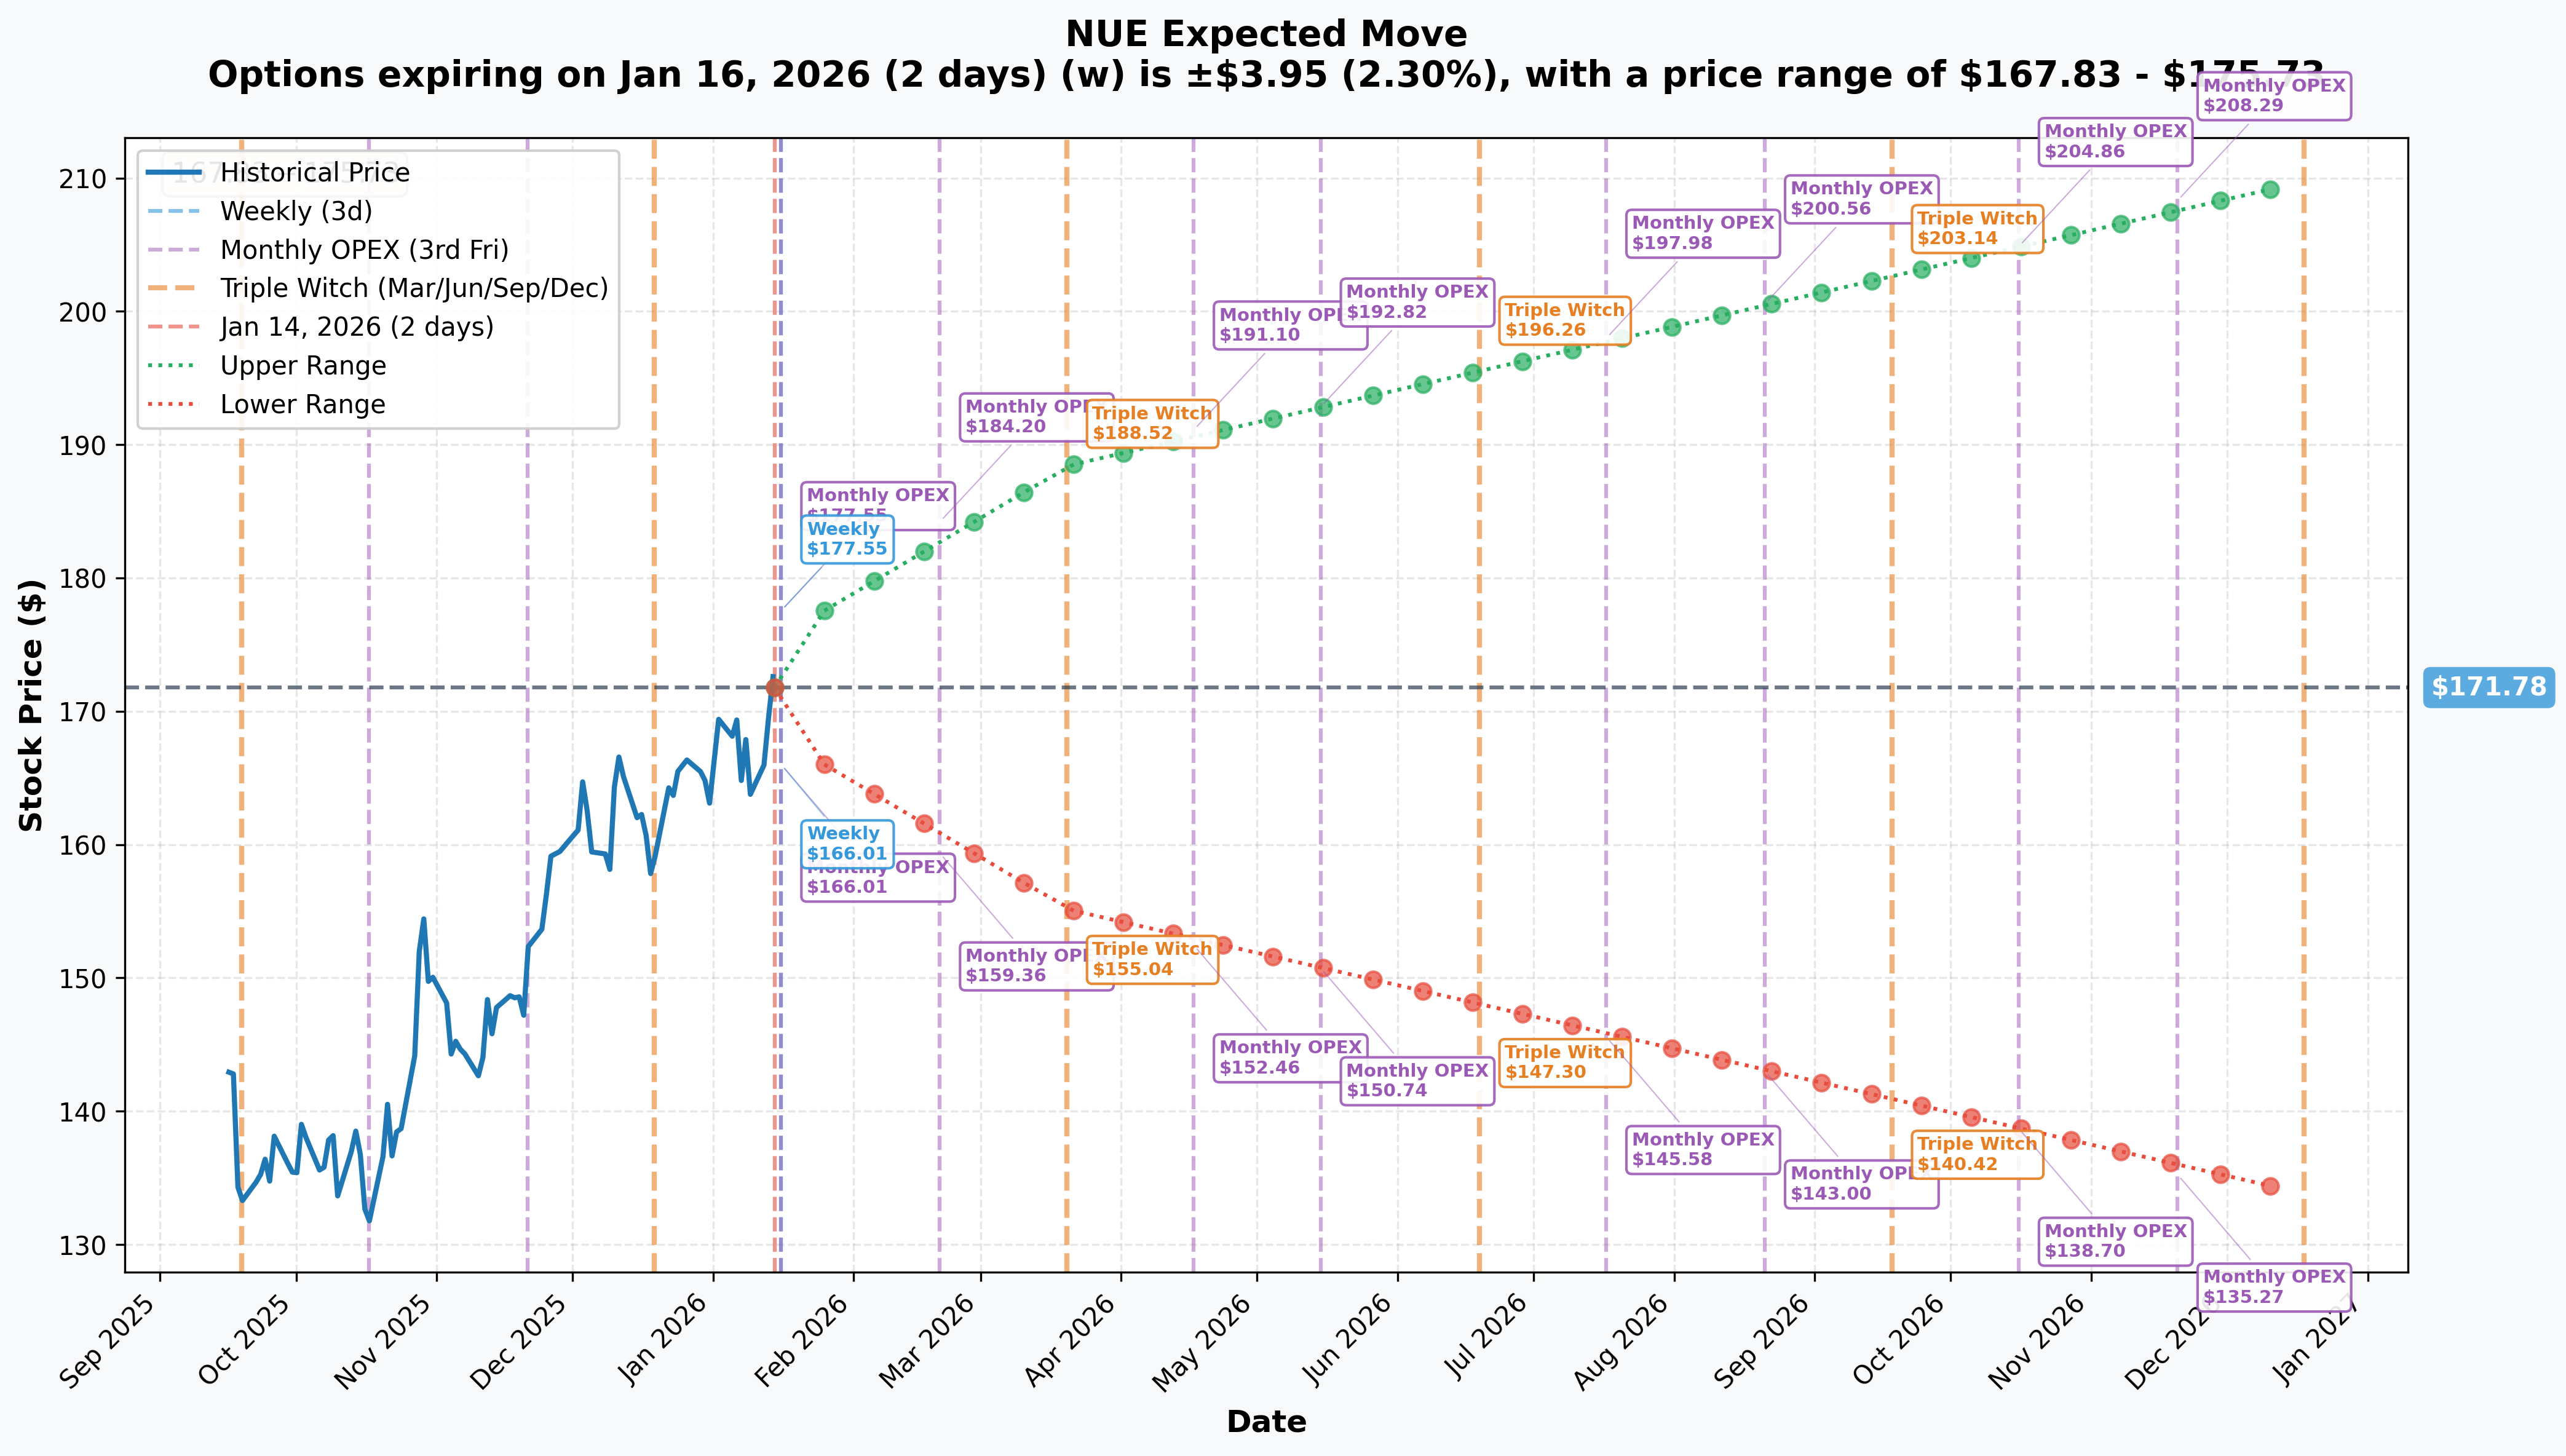
Based on current options pricing, here's what the market expects NUE to do:
| Timeframe | Expiration | Implied Move | Expected Range |
|---|---|---|---|
| Weekly | 2026-01-16 | ±2.3% | $167.83 - $175.73 |
| Quarterly (March OPEX) | 2026-03-20 | ±9.7% | $155.12 - $188.44 |
| LEAPS | 2026-12-18 | ±22.1% | $133.78 - $209.78 |
Current IV: 33-39% depending on expiration
Put/Call IV Skew: Puts are trading at higher IV than calls (41.99% vs 36.13% for weeklies), which confirms the market is paying up for downside protection.
Catalysts
Upcoming Events
| Date | Event | Why It Matters |
|---|---|---|
| Jan 26, 2026 | Q4 2025 Earnings (AMC) | Guidance was $1.65-$1.75 EPS vs $2.02 consensus |
| Jan 27, 2026 | Earnings Call @ 10AM ET | 2026 outlook, CFO search update |
| ~March 2026 | Q1 Dividend Ex-Date | $0.56/share |
| June 13, 2026 | COO Dave Sumoski Retires | Leadership transition complete |
| H2 2026 | West Virginia Mill Commissioning | $3.1B project comes online |
Recent Events (Already Happened)
Q3 2025 Results (October 27, 2025):
- EPS: $2.63 vs $2.22 consensus (+18.5% beat!)
- Revenue: $8.52B vs $8.22B consensus
- CEO called data center demand "white hot"
Q4 2025 Guidance (December 17, 2025):
- EPS guidance of $1.65-$1.75 (down 33-37% sequentially)
- Cited seasonal effects and fewer shipping days
- Backlogs "materially higher" than a year ago
Analyst Activity:
- Morgan Stanley downgraded to Equalweight (January 2026) citing "balanced risk-reward"
- JP Morgan maintains Overweight with $200 target
- Consensus: 24 analysts with "Strong Buy" rating
Insider Activity (Q4 2025):
- Net insider selling of $2.72M over past 90 days
- CEO Leon Topalian sold $789K in December
- No significant insider buying reported
Price Targets & Probabilities
Using gamma levels, implied moves, and catalyst timing:
Bull Case: $185-$200 (Probability: 25%)
What needs to happen:
- Q4 earnings beat the lowered $1.65-$1.75 guidance
- Management raises 2026 outlook citing data center demand
- Steel prices hold at $950/ton or higher
Key resistance: $175 (gamma wall), then $180, $185
Base Case: $165-$175 (Probability: 50%)
What this looks like:
- Earnings come in-line with guidance
- Stock consolidates after 45% run
- Market digests leadership transition news
Expected range aligns with: Gamma pinning zone between major support ($170) and resistance ($175)
Bear Case: $150-$160 (Probability: 25%)
What could go wrong:
- Q4 earnings miss even the lowered guidance
- Steel prices decline as tariff exemptions granted
- Manufacturing PMI stays below 50 (contraction)
- Insider selling accelerates
Key support: $170 (major put activity), then $165, $160
Trading Ideas
Conservative: "Sleep Well Strategy"
The Trade: Buy NUE 2026-06-18 $160 Put
| Detail | Value |
|---|---|
| Cost | ~$5.50 per contract ($550 total) |
| Max Loss | Premium paid ($550) |
| Breakeven | $154.50 |
| Target | Stock drops to $150 for ~200% gain |
Why this works: You're buying insurance below the major support levels. If earnings disappoint or steel prices crack, this put could 2-3x. If NUE keeps rallying, you lose the premium but sleep well knowing your portfolio is protected.
Best for: NUE shareholders who want cheap insurance through earnings.
Balanced: "The Collar Clone"
The Trade: Mimic the whale's positioning
- Buy 1x NUE 2026-03-20 $165 Put (~$6.00)
- Sell 1x NUE 2026-03-20 $180 Call (~$4.50)
| Detail | Value |
|---|---|
| Net Cost | ~$1.50 per spread ($150 total) |
| Max Profit | $13.50 if stock drops to $165 |
| Max Loss | Capped above $180 if assigned |
| Breakeven | $171.50 |
Why this works: You're essentially creating a risk reversal that profits if NUE pulls back while limiting cost. The sold call finances most of the put purchase.
Best for: Traders who think the 45% rally is overdone but don't want to pay full premium for puts.
Aggressive: "Earnings Fade Play"
The Trade: Buy NUE 2026-01-31 $170 Put
| Detail | Value |
|---|---|
| Cost | ~$3.00 per contract ($300 total) |
| Max Loss | Premium paid ($300) |
| Target | Stock drops 5-7% post-earnings |
| Potential Return | 200-300% if NUE falls to $162-165 |
Why this works: Q4 guidance was significantly lowered ($1.65-$1.75 vs Q3's $2.63). Even if they hit guidance, the sequential decline might disappoint. Plus, Morgan Stanley just downgraded the stock at these levels.
Best for: Traders willing to bet on post-earnings weakness with defined risk.
Risk Factors
For Bulls:
- Stock already up 45% - how much upside is left?
- Insider selling of $2.7M with no buying is a yellow flag
- ISM Manufacturing PMI at 47.9 (contraction territory)
- 53% of industry expects tariffs to drop to 25% by May
For Bears:
- Data center demand described as "white hot" with 30% YoY growth
- Section 232 tariffs at 50% provide pricing support
- Backlogs "materially higher" than a year ago
- JP Morgan has $200 target (17% upside)
For Everyone:
- Q4 earnings on January 26 could move the stock 5-10% either way
- Leadership transition (COO retiring June 2026) adds uncertainty
- Global steel overcapacity (165M metric tons planned capacity)
The Bottom Line
Real talk: This $6.4M options positioning tells a clear story - a sophisticated player with significant NUE exposure is buying protection while capping their upside. They're not panicking and selling stock, but they're also not sitting exposed with earnings 12 days away.
What to do:
If you own NUE: Consider following the whale's lead with some downside protection. The January $170 puts or March $165 puts give you insurance through earnings season.
If you're watching: Wait for post-earnings price action. A pullback to the $165-$170 gamma support zone could be a buying opportunity for this data center infrastructure play.
If you're bearish: The aggressive put play targeting post-earnings weakness offers defined risk with solid reward potential if the stock gives back some of its 45% rally.
Mark your calendar: January 26 after market close for Q4 earnings, January 27 at 10AM ET for the conference call.
Flow Summary Table
| Metric | Value |
|---|---|
| Total Premium | $6.4M |
| Net Direction | Bearish/Hedging |
| Key Levels | Support: $170, $165 / Resistance: $175, $180 |
| Next Catalyst | Q4 Earnings - January 26, 2026 |
| Options Bias | Put skew (higher IV on puts) |
Quick Links:
Disclaimer: Options trading involves significant risk and is not suitable for all investors. The information provided is for educational purposes only and should not be considered investment advice. Always conduct your own research and consider your financial situation before making any trading decisions. Past performance does not guarantee future results.
Report generated January 14, 2026