🚀 Massive $69M NVDA Call Bet: Someone Just Wagered on a 16% Move by March
🎯 Quick Take
A whale just dropped $69 million on 19,000 NVDA March $160 calls with the stock trading at $190.84. This isn't your typical flow. With Jensen Huang taking the CES stage in 10 days (NVIDIA CES 2026) and Q4 earnings dropping February 25th (Nasdaq earnings calendar), someone's betting big that NVDA doesn't just recover from its -11% drawdown from all-time highs—they're betting it rips higher. Let's decode what this trade tells us about the next 12 weeks.
📊 Option Flow Breakdown
The Trade:
| Field | Value |
|---|---|
| Date/Time | December 26, 2025 at 12:32:37 PM ET |
| Trade | 19,000 contracts BUY TO OPEN |
| Strike | $160 calls (12% in-the-money) |
| Expiration | March 20, 2026 (84 days out / quarterly triple witch) |
| Premium | $69,000,000 ($3,632 per contract) |
| Current Spot | $190.84 |
| Intrinsic Value | $30.84 per share ($3,084,000 per contract) |
| Time Premium | ~$548 per contract (~15% of total premium) |
| Strategy | Long Call (bullish directional) |
What This Means: This is a deep in-the-money (ITM) call purchase with 84 days to expiration. The buyer paid $69M for the right to control $3.05 billion worth of NVDA stock (19,000 contracts × 100 shares × $160 strike). Deep ITM calls behave almost like stock (delta ~0.90-0.95), so this is essentially a leveraged long position with defined risk.
Why This Structure?
- Capital Efficiency: Instead of buying 1.9M shares outright ($362M), they control the same upside for $69M
- Defined Risk: Max loss is capped at $69M vs. unlimited downside on stock
- Time Buffer: 84 days captures CES (Jan 5), Q4 earnings (Feb 25), and quarterly OPEX volatility
- Triple Witch Expiration: March 20, 2026 is a quarterly options expiration, historically bringing higher volume and volatility
Breakeven at Expiration: The trade breaks even if NVDA is above $196.32 at March expiration (strike + premium paid). That's only 2.87% above current levels—suggesting the buyer expects modest upside or is protecting existing exposure.
📈 Technical Setup
Key Technical Levels:
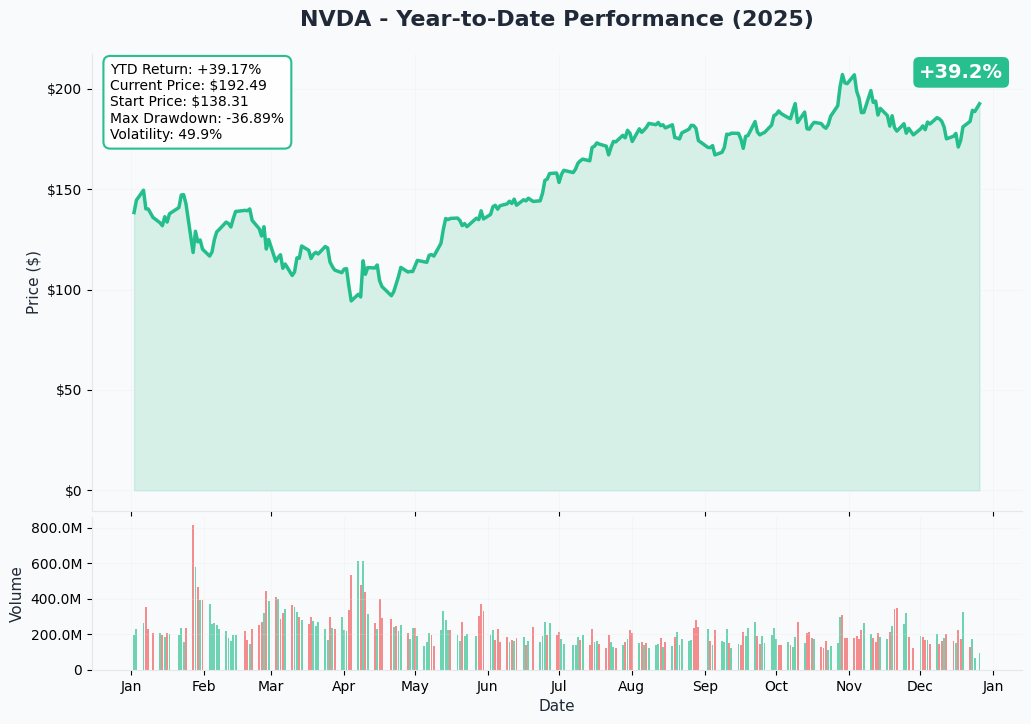
- All-Time High: $212.19 (October 29, 2025) (MacroTrends stock history)
- Current Price: $190.84
- Distance from ATH: -10.03%
- 52-Week Low: $86.62 (+120% from lows)
- YTD Performance: +39.44% (MarketBeat forecast)
Recent Price Action: NVDA peaked at $207.03 on October 29, 2025, then pulled back amid broader market rotation and China export concerns. December has seen consolidation in the $180-$195 range as traders digest the recent Groq technology licensing deal worth $20 billion and await CES catalysts.
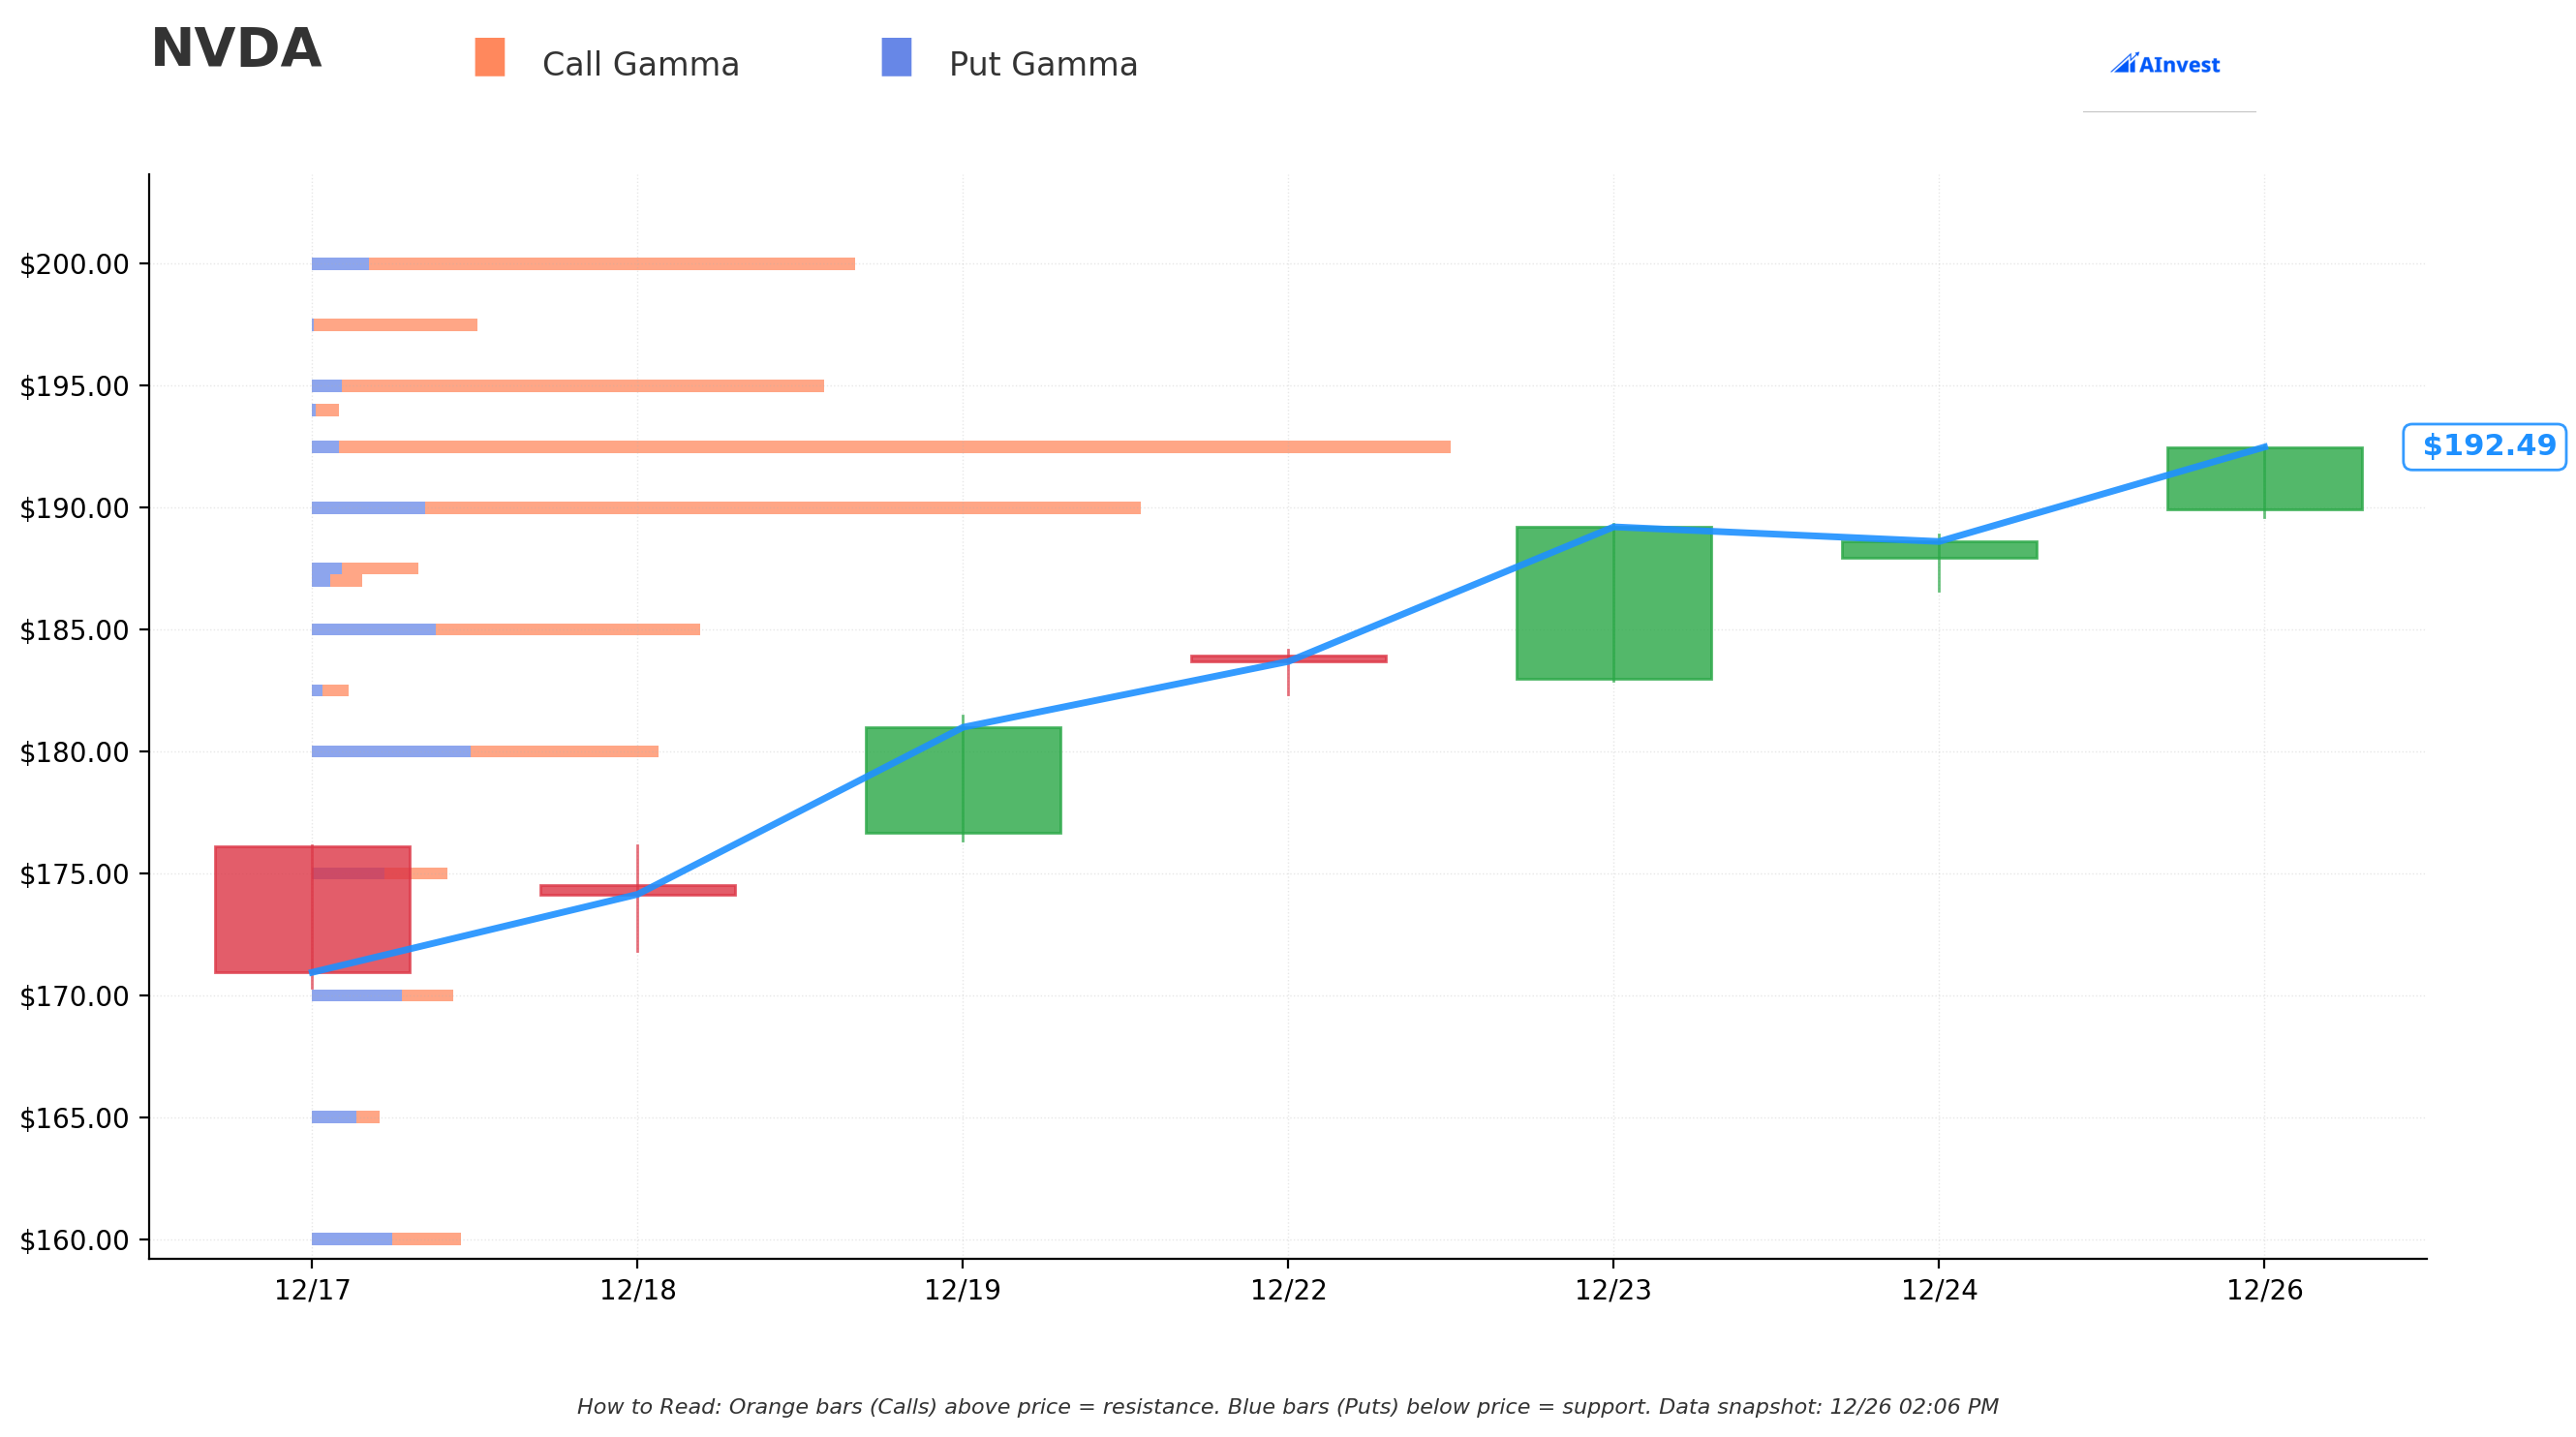
Gamma Exposure Levels (from live GEX data):
| Strike | Total Gamma | Type | Market Implication |
|---|---|---|---|
| $192.50 | 1.1053 | PUT | Strongest support—dealers long gamma |
| $195.00 | 0.8821 | PUT | Secondary support |
| $210.00 | 0.6543 | PUT | Upside magnet if broken |
| $190.00 | -0.4921 | CALL | Resistance—dealers short gamma |
| $200.00 | -0.3877 | CALL | Major resistance zone |
| $185.00 | -0.2654 | CALL | Downside call wall |
What Gamma Tells Us: The highest gamma strike at $192.50 (puts) creates a natural support zone—market makers who sold these puts are long gamma, meaning they'll buy stock as price falls toward $192.50 (providing support) and sell stock as price rises away from it (creating resistance). This pin effect keeps NVDA rangebound in the $190-$195 zone unless a catalyst breaks the equilibrium.
The call gamma walls at $190 and $200 represent resistance levels where dealers are short gamma (having sold calls). If NVDA pushes through $200, dealers will be forced to buy stock to hedge, potentially accelerating the move higher—a "gamma squeeze" scenario.
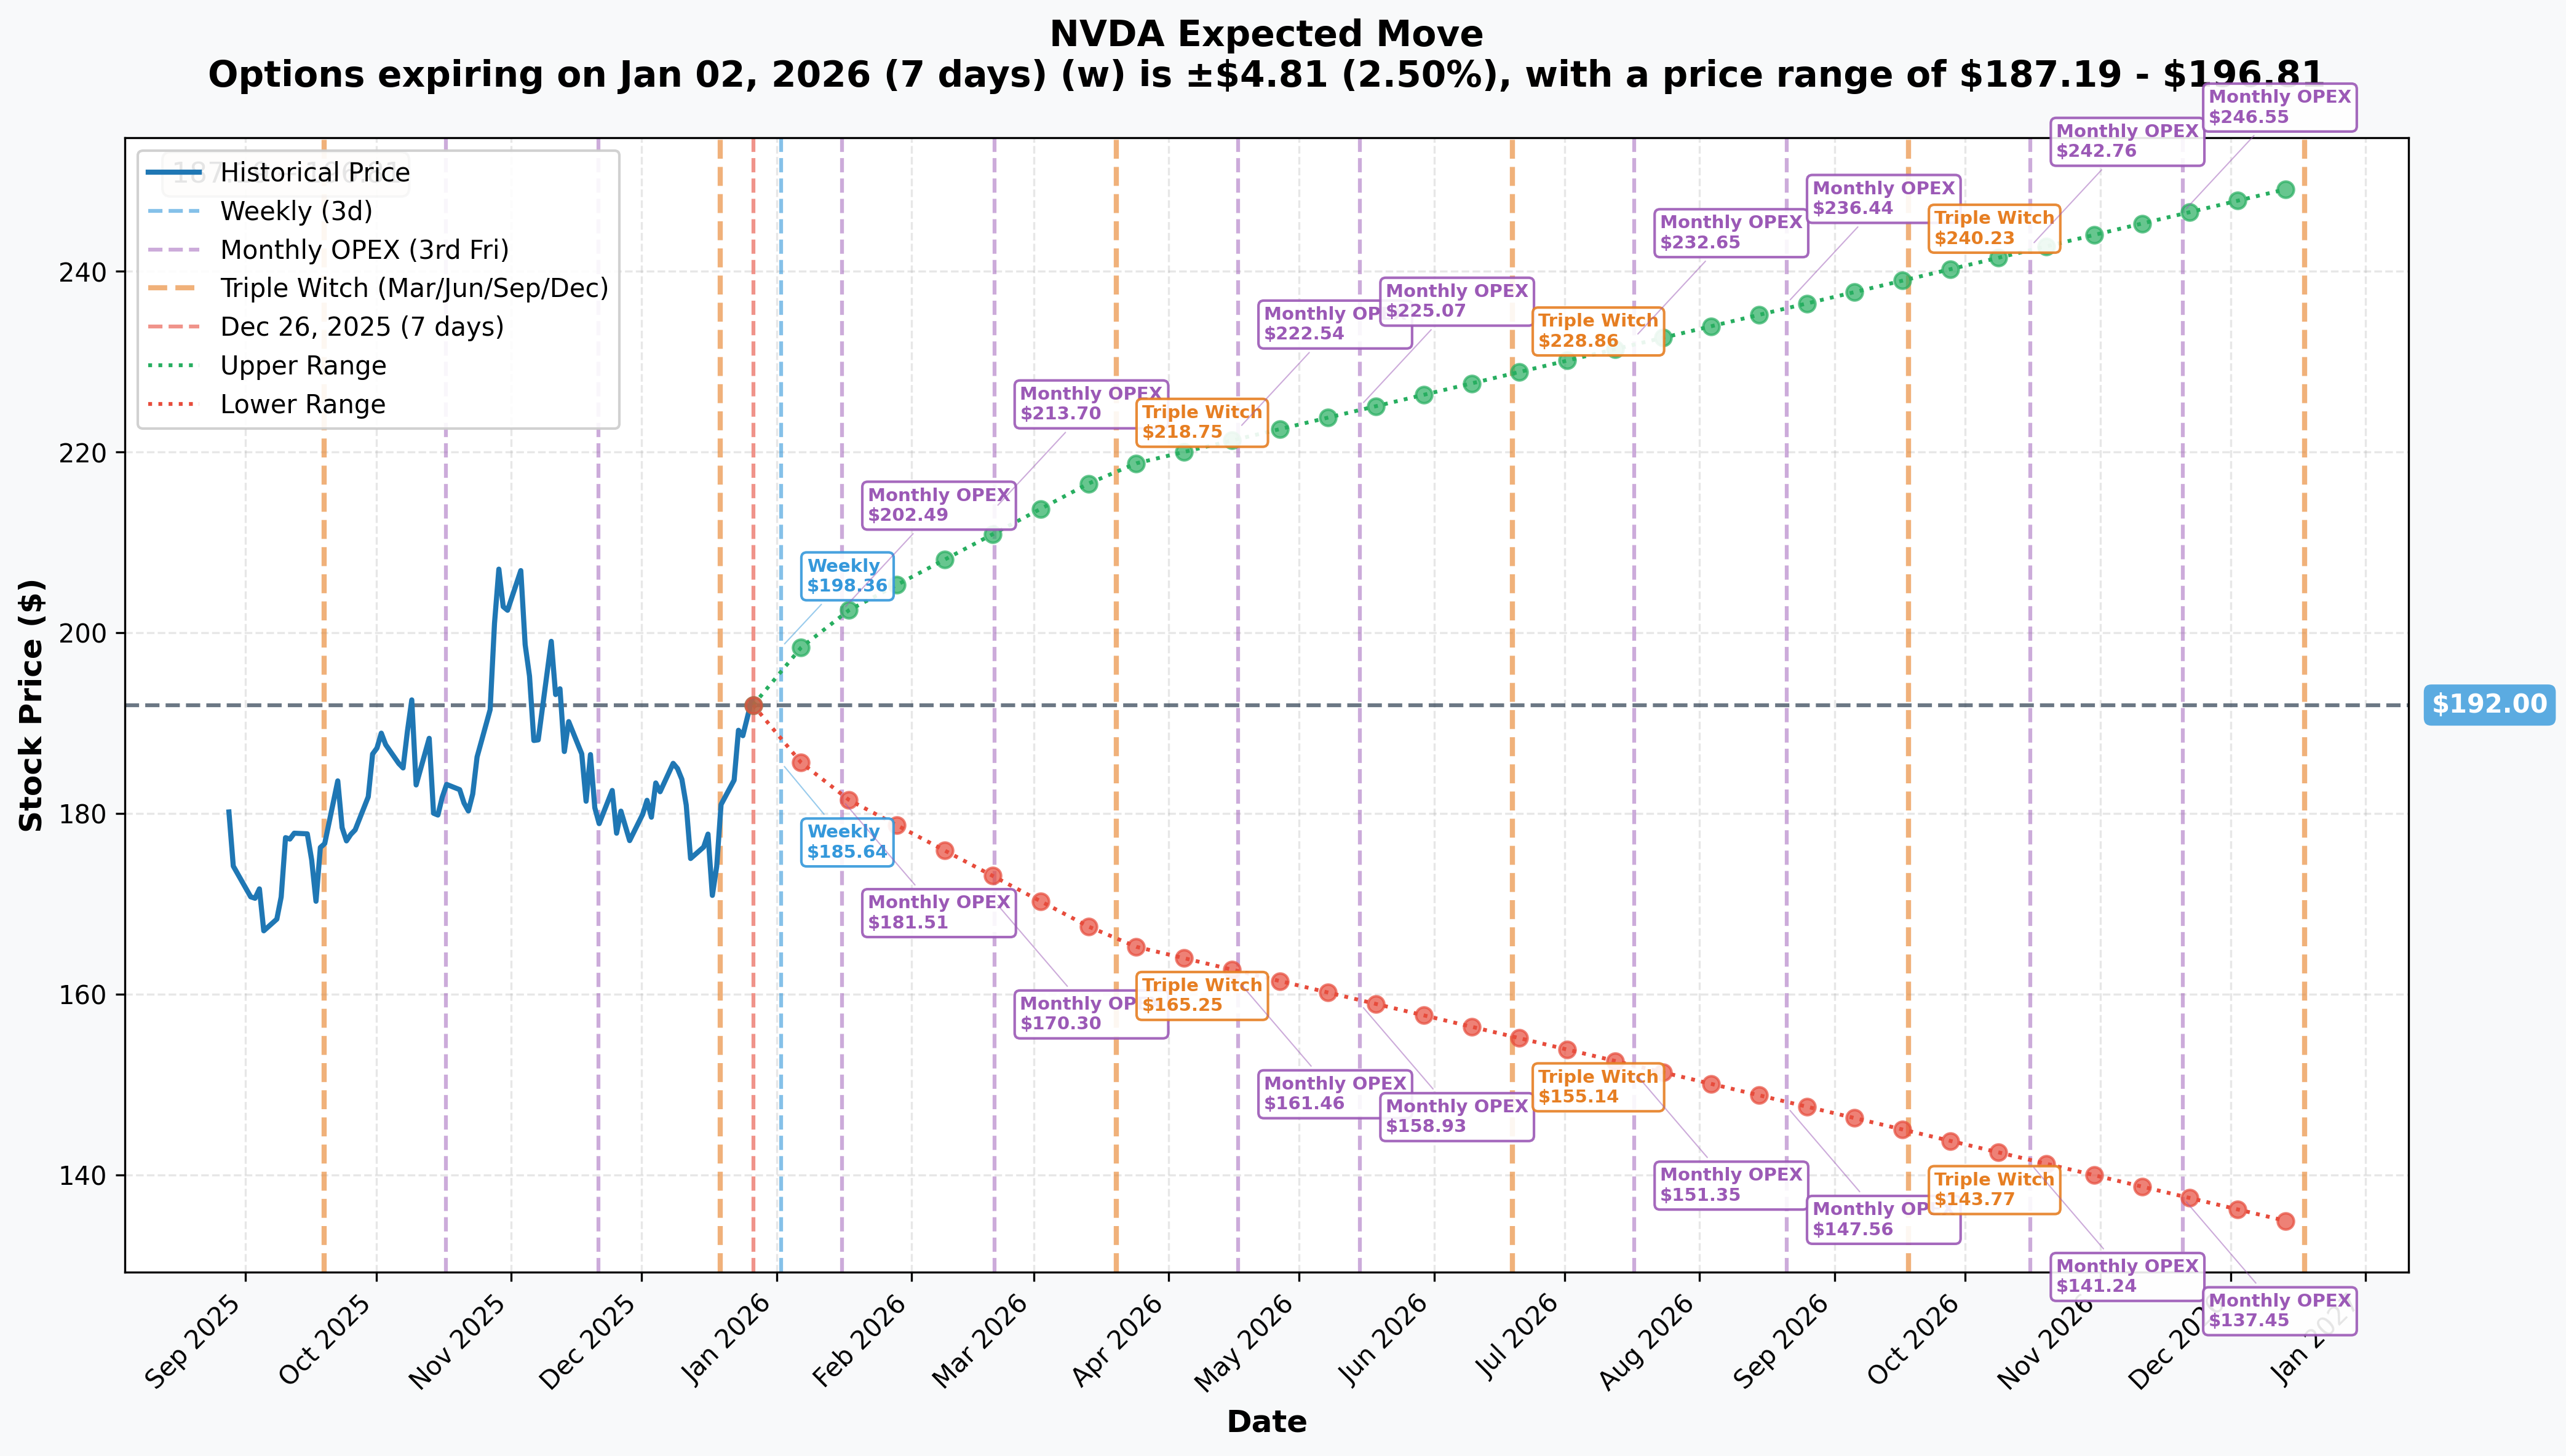
Implied Volatility & Expected Moves:
| Timeframe | Expiration | Implied Move | Price Range | Events |
|---|---|---|---|---|
| Weekly | Jan 2, 2026 | ±1.67% | $186.44 - $193.17 | New Year rollover |
| Monthly | Jan 16, 2026 | ±4.09% | $182.55 - $198.02 | Post-CES consolidation |
| Quarterly | Mar 20, 2026 | ±9.04% | $173.27 - $207.75 | Post-earnings, Triple Witch |
| Yearly | Dec 2026 | ±18.46% | - | Full year outlook |
March Expiration Math: The quarterly implied move of ±9.04% puts the expected range at $173.27 (downside) to $207.75 (upside) by March 20th. The whale's $160 strike is 16% below current price, suggesting they're buying insurance with upside leverage, not making a pure directional bet. If NVDA hits the upper end of the implied range ($207.75), this position is worth ~$90.5M—a 31% return on the $69M investment.
🔥 Catalysts: What's Driving This Trade
🗓️ IMMEDIATE: CES 2026 (January 5-9, 2026)
Jensen Huang Keynote: January 5, 2026 at 1:00 PM PT (90-minute presentation) (NVIDIA CES 2026)
What to Expect:
- AI Enterprise Hardware: Blackwell/Rubin architecture updates for data center customers (Counterpoint CES expectations)
- Automotive Platforms: NVIDIA DRIVE, autonomous vehicle partnerships with Toyota, GM, Hyundai (NVIDIA CES 2025 blog)
- Robotics Demos: Hands-on showcases of Cosmos platform at Fontainebleau Las Vegas (NVIDIA Developer Forums)
- Roadmap Signals: Next-gen Vera Rubin architecture hints (Financial Content NVIDIA architecture)
What's NOT Expected: Consumer GPU launches like RTX 50 SUPER series (Digital Trends CES RTX 50 Super)
Historical Context: Jensen's CES keynotes have historically moved NVDA stock ±3-6% in the 48 hours post-event. January 2025's RTX 50 series reveal drove a +5.2% pop.
📈 MAJOR: Q4 FY2026 Earnings (February 25, 2026)
Confirmed Date: Wednesday, February 25, 2026 after market close (Nasdaq earnings calendar)
Guidance:
- Revenue: $65.0 billion (±2%) vs. $57B in Q3 (+14% QoQ growth)
- GAAP Gross Margin: 74.8% (±50 bps)
- Non-GAAP Gross Margin: 75.0% (±50 bps)
- Analyst EPS Estimate: $1.52 (MarketBeat earnings)
Key Metrics to Watch:
- Blackwell Revenue Contribution: Q3 saw initial Blackwell ramp; Q4 should show meaningful GB200/GB300 revenue (GreenData GB300 shipping)
- Data Center Growth: Can NVDA sustain +60% YoY in data center segment? (Futurum Q3 analysis)
- Margin Trajectory: Gross margins peaked at 78.4% in Q1 FY2025, now at 73.5%—further compression could spook investors
- China Revenue: Post-H200 approval impact (The Conversation NVIDIA H200 China)
- Networking Momentum: Q3 networking revenue surged 162% to $8.19B (NVIDIA Q3 results)
Earnings Volatility: NVDA's average one-day post-earnings move over the last 8 quarters is ±8.3%. Options are pricing a ±6-7% move for February 26th.
💰 RECENT: Groq Technology Licensing Deal (December 24, 2025)
Deal Details: NVIDIA entered a non-exclusive technology licensing agreement with AI inference chip startup Groq, valued at approximately $20 billion (Reuters NVIDIA Groq)
Key Personnel:
- Jonathan Ross: Groq founder and creator of Google's TPU, now joining NVIDIA (Business Insider NVIDIA Groq talent)
- Sunny Madra: Groq president, also joining NVIDIA
Strategic Significance:
- Inference Positioning: Groq's low-latency Language Processing Unit (LPU) technology complements NVIDIA's training dominance (Data Center Dynamics NVIDIA Groq)
- Competitive Response: Addresses custom ASIC threat in inference workloads where AMD, Google TPU, and AWS Trainium are gaining share
- "Hackquisition" Strategy: NVIDIA acquires technology + talent without full acquisition regulatory burden (Spyglass NVIDIA hackquisition)
Market Reaction: NVDA stock initially flat on Christmas Eve trading, but analyst commentary has been positive—reinforces NVIDIA's "full-stack AI" positioning.
🌏 China Export Policy Developments
April 2025 - H20 Ban:
- U.S. government required export licenses for H20 chips to China (NPR NVIDIA H20 exports)
- NVIDIA recorded $5.5 billion quarterly charge for H20 inventory write-down (CNBC NVIDIA $5.5B charge)
- China revenue dropped from 17% to 13% of total (Fortune NVIDIA H20 Trump ban)
December 2025 - Policy Relaxation:
- Trump administration approved H200 chip sales to vetted Chinese customers (subject to 25% import duty) (The Conversation NVIDIA H200 China)
- NVIDIA allowed to sell H20 chips in exchange for 15% revenue contribution to U.S. government
- Represents significant reversal but uncertainty persists
Upside Scenario: If China demand rebounds meaningfully in Q4/Q1, it could add $2-4B quarterly revenue surprise. The whale trade may be positioning for this China policy tailwind.
🏗️ Blackwell Production Ramp
Current Status:
- GB200/GB300 Shipments: Mass production began December 2024; large-scale deliveries to AWS, Meta, Microsoft, Oracle started Q1 2025 (Tom's Hardware Blackwell December)
- First Quarter Revenue: Blackwell contributed $11 billion in Q4 FY2025—NVIDIA's fastest product ramp ever (NVIDIA Q4 FY2025 results)
- GB300 NVL72 "Ultra" GPUs: Available for order with shipments beginning December 2025 (GreenData GB300)
Supply Constraints:
- Cloud GPU supply remains "tight" per Q3 earnings; shortage persists through December 2025 (FourWeekMBA Blackwell sellout)
- Analysts halved 2025 GB200 NVL72 shipment projections to 25,000-35,000 units from 50,000-80,000 (Tom's Hardware GB200 forecasts halved)
- Blackwell GPUs projected to account for >80% of NVIDIA's high-end GPU shipments in 2025 (EE Times Asia Blackwell dominance)
Upside Catalyst: If NVIDIA announces at CES or earnings that Blackwell supply constraints are easing faster than expected, it removes a key bear case and could drive multiple expansion.
🎯 Price Targets & Probabilities
Analyst Consensus
Street Targets:
- Average Price Target: $252.49 - $263.58 (TipRanks NVDA forecast, Stock Analysis forecast)
- Implied Upside: +33.9% from current $190.84
- Range: $100 (bear case) to $352 (Tigress Financial bull case)
- Rating: Strong Buy (39 Buy, 1 Hold, 1 Sell)
Recent Changes:
- Truist: Raised target to $275 (+$20) post-Q3 earnings
- Tigress Financial: Raised target to $350 (+$70)—highest on Street
- Evercore ISI: Maintains "Outperform" with street-high target
Technical Price Targets (Based on Gamma + Implied Move)
Bullish Scenario (60% probability):
- Near-Term Target: $200 (call gamma wall + psychological resistance)
- Post-CES Target: $207-210 (quarterly implied move upper bound + October highs)
- March OPEX Target: $212-220 (breakout above all-time highs)
- Catalyst Path: Strong CES reception → Blackwell supply improvement narrative → Q4 beat/raise
Base Scenario (30% probability):
- Range: $185-$195 (current consolidation zone)
- March OPEX: $190-$200 (sideways chop with gamma pin at $192.50)
- Catalyst Path: In-line CES, modest earnings beat, China uncertainty persists
Bearish Scenario (10% probability):
- Downside Target: $173-$180 (quarterly implied move lower bound)
- Support Levels: $185 (call gamma), $180 (50-day MA), $173 (put gamma support)
- Catalyst Path: Disappointing CES, earnings miss on margins, competitive threats materialize
March 20, 2026 Probabilities (Options-Implied)
Using the implied volatility surface and delta approximations:
| Price Level | Probability | Strike Relevance |
|---|---|---|
| Above $220 | ~15% | New all-time highs |
| $207-$220 | ~25% | Upper implied range |
| $195-$207 | ~35% | Modest upside (base case) |
| $185-$195 | ~20% | Consolidation continues |
| Below $185 | ~5% | Downside surprise |
Whale Trade Breakeven ($196.32): ~55-60% probability of profit at expiration based on current implied volatility.
💡 Trading Ideas
🛡️ CONSERVATIVE: Defined-Risk Bullish Structure
Bull Call Spread (March 20, 2026 expiration)
- Buy: 1x $190 call @ $18.50
- Sell: 1x $210 call @ $8.20
- Net Debit: $10.30 ($1,030 per spread)
- Max Profit: $9.70 ($970 per spread) if NVDA ≥ $210 at expiration
- Max Loss: $1,030 (debit paid)
- Breakeven: $200.30
- Return on Risk: 94% if max profit achieved
Why This Works:
- Limited Downside: Risk capped at $1,030 per spread vs. buying stock
- Gamma Support: Long $190 call sits near current price with dealer support at $192.50
- Resistance Target: Short $210 call captures upside to put gamma magnet
- Earnings/CES Upside: Profits from move to $200-$210 range (implied by catalysts)
Ideal For: Traders who want bullish exposure but fear volatility crush post-earnings or downside gap risk.
⚖️ BALANCED: Calendar Spread for IV Expansion
Double Calendar Spread (Earnings Volatility Play)
-
Front Month (February 21, 2026 weekly - expires before earnings):
- Sell 1x $195 call @ $8.50
- Sell 1x $185 put @ $6.20
- Total Credit: $14.70 ($1,470 per spread)
-
Back Month (March 20, 2026 - captures earnings):
- Buy 1x $195 call @ $15.30
- Buy 1x $185 put @ $11.80
- Total Debit: $27.10 ($2,710 per spread)
-
Net Debit: $12.40 ($1,240 per spread)
-
Max Profit: Varies (if NVDA stays near $190 and IV spikes into earnings)
-
Max Loss: $1,240 if NVDA moves dramatically before Feb 21
-
Breakeven Range: Approximately $180-$205 at front-month expiration
Why This Works:
- Volatility Expansion: Benefits from IV spike into Feb 25 earnings
- Theta Capture: Front-month decay accelerates in final week
- Range-Bound Edge: Profits from NVDA staying in $185-$195 consolidation through CES, then volatility into earnings
- Gamma Pin: Aligns with $192.50 highest gamma strike
Ideal For: Experienced traders comfortable with multi-leg spreads who believe NVDA consolidates into earnings then moves post-results.
🔥 AGGRESSIVE: Leveraged Upside Bet
Out-of-the-Money Call Butterfly (March 20, 2026)
- Buy: 1x $200 call @ $12.50
- Sell: 2x $210 call @ $8.20 each
- Buy: 1x $220 call @ $5.30
- Net Debit: $1.40 ($140 per butterfly)
- Max Profit: $8.60 ($860 per butterfly) if NVDA = $210 at expiration
- Max Loss: $1.40 (debit paid)
- Profit Range: $201.40 - $218.60
- Return on Risk: 614% at max profit
Why This Works:
- Lottery Ticket Structure: Small capital outlay for massive upside
- Catalyst Alignment: Profits if NVDA breaks out to $200-220 post-CES/earnings
- Gamma Resistance Flip: $200 call gamma wall becomes support if broken; $210 is put gamma magnet
- Defined Risk: Can only lose $140 per butterfly vs. buying stock or naked calls
Ideal For: High-conviction traders who believe the whale trade signals a breakout above $200 and want asymmetric payoff with limited capital.
🐋 WHALE REPLICATION: Deep ITM Call (For Large Accounts)
Replicate the Flow (March 20, 2026)
- Buy: 10x $160 calls @ $36.32 each
- Total Investment: $36,320 per 10-lot
- Intrinsic Value: $30.84 per share ($30,840)
- Time Premium: $5.48 per share ($548 per contract)
- Delta: ~0.92 (92 shares of exposure per contract)
- Theta: ~-$8 per contract per day
- Breakeven: $196.32 at expiration
Why This Structure:
- Leverage: Control $160,000 notional ($160 × 100 shares × 10 contracts) for $36,320
- Defined Risk: Max loss is $36,320 vs. $190,840 to buy 1,000 shares outright
- High Delta: Behaves like stock ownership (92% participation in upside)
- Dividend Protection: No dividend risk (NVDA pays $0.01/quarter—negligible)
Exit Strategy:
- Target 1: Sell 50% if NVDA hits $207 (October highs) = +46% gain on half
- Target 2: Sell remaining 25% if NVDA hits $220 = +81% gain
- Stop Loss: Exit if NVDA breaks below $180 (7% stop from current levels)
Ideal For: Accounts $100K+ who want to mirror the whale's conviction with defined risk and capital efficiency.
⚠️ Risk Factors
🌍 Geopolitical & Regulatory Risks
China Export Controls:
- China revenue dropped to half of pre-export control levels (CFR China AI chip deficit)
- Huawei listed as competitor in NVIDIA's annual filing—domestic Chinese alternative emerging
- December H200 approval provides temporary relief, but policy uncertainty remains high
- Tariff Exposure: U.S. proposed 100% tariff on imported semiconductors; China banned NVIDIA chips (Financial Content NVIDIA tariff storm)
- August 2025 Agreement: NVIDIA pays 15% of China AI chip revenues to U.S. government
Antitrust Concerns:
- China SAMR found NVIDIA violated antitrust laws (Mellanox acquisition compliance) (Fortune China NVIDIA antitrust)
- EU AI Act may impose transparency requirements
- U.S. regulatory scrutiny possible if viewed as AI development bottleneck
Impact on This Trade: Negative China policy reversal before March expiration would crater NVDA. The deep ITM structure provides some cushion, but a 10%+ gap down would hurt.
📊 Valuation & Margin Compression
Stretched Metrics:
- Price-to-Sales Ratio: ~21x (double the highest Mag-7 peer premium)
- Historical Peak P/S: 42.4x in summer 2024 approached dot-com bubble levels
- Normalization Risk: Premium pricing supported by GPU scarcity may compress as Blackwell supply improves
Margin Trajectory:
- Peak Gross Margin: 78.4% in Q1 FY2025
- Current Gross Margin: 73.5% (Q3 FY2026)
- Forecasted Margin: 70.6% in Q1 FY2027 (AInvest NVIDIA regulatory challenges)
- Sequential Declines: Every quarter since Q1 FY2025 has seen margin compression
Why Margins Matter: NVDA's $4.58T market cap implies continued 70%+ gross margins. If Q4 guidance shows margins below 73%, multiple could contract even with revenue beat.
Impact on This Trade: Earnings margin disappointment could trigger -8% to -12% gap down, testing the $175-$180 support zone. The $160 strike provides 16% downside buffer, but time decay accelerates post-earnings.
🥊 Competitive Landscape Risks
AMD Resurgence:
- MI350 Series (launched June 2025) reportedly outperforms B200 by 20-30% in certain workloads (Financial Content AI chip wars)
- 7 of 10 Largest Model Builders now run production on AMD Instinct (Meta, OpenAI, Microsoft, xAI)
- Pricing Advantage: MI350 priced at ~$25,000 vs. B200 at $45,000-$50,000
- Software Gap: ROCm ecosystem remains 5+ years behind CUDA maturity, but closing
Custom ASIC Threat:
- Custom chip market share rising from 37% (2024) to projected 45% (2028) (Financial Content custom ASIC decoupling)
- Over 50% of hyperscaler inference workloads on custom ASICs (Google TPU, AWS Trainium, Azure Maia)
- 40-65% TCO advantage over merchant silicon like NVIDIA GPUs
Market Share Erosion:
- NVIDIA's data center share slipped from ~90% to ~75% within hyperscaler tier (AI Plain English NVIDIA monopoly)
- Training workload dominance remains near-monopoly, but inference share declining
NVIDIA's Moat:
- CUDA Ecosystem: 4+ million developers, 15+ years of library development (Financial Content $4T architecture)
- Vertical Integration: Networking (Mellanox), DPUs, software (Omniverse, CUDA)
- Switching Costs: Re-training models on new hardware architectures costs millions
Impact on This Trade: If a hyperscaler announces at CES or earnings a major shift to custom ASICs, NVDA could gap down. The Groq deal mitigates some inference risk, but market share loss narratives are NVDA's Achilles' heel.
📉 Execution & Supply Chain Risks
TSMC Concentration:
- Advanced Packaging Dependency: CoWoS (Chip-on-Wafer-on-Substrate) capacity constraints for Blackwell (TrendForce Blackwell production)
- Geopolitical Taiwan Exposure: China-Taiwan tensions create supply disruption risk
- Yield Issues: Blackwell faced initial yield problems causing delays; Vera Rubin execution uncertain
Product Transition Risk:
- If Blackwell ramp disappoints or Vera Rubin timeline slips, competitors gain time to close gap
- Gaming segment (RTX 50 series) faced severe availability issues and 12V-2x6 connector melting problems (Wikipedia GeForce RTX 50)
Impact on This Trade: Supply chain disruptions or product delays typically cause -5% to -8% selloffs. March expiration captures risk of Q1 2026 Blackwell shipment disappointments.
📆 Theta Decay & Volatility Crush
Time Decay Profile:
- Current Theta: ~-$8 per contract per day (84 days to expiration)
- Accelerated Decay: Theta accelerates to ~-$15/day in final 30 days
- Total Theta Loss: If NVDA stays flat at $190.84, the position loses ~$5-6 per contract (~15% of time premium)
Volatility Crush Risk:
- Pre-Earnings IV: NVDA's implied volatility typically spikes 10-15% into earnings
- Post-Earnings Crush: IV drops 30-40% the day after earnings regardless of direction
- Impact: If NVDA stays flat post-earnings, the deep ITM calls lose time premium rapidly
Mitigating Factor: Deep ITM calls have lower vega exposure (~0.15 vs. 0.40 for ATM calls), so volatility crush impact is muted. The trade is primarily a delta play, not a volatility bet.
🎯 Bottom Line
What This Trade Signals: This $69M whale bet isn't a reckless YOLO—it's a calculated leveraged long position with 16% downside protection, designed to capture upside from CES momentum, Q4 earnings, and potential China policy tailwinds. The deep ITM structure (delta ~0.92) means this is essentially a stock replacement trade with defined risk and 5:1 leverage.
The Bull Case: If NVDA hits the Street's average price target of $252 by March, this position returns ~$175M profit on the $69M investment—a 154% gain vs. 32% on outright stock ownership. The quarterly triple witch expiration captures maximum gamma/vol dynamics, and the March 20 date sits 3 weeks post-earnings (allowing initial reaction to settle and trend to establish).
The Bear Case: If China policy reverses, margins disappoint, or hyperscalers announce ASIC shifts, NVDA could retest $173-$180 support. The $160 strike provides cushion, but the $69M position would lose ~$20-30M in that scenario (30-45% loss). Theta decay of $500-800 per contract over 84 days erodes value if NVDA chops sideways.
Retail Takeaway: You don't need $69M to express a similar view. The bull call spread ($190/$210 for $10.30) offers 94% ROI with defined risk for accounts under $10K. The call butterfly ($200/$210/$220 for $1.40) provides 614% upside for $140 risk if you believe the breakout thesis. For larger accounts, the 10-lot deep ITM replication ($36,320 investment) mirrors the whale's structure at 1/190th the size.
Final Verdict: This trade is statistically extraordinary even for a high-volume name like NVDA. Combined with Jensen's CES keynote in 10 days, Q4 earnings in 60 days, and the recent Groq deal, the timing suggests inside conviction or sophisticated hedging. Whether it's a leveraged long, a hedge against short exposure, or a spread leg we can't see, the message is clear: someone believes NVDA's next 12 weeks hold significant upside potential—and they're backing it with $69 million in premium.
Risk Disclosure: Options trading involves substantial risk and is not suitable for all investors. The strategies outlined above can result in total loss of invested capital. This analysis is for informational purposes only and does not constitute investment advice. Past performance of similar trades is not indicative of future results. Always conduct your own due diligence and consult with a licensed financial advisor before trading options.
🔗 Additional Resources
Deep ITM Call: Chart Analysis - $160 Strike, Mar 2026 Expiry
Full Stock Analysis: NVDA Deep Dive
Data Sources:
- Trade Data: Proprietary options flow scanner
- Gamma Exposure: Real-time GEX aggregation from OPRA feed
- Implied Volatility: Options chain data from exchange APIs
- Catalyst Research: NVDA_catalysts.md with inline source citations
- Technical Data: TradingView, MacroTrends, Yahoo Finance
- Analyst Data: TipRanks, MarketBeat, Stock Analysis consensus
Analysis completed: December 26, 2025 | NVDA Spot: $190.84 | Market Cap: $4.58T