NVDA Unusual Options Activity Analysis
Generated: February 10, 2026 | View on AInvest
Executive Summary
Total Premium Detected: $23.5M across 5 institutional-grade call purchases Strategy: Aggressive pre-earnings bullish positioning via multiple long calls Primary Catalyst: Q4 FY26 Earnings on February 25, 2026 Conviction Level: HIGH - Concentrated premium in near-term expiration with earnings binary
Institutional traders are placing significant capital on NVDA upside ahead of the February 25 earnings call. The activity shows a deliberate structure: heavy weekly exposure to capture the earnings move ($19.2M in Feb 20 calls) plus a $4.3M LEAP position for longer-term conviction. This is textbook pre-earnings accumulation by sophisticated participants expecting a beat-and-raise cycle.
Company Overview
| Metric | Value |
|---|---|
| Company | NVIDIA Corporation |
| Ticker | NVDA |
| Sector | Semiconductors & Related Devices |
| Market Cap | $4.62 Trillion |
| Current Price | ~$189 |
| Headquarters | Santa Clara, California |
| Employees | 36,000 |
NVIDIA is the dominant force in AI infrastructure, commanding 90% market share in AI chips. The company's GPU technology powers everything from data center AI training to consumer gaming, with data center revenue representing 88% of total revenue at $51.2B in Q3 FY26.
YTD Performance
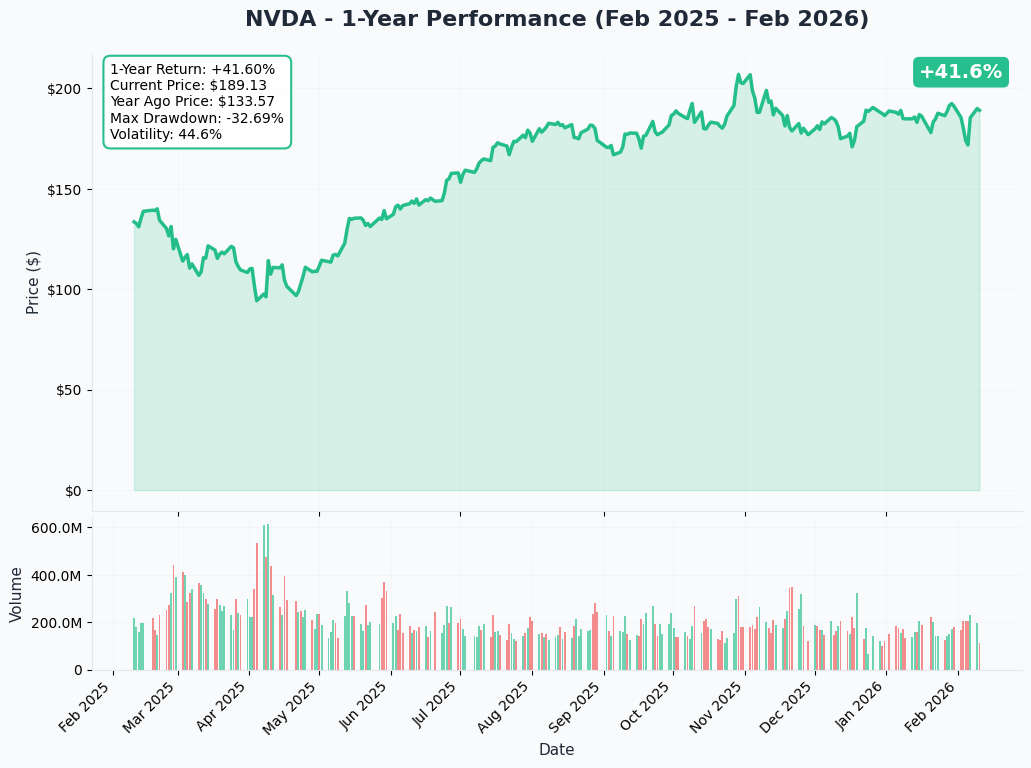
Key Technical Observations:
- Stock traded from all-time high of $207.03 (October 29, 2025) to current ~$189 level
- Approximately -8% decline from peak
- Issued a buy signal from pivot bottom point on February 5, 2026
- Up 10.57% since the February 5 signal
Unusual Options Activity Summary
Flow Overview
| Time | Direction | Type | Strike | Expiration | Premium | Volume | OI | Spot | Option Price |
|---|---|---|---|---|---|---|---|---|---|
| 09:42:33 | BUY | CALL | $180 | 02/20/26 | $7.7M | 8,500 | 109,000 | $189.61 | $11.70 |
| 09:33:06 | BUY | CALL | $180 | 01/15/27 | $4.3M | 1,000 | 41,000 | $191.41 | $43.00 |
| 10:16:07 | BUY | CALL | $185 | 02/20/26 | $4.2M | 36,000 | 74,000 | $188.29 | $7.05 |
| 09:54:00 | BUY | CALL | $185 | 02/20/26 | $4.2M | 18,000 | 74,000 | $189.40 | $7.70 |
| 10:17:10 | BUY | CALL | $190 | 02/20/26 | $3.1M | 35,000 | 79,000 | $188.79 | $4.45 |
Premium Distribution
| Expiration | Total Premium | % of Total | Strategy Interpretation |
|---|---|---|---|
| Feb 20, 2026 | $19.2M | 81.7% | Earnings binary play - capturing Feb 25 event |
| Jan 15, 2027 | $4.3M | 18.3% | LEAP conviction - structural AI bull thesis |
Strike Distribution (Feb 20 Expiry)
| Strike | Moneyness | Premium | Delta Estimate | Breakeven |
|---|---|---|---|---|
| $180 | ITM ~5% | $7.7M | ~0.70 | $191.70 |
| $185 | ITM ~2% | $8.4M | ~0.55 | $192.50 |
| $190 | ATM | $3.1M | ~0.45 | $194.45 |
Option Contract Links
| Symbol | Strike | Expiration | Link |
|---|---|---|---|
| NVDA260220C180 | $180 | Feb 20, 2026 | View Contract |
| NVDA270115C180 | $180 | Jan 15, 2027 | View Contract |
| NVDA260220C185 | $185 | Feb 20, 2026 | View Contract |
| NVDA260220C190 | $190 | Feb 20, 2026 | View Contract |
Implied Move Analysis
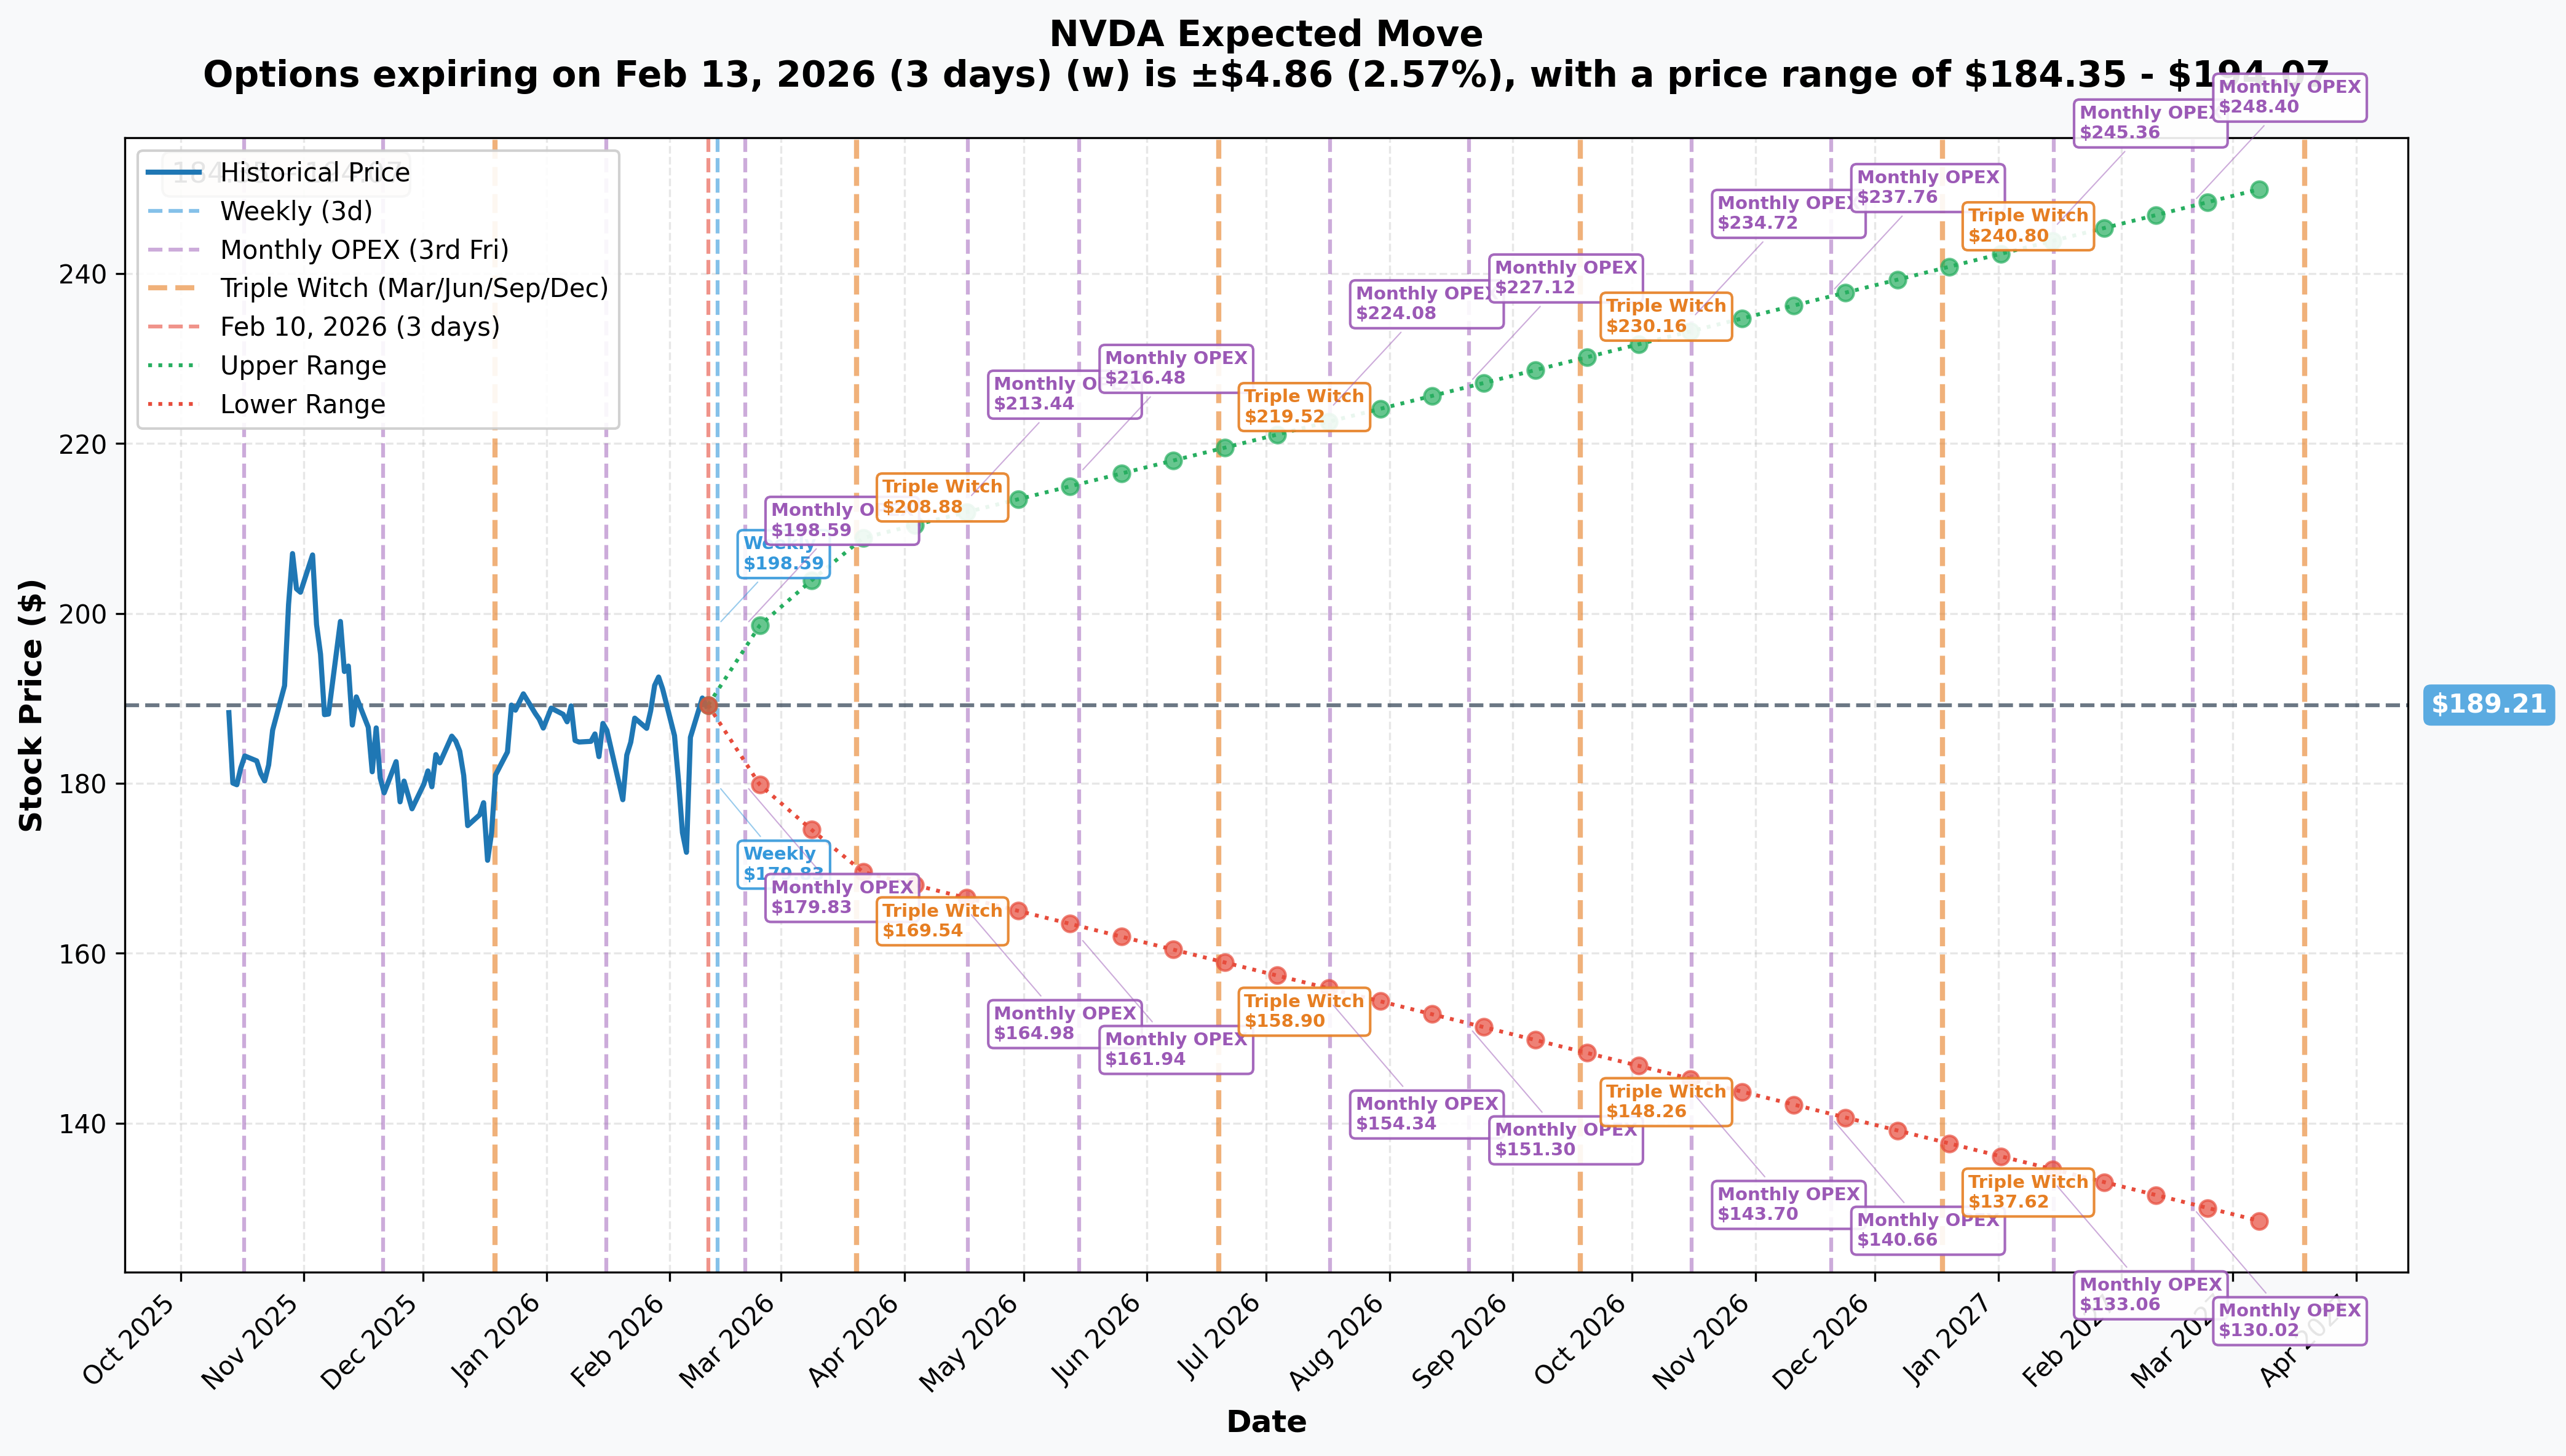
Current Implied Volatility Metrics
| Timeframe | Expiry | Days | Implied Move % | Implied Move $ | Range |
|---|---|---|---|---|---|
| Weekly | Feb 13 | 3 | 2.57% | $4.86 | $184.35 - $194.07 |
| Monthly OPEX | Feb 20 | 10 | 4.31% | $8.16 | $181.05 - $197.37 |
| Triple Witch | Mar 20 | 38 | 10.33% | $19.55 | $169.66 - $208.76 |
| LEAPS | Mar 2027 | 402 | 32.83% | $62.11 | $127.10 - $251.32 |
Earnings Implied Move Context
The Feb 20 expiry captures the February 25 earnings event. The 4.31% implied move translates to an expected range of $181.05 - $197.37.
Historical Earnings Moves (Recent Quarters):
- Q3 FY26 (Nov 2025): Beat expectations, stock moved +3.5% post-earnings
- Q2 FY26 (Aug 2025): Beat expectations with strong guidance
- Pattern: NVDA has consistently beaten and raised, rewarding call buyers
Gamma Support/Resistance Levels
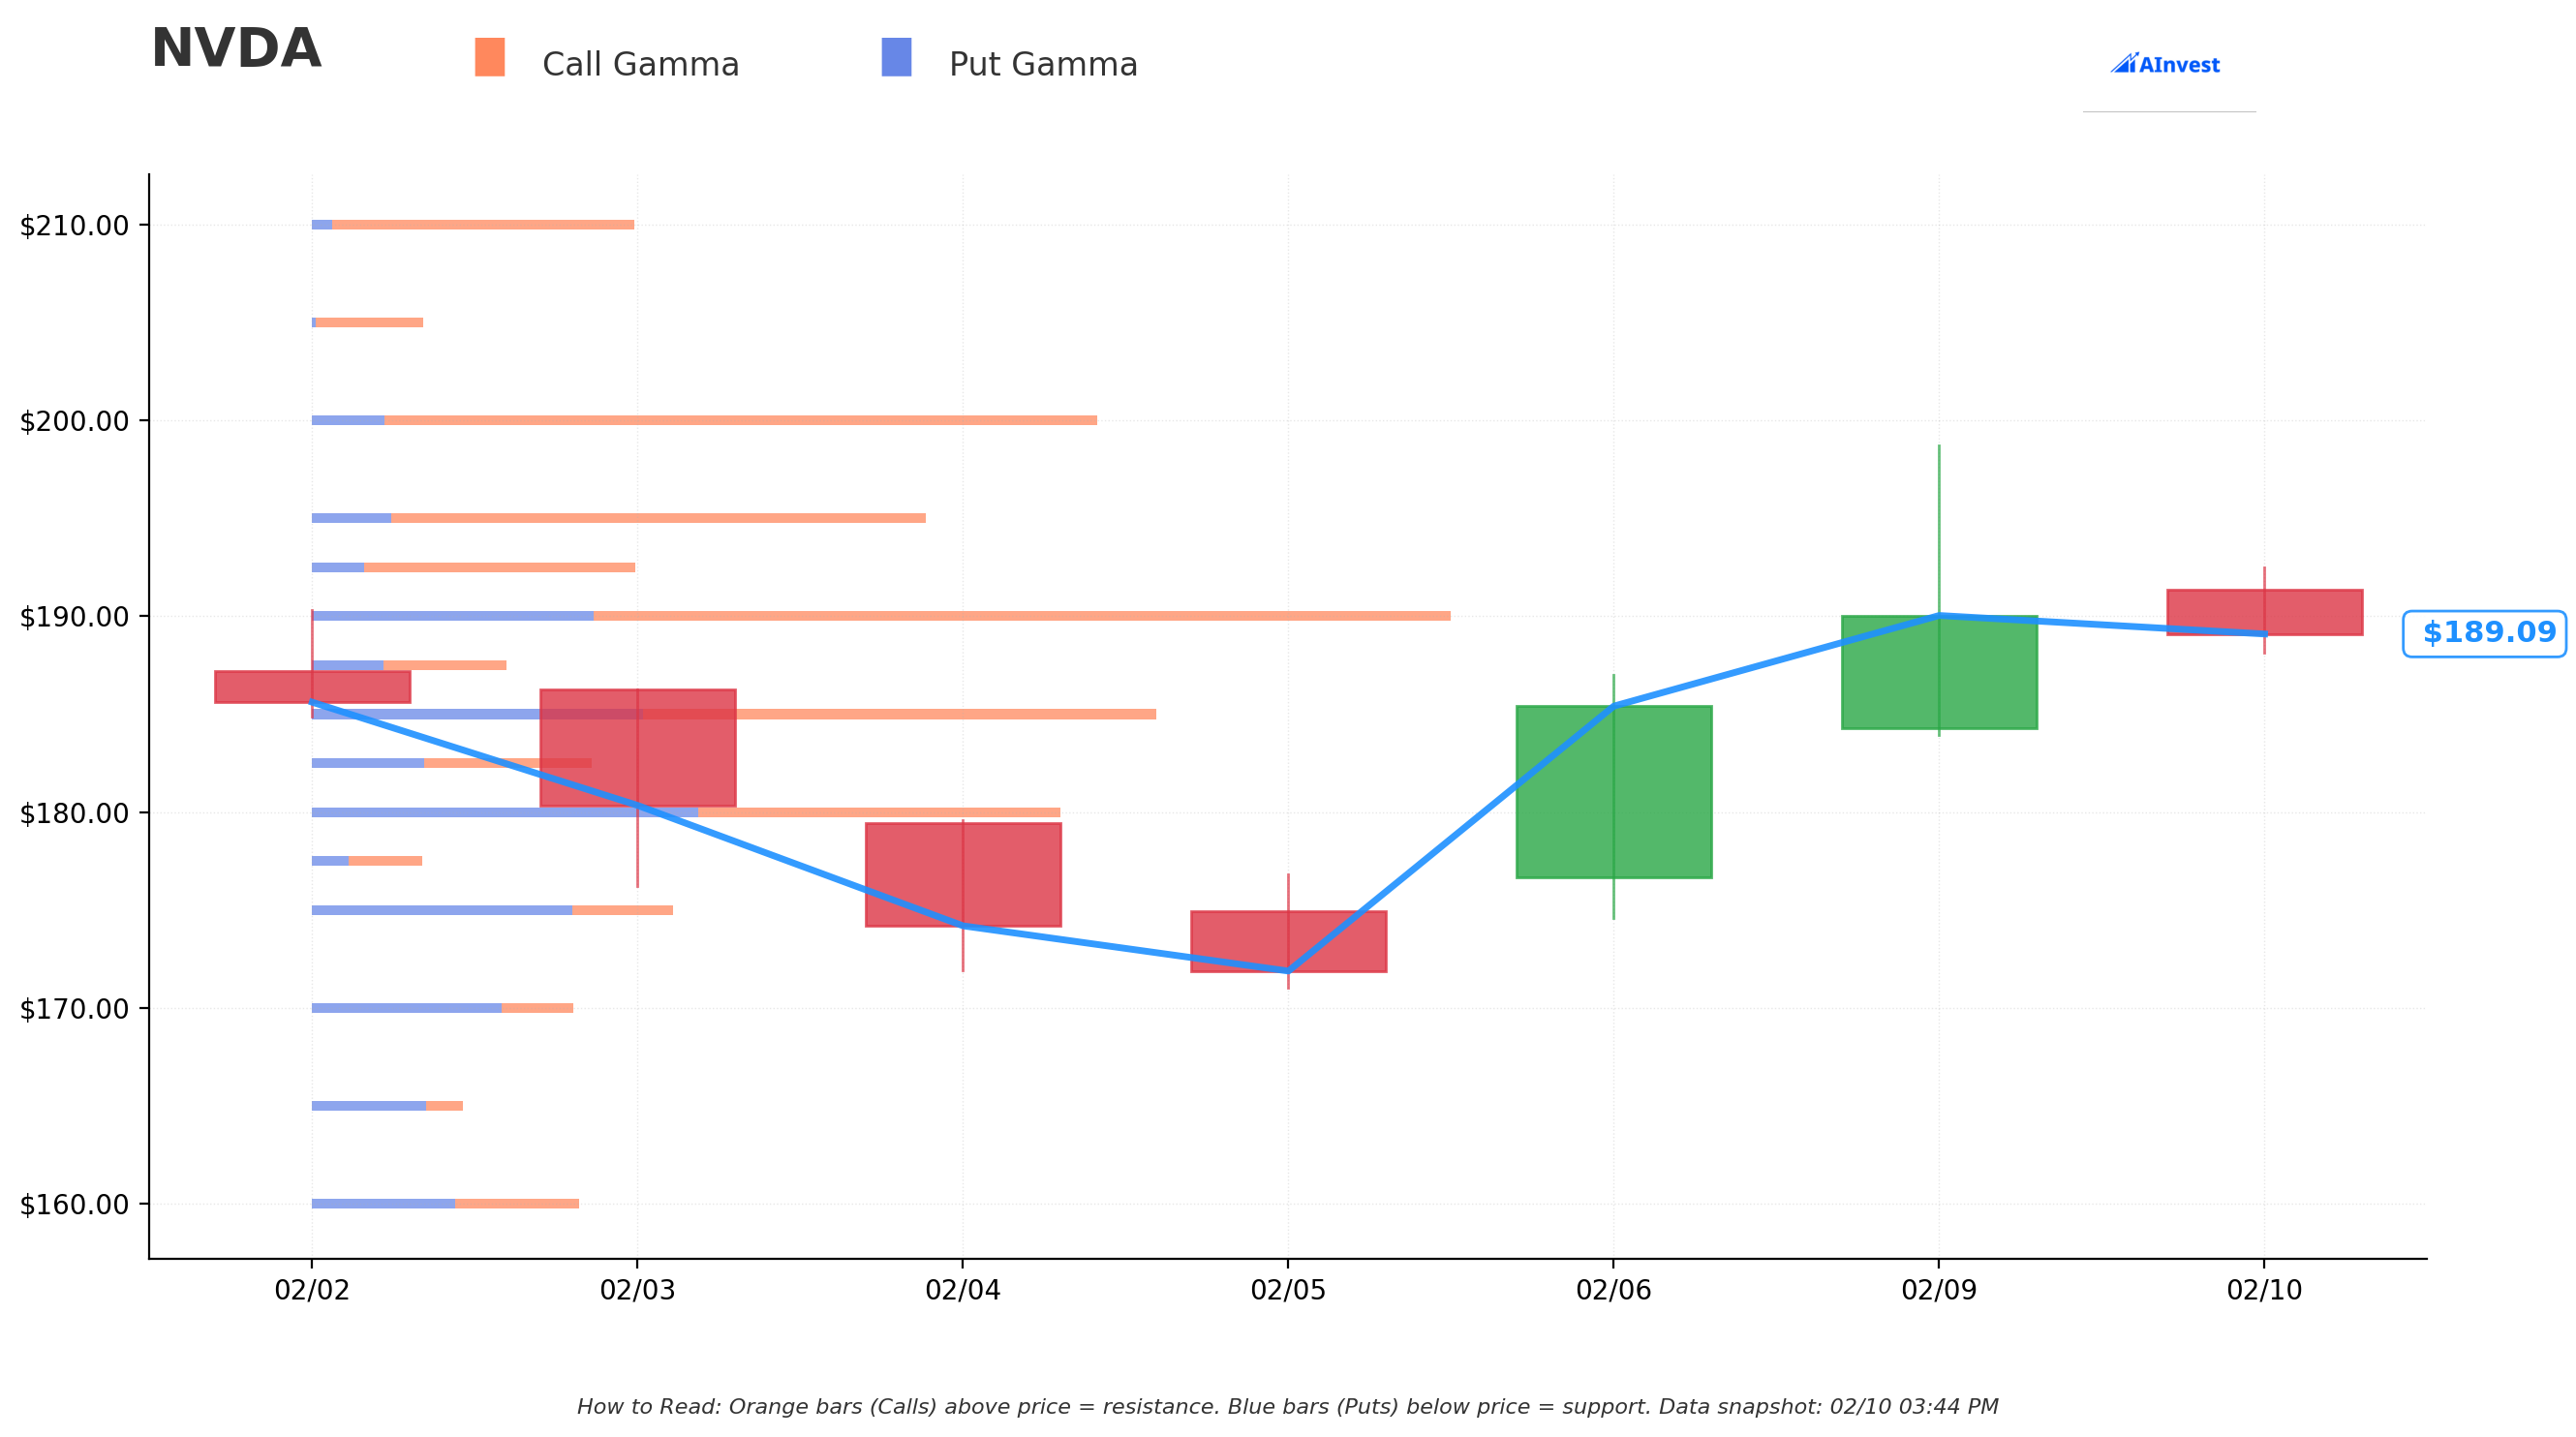
Key Gamma Levels
Based on open interest concentration:
| Level | Type | OI Concentration | Significance |
|---|---|---|---|
| $180 | Major Support | 109,000 OI | ITM call gamma wall - dealer hedging provides bid support |
| $185 | Pivot Level | 74,000 OI | ATM gamma concentration - pin risk into expiry |
| $190 | Resistance | 79,000 OI | ATM strike - breakout above triggers delta hedging |
| $195 | Upside Target | Moderate OI | First major level above current range |
| $200 | Psychological | Heavy OI | Round number with significant call OI |
Dealer Positioning Implications
The massive call buying at $180-$190 strikes creates dealer short gamma exposure. As NVDA approaches these strikes:
- Below $185: Dealers buy dips to hedge, providing support
- Above $190: Dealers chase upside to maintain delta neutrality, amplifying moves
- Post-earnings: Gamma unwind could accelerate directional moves
Key Catalyst: Q4 FY26 Earnings (February 25, 2026)
Event Details
| Metric | Value |
|---|---|
| Date | Wednesday, February 25, 2026 |
| Time | 2:00 PM PT / 5:00 PM ET |
| CFO Commentary | 1:20 PM PT (pre-call written remarks) |
| Fiscal Year End | January 25, 2026 |
Consensus Expectations
| Metric | Consensus | YoY Growth |
|---|---|---|
| Revenue | $65.6B | +65% |
| EPS | $1.44 | +69.4% |
| Data Center Revenue | ~$58B (est.) | +70%+ |
Key Metrics to Watch
- Blackwell Production Ramp - Full-scale volume production achieved, shipping ~1,000 racks/week
- Q1 FY27 Guidance - Consensus expects $68-70B range
- Data Center Mix - Hyperscaler demand vs. enterprise adoption
- China Revenue - Impact of H200 export approval with 25% fee
- Gross Margins - Blackwell transition impact on margins
Why This Matters for Options Flow
The Feb 20 expiry is strategically positioned 5 days BEFORE earnings but captures all pre-earnings anticipation and positioning. These calls will:
- Benefit from IV expansion into earnings
- Allow traders to roll or close before the binary event
- Capture any pre-announcement leaks or analyst upgrades
Alternatively, traders may be positioning for an early announcement or expect the IV crush post-earnings to be offset by directional gains.
Additional Catalysts (Next 6 Months)
Confirmed Events
| Date | Event | Significance |
|---|---|---|
| Feb 25, 2026 | Q4 FY26 Earnings | Primary catalyst - beat-and-raise expected |
| Mar 16-19, 2026 | GTC 2026 Conference | Jensen Huang keynote, Vera Rubin details expected |
| H2 2026 | Vera Rubin Platform Launch | Next-gen architecture with 5x inference performance |
GTC 2026 Conference (March 16-19)
- Location: San Jose, CA + Virtual
- Expected Announcements:
- Vera Rubin architecture deep dive (HBM4 + TSMC 3nm)
- Blackwell Ultra (NVL72) upgrade timeline
- Rubin NVL144 production schedule
- Historical Impact: GTC announcements have historically driven 5-10% moves
Product Roadmap
| Product | Timeline | Key Features |
|---|---|---|
| Blackwell Ultra | Shipping 2026 | 60,000 racks projected |
| Vera Rubin NVL144 | H2 2026 | 5x inference, 3.5x training |
| Rubin Ultra NVL576 | H2 2027 | 576 GPUs per rack |
Competitive Landscape
Market Position
| Metric | NVDA Position |
|---|---|
| AI Chip Market Share | 90% |
| AI Accelerator Market | 80%+ |
| Data Center Revenue | $51.2B (Q3) |
| Booking Pipeline | $500B through 2026 |
Competitive Threats
| Competitor | Product | Threat Level |
|---|---|---|
| AMD | MI400 Series (2026) | Medium - 432GB HBM4, 19.6 TB/s bandwidth |
| Intel | Gaudi 3 / Jaguar Shores | Low - Focused on efficiency niche |
| Hyperscalers | Custom ASICs (Trainium, TPU, Maia) | Low-Medium - Hedging, not replacing |
Key Insight: Hyperscaler custom silicon is a hedge against NVIDIA pricing power, not a replacement. Amazon, Google, and Microsoft continue deploying massive NVIDIA clusters despite internal alternatives.
Risk Factors
Execution Risks
- Blackwell production requires continued TSMC yield improvements
- Supply constraints creating backlog into mid-2026
- Vera Rubin transition timing uncertainty
Regulatory Risks
- China Antitrust: SAMR investigation announced September 2025
- Export Controls: Policy reversal risk under shifting administration
- Patent Litigation: Xockets lawsuit on DPU/Blackwell technology
Insider Activity
- $52.75M in insider sales in early January 2026
- 156 transactions in past 90 days (net -$150.37M)
- CEO Jensen Huang sold $1.76B over last 2 years
- Context: Structured selling for tax/compensation purposes, not loss of confidence
Valuation Risk
- Trading at ~30x forward revenue
- Premium valuation vulnerable to multiple compression
- Any execution miss would be severely punished
Trade Structure Analysis
Position Breakdown
Near-Term Earnings Play (Feb 20 Expiry):
- Total Premium: $19.2M
- Weighted Average Strike: ~$184
- Maximum Profit: Unlimited above breakeven
- Maximum Loss: $19.2M (total premium)
- Breakeven Range: $192-$195 depending on entry
LEAP Conviction Position (Jan 2027 Expiry):
- Premium: $4.3M at $180 strike
- Breakeven: $223 (+18% from current)
- Time Value: 340 days post-earnings
- Thesis: Structural AI capex cycle continues through 2027
Greeks Profile (Estimated)
| Position | Delta | Gamma | Vega | Theta |
|---|---|---|---|---|
| Feb 20 $180C | +5,950 | High | High | -$$$$ |
| Feb 20 $185C | +29,700 | Very High | Very High | -$$$$ |
| Feb 20 $190C | +15,750 | Very High | Very High | -$$$$ |
| Jan 27 $180C | +700 | Low | Moderate | -$ |
| Total | ~52,000 | High | High | Significant decay |
Position Interpretation:
- Delta exposure equivalent to
52,000 shares ($9.8M notional) - High gamma means position accelerates on directional moves
- High vega benefits from IV expansion into earnings
- Significant theta decay requires rapid directional move
Analyst Consensus
Price Targets
| Firm | Rating | Target | Upside |
|---|---|---|---|
| Evercore ISI | Outperform | $352 | +86% |
| Cantor Fitzgerald | Overweight | $300 | +59% |
| Bank of America | Buy | $275 | +45% |
| Goldman Sachs | Buy | $250 | +32% |
| Morgan Stanley | Overweight | $250 | +32% |
Consensus Summary
- Strong Buy Consensus: 39 analysts
- Buy Ratings: 57 | Hold: 0 | Sell: 0
- Average Target: $255.82 (+34% upside)
- Target Range: $100 - $352
Flow Interpretation & Trading Thesis
Bullish Case (Primary Thesis)
- Earnings Beat Probability: High - Q3 beat by 8% on revenue, guidance historically conservative
- Blackwell Momentum: Production ramp validated, $500B pipeline provides visibility
- Catalyst Density: Earnings Feb 25 + GTC March 16-19 creates sustained upside momentum
- Analyst Support: Zero sell ratings, average target 34% above current price
- Technical Setup: Bounce from pivot bottom on Feb 5, momentum building
Bearish Considerations
- Priced for Perfection: Any guidance miss would trigger significant correction
- Insider Selling: Continued sales, though structured
- China Regulatory Overhang: Antitrust investigation unresolved
- Competition Emerging: AMD MI400 credible threat in H2 2026
- Valuation Premium: 30x forward revenue leaves no margin for error
Flow Signal Interpretation
Institutional Conviction: 8/10
The $23.5M premium deployment across concentrated strikes and single expiration signals high conviction:
- Morning execution (09:30-10:30) suggests prepared institutional order
- Size consistency ($3-8M per trade) indicates single or coordinated actor
- Strike selection (ITM to ATM) prioritizes delta exposure over leverage
- LEAP inclusion ($4.3M) shows multi-quarter conviction, not just event trading
Bottom Line
Verdict: This is aggressive pre-earnings institutional positioning betting on another beat-and-raise cycle from NVIDIA. The concentrated premium in Feb 20 expiry captures the February 25 earnings event, while the LEAP position reflects structural conviction in AI infrastructure spending through 2027.
Key Levels to Watch:
- Support: $180 (gamma wall), $175 (implied move lower bound)
- Resistance: $190 (current ATM), $197 (implied move upper), $207 (ATH)
- Post-Earnings Target: $200-210 on strong guidance, sub-$175 on any disappointment
Catalyst Score: 8.5/10 - High conviction event-driven setup with defined risk
Disclosures
This analysis is for informational purposes only and does not constitute investment advice. Options trading involves significant risk of loss. Past performance does not guarantee future results. The unusual options activity identified may represent hedging, institutional positioning, or speculative trading by various market participants.