🔥 NVDA $125M Multi-Leg Options Structure - Institutional Call Condor Collects $59M Net Premium
📅 February 27, 2026 | 🎯 Unusual Activity Detected
🎯 The Quick Take
A massive, coordinated 4-leg options structure just hit the tape on NVIDIA at 10:06:06 this morning -- 32,000 contracts per leg, all June 18th expiration, totaling ~$125M in notional premium. The structure: sell the $190 calls ($51M), buy the $205 calls ($33M), sell the $210 calls ($28M), and sell the $235 calls ($13M). Net credit collected: approximately $59 million. This is an institutional-grade income play that profits if NVDA stays below $190 by June -- or at worst below $205 -- just two days after earnings disappointed the market. Translation: A major player is betting NVIDIA's post-earnings ceiling holds through the summer.
📊 Company Overview
NVIDIA Corporation (NVDA) is the undisputed leader in AI infrastructure and data center accelerators:
- Market Cap: $4.49 Trillion (3rd largest company globally)
- Industry: Semiconductors & Related Devices
- Exchange: NASDAQ
- Current Price: ~$178 (down from $184.89 close on Feb 26)
- Primary Business: AI/data center GPUs (80%+ of revenue), networking, gaming, automotive, robotics
Quick fundamentals snapshot:
| Metric | Value |
|---|---|
| FY2026 Revenue | $215.9B (+65% YoY) |
| Q4 FY2026 Revenue | $68.1B (+73% YoY, beat $66.2B consensus) |
| Q1 FY2027 Guide | $78B (+/- 2%, beat $72.6B consensus) |
| Forward P/E | ~23.6x (below semiconductor average of ~44x) |
| 52-Week Range | $86.62 - $212.19 |
| All-Time High | $207.03 (Oct 29, 2025) |
NVIDIA reported a beat-and-raise quarter on February 25 but shares fell 5.5% as the market focused on decelerating sequential growth rates and zero revenue from China exports. The stock is now trading ~14% below its all-time high.
💰 The Option Flow Breakdown
The Tape (February 27, 2026 @ 10:06:06) -- Simultaneous 4-Leg Execution:
| Time | Symbol | Side | Buy/Sell | Type | Expiration | Premium | Strike | Volume | OI | Size | Spot | Option Price | Option Symbol |
|---|---|---|---|---|---|---|---|---|---|---|---|---|---|
| 10:06:06 | NVDA | BID | SELL | CALL $190 | 2026-06-18 | $51M | $190 | 32K | 36K | 31,999 | $181.87 | $15.80 | NVDA20260618C190 |
| 10:06:06 | NVDA | MID | BUY | CALL $205 | 2026-06-18 | $33M | $205 | 32K | 40K | 31,999 | $181.87 | $10.25 | NVDA20260618C205 |
| 10:06:06 | NVDA | BID | SELL | CALL $210 | 2026-06-18 | $28M | $210 | 32K | 54K | 31,999 | $181.87 | $8.75 | NVDA20260618C210 |
| 10:06:06 | NVDA | BID | SELL | CALL $235 | 2026-06-18 | $13M | $235 | 32K | 48K | 31,999 | $181.87 | $3.95 | NVDA20260618C235 |
Open/Close Assessment: STO (Sell-to-Open) for the three sold legs, BTO (Buy-to-Open) for the $205 buy. Confidence: LOW (intraday mode, no prior-day OI comparison available).
🤓 What This Actually Means
This is a complex multi-leg call structure executed simultaneously across four strikes. Let's break down the anatomy:
The Structure: Modified Call Condor / Ratio Spread
- 📉 Sell 32K $190 calls at $15.80 = $50.6M collected (deepest ITM leg, ~$8 in-the-money at execution)
- 📈 Buy 32K $205 calls at $10.25 = $32.8M paid (protective upside hedge)
- 📉 Sell 32K $210 calls at $8.75 = $28.0M collected (caps the $205 long)
- 📉 Sell 32K $235 calls at $3.95 = $12.6M collected (far OTM premium harvest)
Net credit: ~$58.4M ($5.55 net credit per share across 3.2M shares)
Why this structure?
This is NOT a simple bet. This is a sophisticated income overlay most likely placed against an existing long stock position. The trader is:
- Selling calls at $190 (currently in-the-money) -- harvesting maximum premium, accepting assignment risk above $190
- Buying the $205/$210 call spread -- creating a short $5-wide spread that generates $1.50 credit but limits risk between $205-$210
- Selling far OTM $235 calls -- collecting additional premium from a strike ~30% above current price with near-zero probability of being breached
The net position profile:
- Maximum profit: ~$59M if NVDA below $190 at June expiry (all options expire worthless, keep entire credit)
- Reduced profit zone: $190-$205 (the $190 short call loses dollar-for-dollar, offset by net credit)
- Pain zone: $205-$210 (long call offsets $190 loss, but $210 short call adds exposure)
- Danger zone: Above $235 (naked short call exposure, though partially offset by overall credit)
- Breakeven: Approximately $195.55 on the upside ($190 + $5.55 net credit)
What this tells us about the trader's view:
- 🎯 Moderately bearish to neutral through June 2026 -- believes NVDA stays range-bound after post-earnings selloff
- 💰 Yield generation -- likely owns the underlying stock and is overwriting for income during a consolidation phase
- 📊 Probability play -- $190 is 6.8% above current price; the options market gives ~40% probability of NVDA above $190 by June
- ⏰ Strategic timing -- executed two days after the post-earnings selloff, suggesting conviction that the recent weakness persists
📈 Technical Setup / Chart Check-Up
YTD Performance Chart
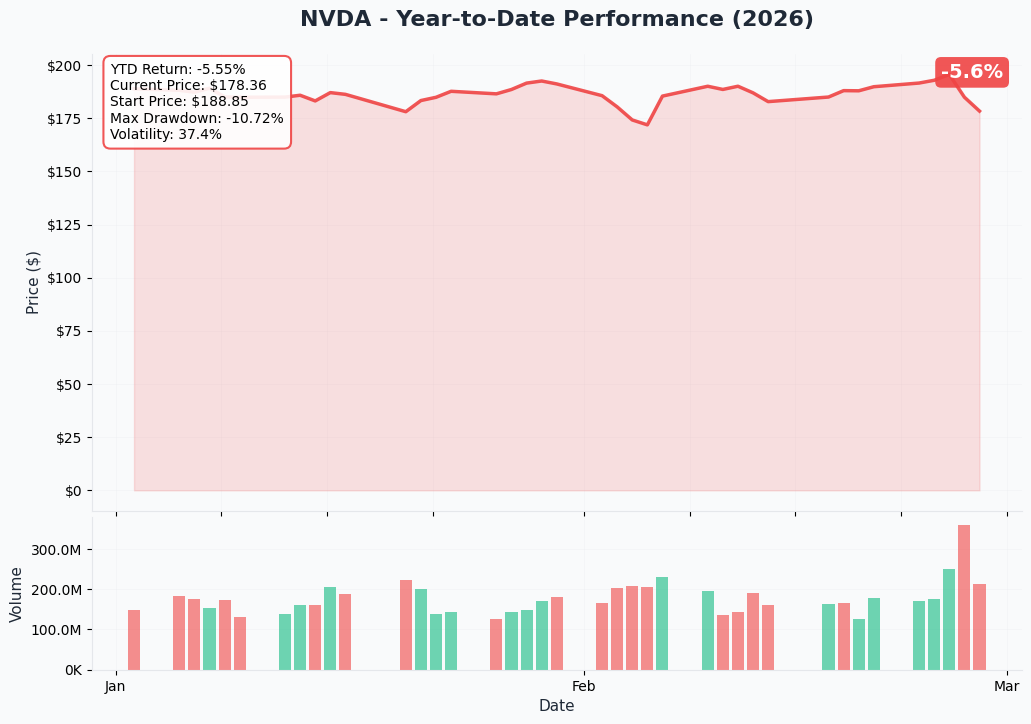
NVDA has been on a wild ride this year. After hitting an all-time closing high of $207.03 on October 29, 2025, the stock pulled back during the DeepSeek panic, recovered to ~$193 in mid-February, then sold off 5.5% post-earnings on February 26 to close at $184.89. Today it is trading around $178 -- roughly 14% below its all-time high.
Key observations:
- 📉 Post-earnings pressure: The two-day decline from $193 to $178 has been swift and decisive
- 🔄 Filling the gap: Price action is testing the range established before the February rally attempt
- ⚡ Elevated volatility: NVDA implied volatility remains high coming out of earnings week
- 📊 Volume heavy: Institutional repositioning evident in block-size options trades like this one
- 🤔 Below the all-time high: The $207 peak is now a distant memory as the stock digests decelerating growth expectations
Gamma-Based Support & Resistance Analysis
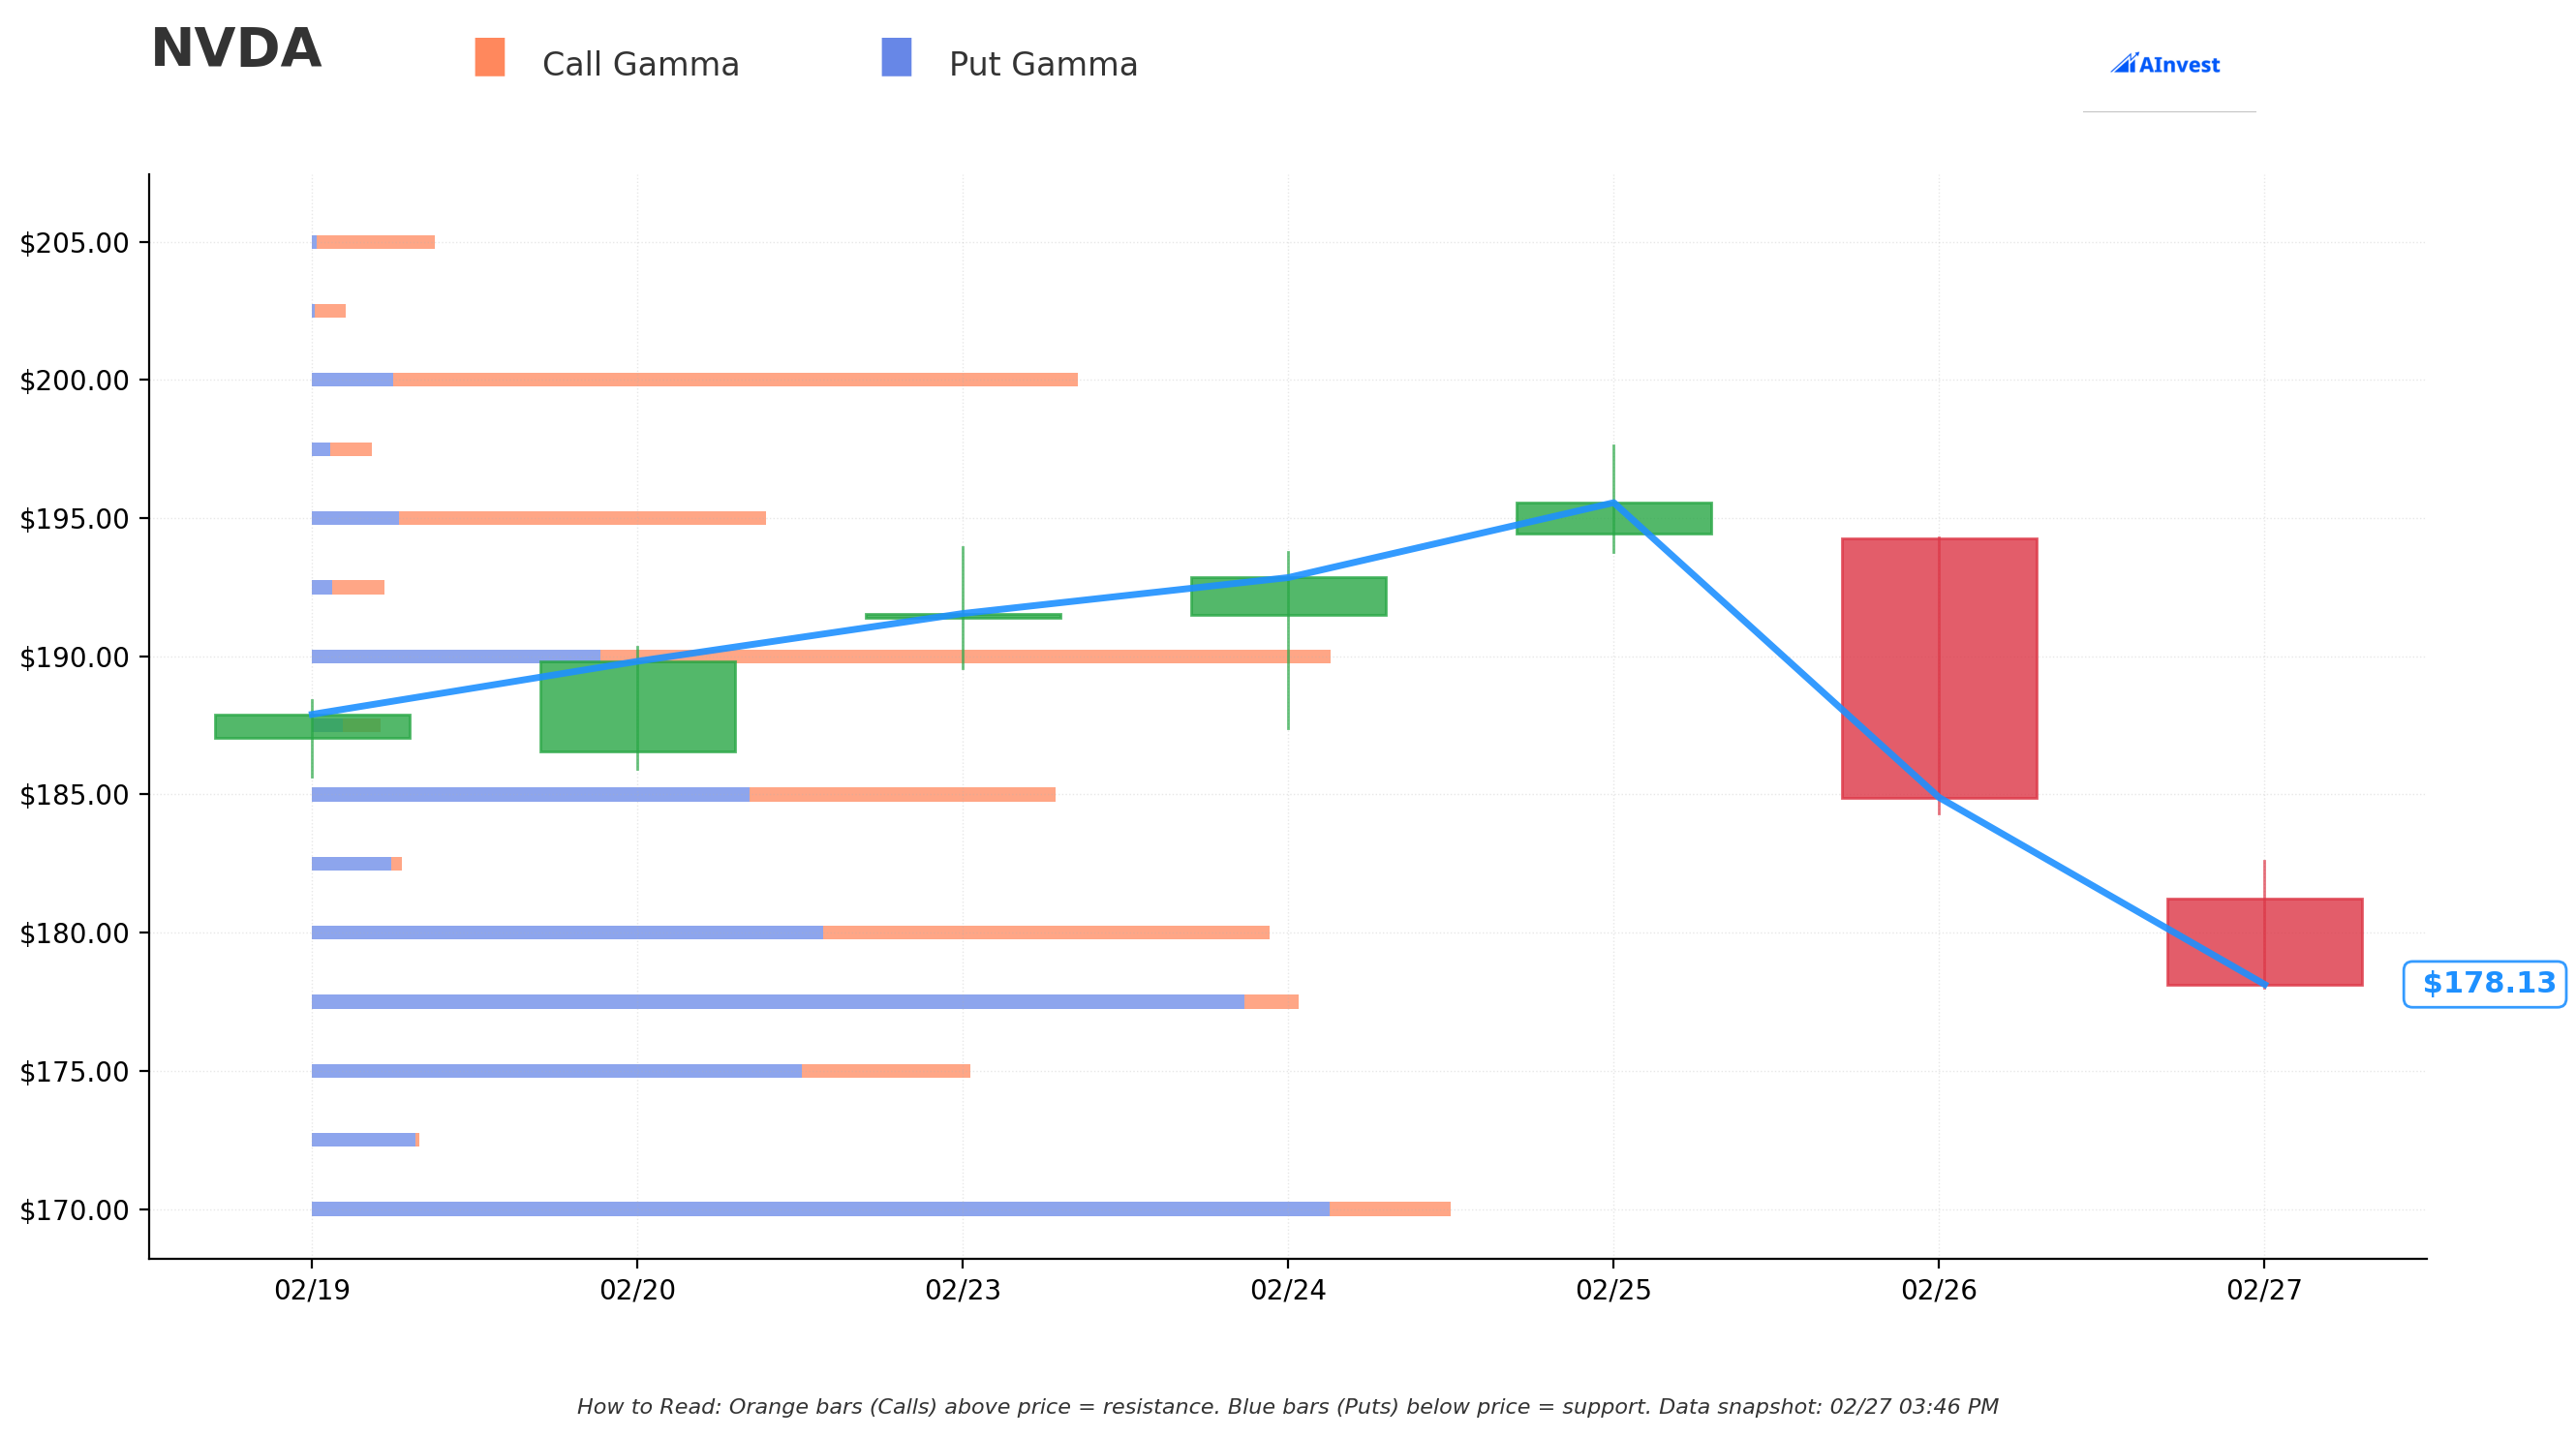
Current Price: ~$178
The gamma exposure map reveals critical price levels where market maker hedging activity will influence near-term price action:
🔵 Support Levels (Put Gamma Below Price):
- $177.50 - Immediate support with 188.6B total gamma exposure (strongest nearby floor!)
- $175 - Secondary support at 111.5B gamma (dealers buy dips here)
- $170 - Major structural floor at 189.8B gamma (highest total GEX among supports -- LINE IN THE SAND)
- $160 - Deep support at 80.5B gamma (disaster scenario, 10% below current)
🟠 Resistance Levels (Call Gamma Above Price):
- $180 - Immediate resistance at 199.4B gamma (STRONGEST overall level -- just 1.2% above current!)
- $185 - Secondary resistance at 116.4B gamma (4% above current)
- $190 - Major ceiling at 164.7B gamma (6.8% above -- AND the short call strike in this trade!)
- $195 - Extended resistance at 74.4B gamma
- $200 - Round number psychological barrier at 126.1B gamma (12.4% above current)
- $210 - Far upside resistance at 56.4B gamma (18% above -- another strike in the trade!)
What this means for traders: NVDA is sitting right on top of the $177.50 support level with the massive $180 resistance ceiling just overhead. The gamma data shows the stock is in a tight band between $177.50 support and $180 resistance -- a compression zone that typically resolves with a directional breakout.
Net GEX Bias: Bearish (total call GEX of 865B vs put GEX of 1,011B). When put gamma exceeds call gamma, market makers are positioned in a way that can amplify downside moves. Dealers must sell into weakness to hedge, which means dips can accelerate.
Notice anything? The option trader's $190 short call strike sits right at a major gamma resistance wall (164.7B). They are betting that $190 acts as a natural ceiling where dealer hedging flows create selling pressure. If NVDA cannot break $190 -- which the gamma map suggests will be difficult -- the entire trade profits. Smart positioning.
Implied Move Analysis
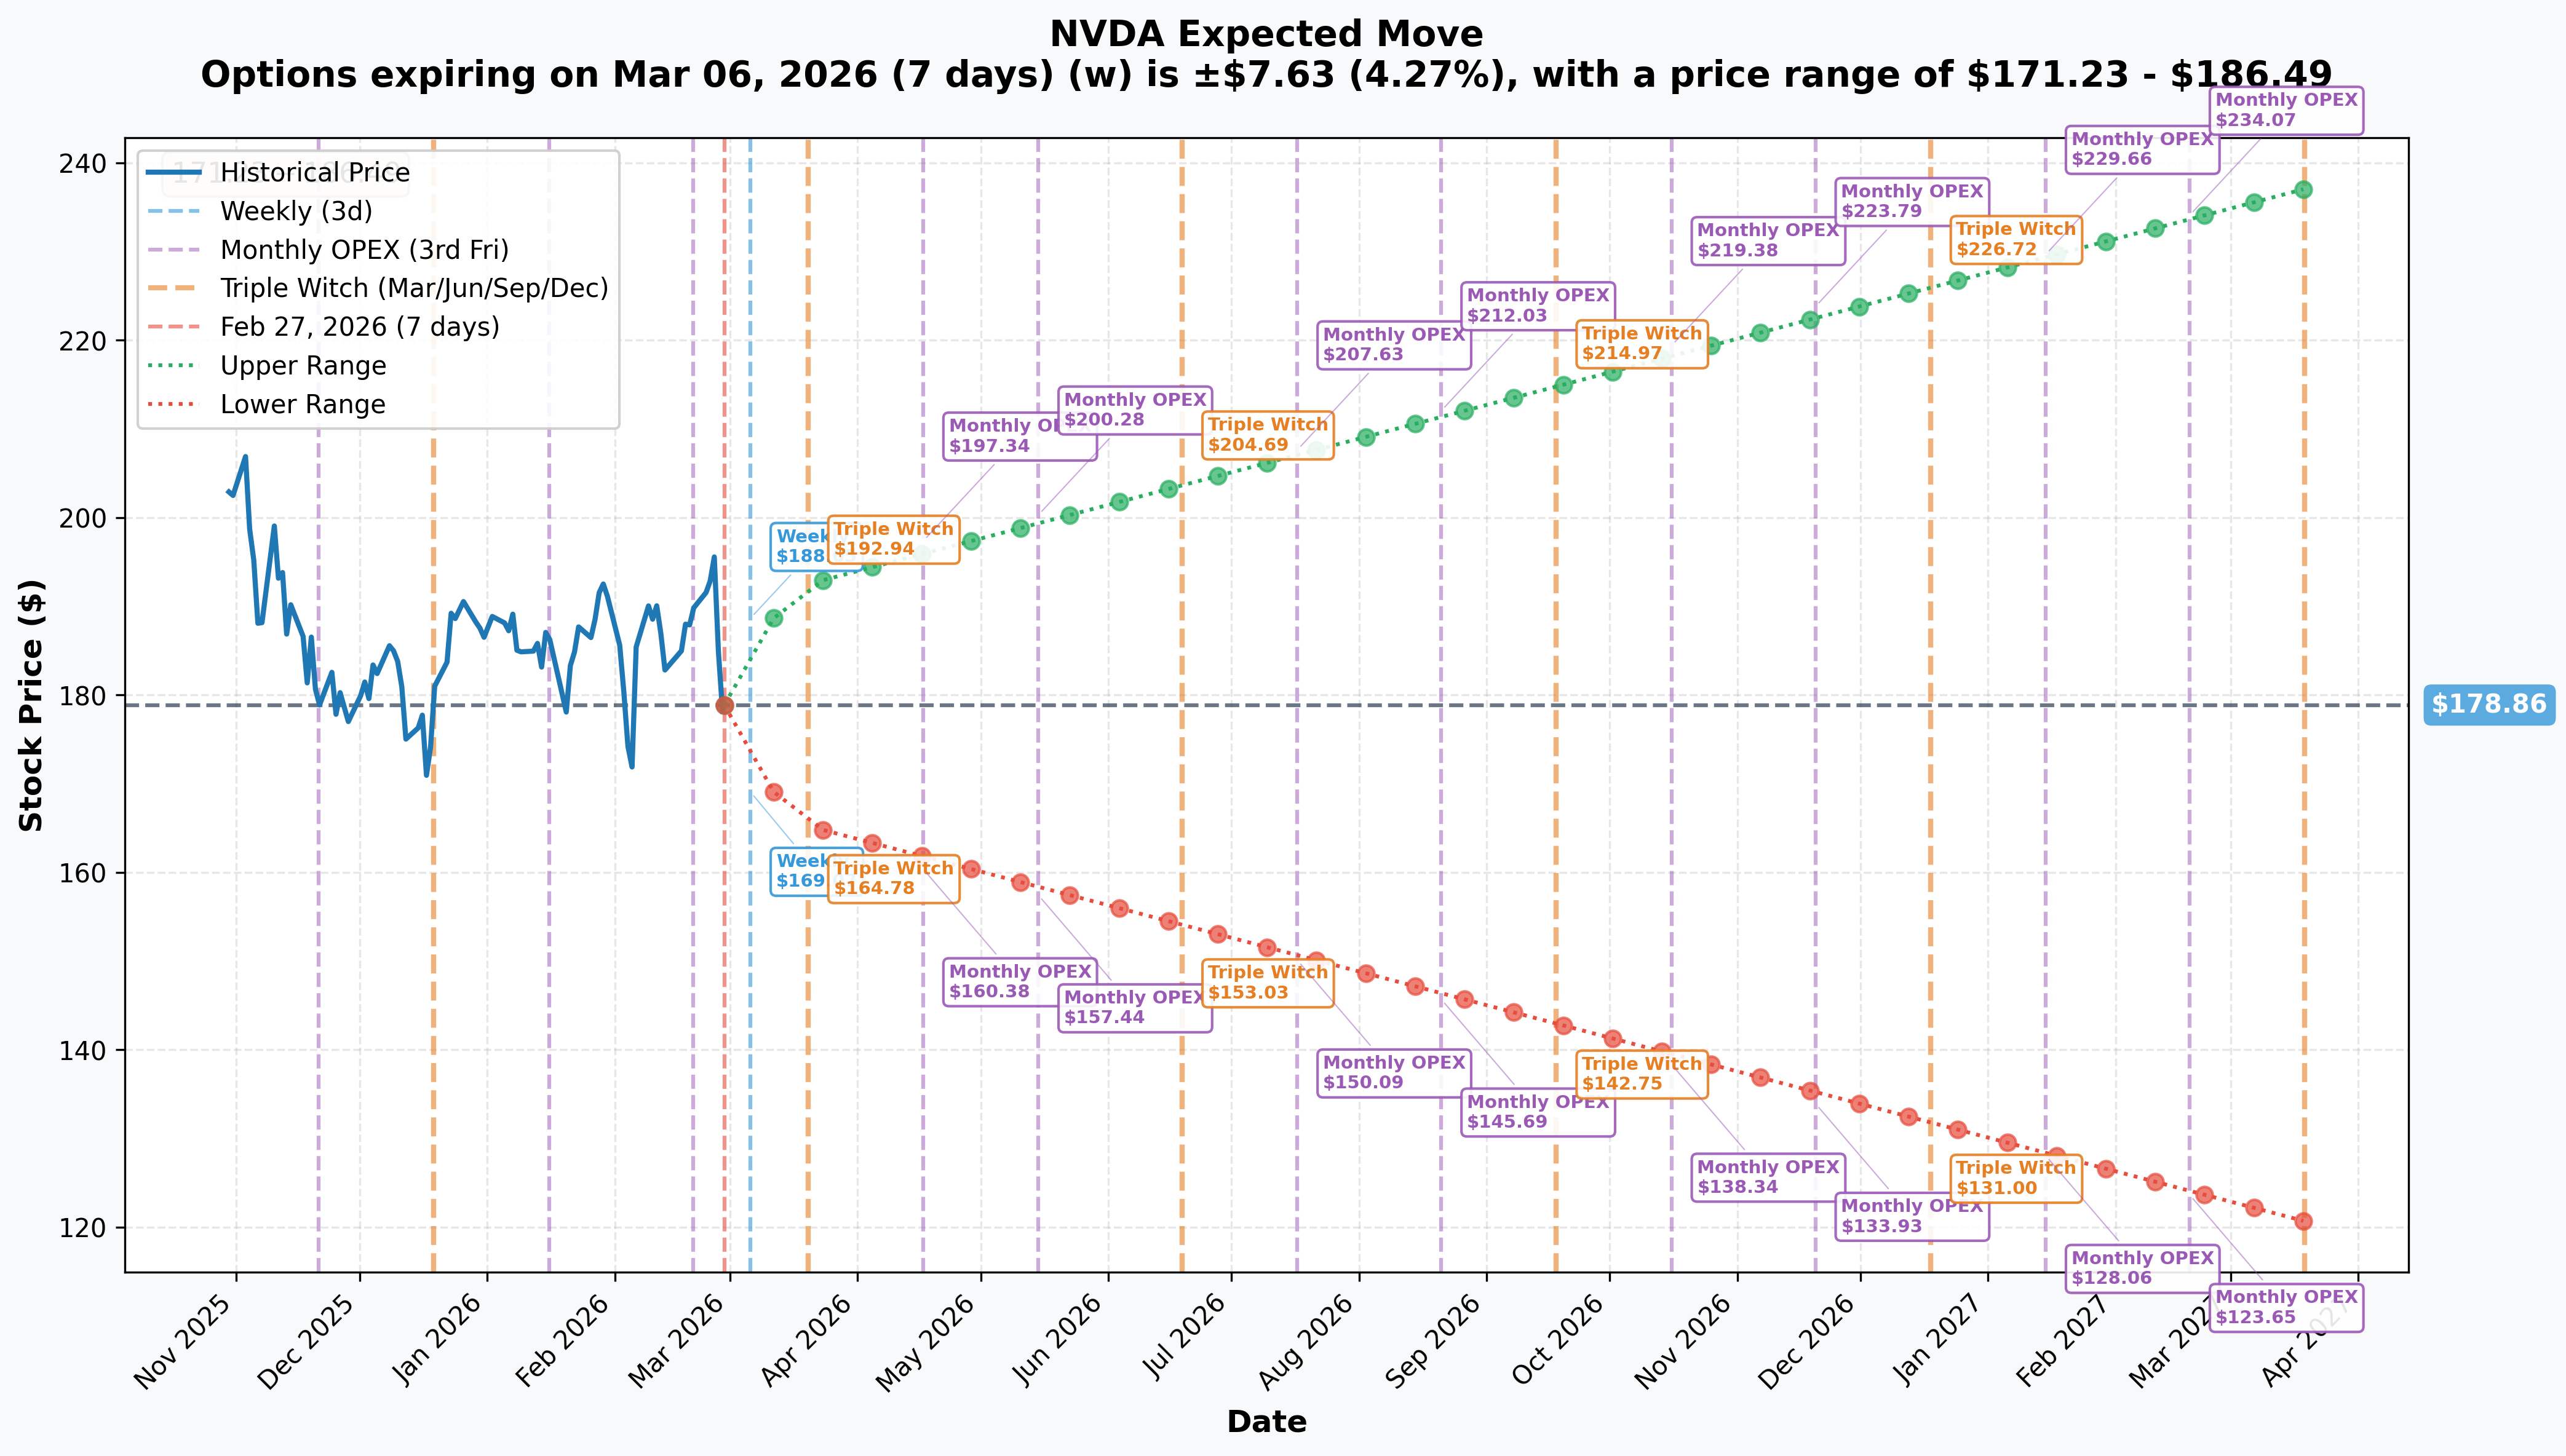
Options market pricing for upcoming expirations:
| Timeframe | Expiry | Implied Move | Range |
|---|---|---|---|
| 📅 Weekly (Mar 6) | 7 days | ±4.27% ($7.63) | $171.23 - $186.49 |
| 📅 Monthly OPEX (Mar 20) | 21 days | ±7.65% ($13.69) | $165.18 - $192.55 |
| 📅 Triple Witch (Jun 19) | 112 days | ±14.4% (~$25.83) | $153.03 - $204.69 |
| 📅 LEAPS (Mar 2027) | 385 days | ±32.58% ($58.27) | $120.59 - $237.13 |
Translation for regular folks: The options market is pricing in a ±4.3% move ($7.63) over the next week and a whopping ±7.65% ($13.69) through March OPEX on the 20th. That is a wide range for the world's third-largest company -- reflecting continued post-earnings uncertainty and the upcoming GTC conference on March 16-19.
The critical number for this trade: The June Triple Witch implied move upper boundary is $204.69. The option trader's $205 long call strike aligns almost exactly with this level. They are using the options market's own probability distribution to structure their risk -- the market says there is roughly a 15-20% chance NVDA exceeds $205 by June. The trader is saying, "I agree, and I want to get paid for that view."
The $235 short call strike is well beyond even the LEAPS upper range of $237 -- implying the options market prices near-zero probability of NVDA reaching $235 by June. That leg is pure premium collection.
🎪 Catalysts
🔥 Immediate Catalysts (Next 30 Days)
GTC 2026 -- March 16-19, 2026 (San Jose) 🚀
This is NVIDIA's flagship AI conference with 500+ sessions and 300+ exhibits. Historically the venue for major product reveals. Expected announcements:
- Deep-dive on the Vera Rubin platform (50 petaflops FP4, 10x inference cost reduction vs Blackwell)
- Rubin CPX details for massive-context inference workloads
- Enterprise AI software and Omniverse updates
- Robotics platform updates (Boston Dynamics, LG, NEURA partnerships)
Last year's GTC saw NVDA rally ~15% in the week following Jensen's keynote. This is the single most important near-term catalyst and could challenge the trade's $190 ceiling if announcements are strong enough.
Post-Earnings Digestion Period 📊
The Q4 FY2026 beat-and-raise on February 25 saw $68.1B revenue (+73% YoY) and $78B Q1 guidance (vs $72.6B consensus). Despite crushing estimates, shares fell 5.5% as investors focused on:
- Decelerating sequential growth rates (73% to ~51% YoY)
- Zero China Data Center compute revenue in guidance
- Broader questions about whether AI capex returns justify $650B+ in spending
The market needs time to digest this print. Analyst reactions have been supportive -- BofA reiterated Buy with a $275 target, JPM at $265, Goldman at $250 -- but the stock price is not cooperating.
📅 Medium-Term Catalysts (April - June 2026)
Q1 FY2027 Earnings -- May 27, 2026 (After Close) 📊
This is the next major data point and falls just three weeks before the trade's June 18 expiration.
| Metric | Guidance / Estimate |
|---|---|
| Revenue | $78.0B +/- 2% |
| Non-GAAP Gross Margin | ~75.0% +/- 50bps |
| BofA FY2027 Revenue Est. | $342.3B, EPS $8.00 |
Key metrics to watch: Blackwell vs Hopper revenue mix, Rubin customer commitments, networking growth trajectory ($11B+ sustainable?), and any China revenue surprise (currently guided to zero).
Rubin Volume Shipments -- H2 2026 🔬
Jensen confirmed on the Q4 call that Rubin samples have already shipped to lead customers as of the week of February 25. Volume shipments to AWS, Google Cloud, Microsoft Azure, OCI, CoreWeave, Lambda, Nebius, and Nscale are expected in H2 2026. This is a positive long-term catalyst but unlikely to materially impact the stock before the June expiration.
Hyperscaler Capex Cycle 💰
The Big Five have committed $650-690B in 2026 capex, nearly doubling 2025 levels. NVIDIA captures an estimated 30% of total AI data center spending as profit. Any hyperscaler capex downgrade would be a major negative; any acceleration would be bullish.
⚠️ Risk Catalysts That Could Challenge This Trade
China Export Resolution (Upside Risk to Trade) 🇨🇳
NVIDIA has generated zero revenue from US-approved H200 exports to China. China's customs authorities have blocked imports. On February 26, NVIDIA received a US license for a "small amount" of H200 exports. Any meaningful China revenue would be pure upside since guidance assumes zero -- this could push NVDA above $190 and threaten the trade.
DOJ Antitrust Investigation (Downside Risk, Helps Trade) ⚖️
The DOJ investigation into NVIDIA's chip distribution practices continues. The $20B Groq acquisition structure is under scrutiny, with Senators calling on FTC/DOJ to investigate. Any formal action would pressure shares and benefit the short call position.
AMD MI400 Launch -- H2 2026 🏭
AMD's MI400 series claims 10x performance over MI300X with 432GB HBM4. This is the most credible competitive threat to NVIDIA in data center AI and could weigh on sentiment through the summer if benchmarks impress.
🎲 Price Targets & Probabilities
Using gamma levels, implied move data, and catalyst timing, here are the scenarios through the June 18 expiration:
📈 Bull Case (25% probability)
Target: $200-$220
How we get there:
- 🚀 GTC 2026 delivers blockbuster Rubin announcements that reignite investor enthusiasm
- 🇨🇳 Meaningful China export breakthrough adds surprise revenue to Q1
- 💰 Q1 earnings on May 27 beat the already-aggressive $78B guide with margin expansion
- 📊 Hyperscaler capex accelerates further with new sovereign AI contracts
- 📈 Breakout above $190 gamma resistance triggers momentum buying to $200 round number
Impact on the trade: This is the danger zone. NVDA above $195.55 (breakeven) means the trade loses money. Above $205, the long call kicks in for partial protection, but naked exposure above $235 creates unlimited risk. At $220, estimated loss: ~$50-80M depending on remaining time value.
Why only 25%: Requires multiple positive catalysts to align while the market is actively repricing growth deceleration. Gamma resistance at $190 and $200 creates structural headwinds. Post-earnings momentum is firmly negative.
🎯 Base Case (50% probability)
Target: $170-$190 range (CONSOLIDATION)
Most likely scenario:
- 📊 Stock digests post-earnings selloff and finds support in the $170-$180 gamma zone
- 🎪 GTC provides incremental positives but no game-changing surprises (market has high expectations)
- ⏰ Time decay works in the seller's favor as June approaches without a major re-rating catalyst
- 📉 Volatility compression post-earnings and post-GTC reduces option premiums across the board
- 🔄 Trading range develops between $170 support and $190 resistance through spring
Impact on the trade: This is the sweet spot. If NVDA stays below $190 through June, all four legs expire worthless and the trader keeps the entire ~$59M credit. Even at $185, the $190 short call only costs $5 intrinsic minus the $5.55 credit = small gain.
Why 50%: Gamma data shows bearish bias with $180 as immediate resistance. Post-earnings momentum is negative. The market needs a strong catalyst to push above $190, and the next one (Q1 earnings on May 27) is just three weeks before expiration -- leaving little time for follow-through.
📉 Bear Case (25% probability)
Target: $150-$170 (POST-EARNINGS HANGOVER DEEPENS)
What could go wrong for NVDA:
- 😰 GTC 2026 disappoints -- no new product surprises, Rubin timeline slips
- 🇨🇳 China export situation worsens with new restrictions or Congressional legislation blocking licenses
- ⚖️ DOJ antitrust action escalates to formal charges or consent decree
- 💸 Hyperscaler capex pullback signals emerge (even one major cloud provider cutting guidance)
- 🤖 DeepSeek withholding models from NVIDIA signals broader decoupling trend
- 📉 Break below $170 gamma support triggers cascade toward $160
Impact on the trade: Maximum profit scenario. All options expire worthless far out of the money. The trader keeps the full ~$59M credit and potentially profits on the underlying stock decline if they also hold puts or are short.
Why 25%: Requires fundamental deterioration beyond what's already priced in. NVIDIA's business remains extremely strong ($78B Q1 guide, 75% gross margins). The forward P/E of ~23.6x already reflects meaningful growth deceleration. The average analyst target of ~$260 implies 40% upside, suggesting the Street still sees significant value.
💡 Trading Ideas
🛡️ Conservative: Wait for GTC Clarity, Buy the Dip to Gamma Support
Play: Accumulate NVDA shares on weakness toward $170 gamma support, with a stop below $160
Why this works:
- 📊 The $170 strike has 189.8B total gamma exposure -- the strongest support level in the entire chain. Market makers will aggressively buy dips at this level to hedge their books.
- 💰 At $170, NVDA trades at ~21x forward earnings on BofA's $8.00 FY2027 EPS estimate -- genuinely cheap for a company growing revenue 50%+ YoY
- 🎪 GTC 2026 (March 16-19) could act as a positive catalyst; buying before the event at depressed levels offers favorable risk/reward
- 🛡️ $60B buyback authorization provides a corporate floor under the stock
- 📈 Consensus price target of ~$260 implies ~47% upside from $177 -- strong asymmetry
Action plan:
- 🎯 Start small position at $175-$178 (current levels, near gamma support)
- 📈 Add aggressively if stock dips to $170 (major gamma wall)
- ⛔ Hard stop below $160 (next gamma level, ~10% downside risk)
- 📅 Hold through GTC and into Q1 earnings (May 27) for full catalyst exposure
- 🎯 Take 25-30% profits at $190 (gamma resistance), reassess for $200+
Risk level: Low-Moderate | Skill level: Beginner-friendly
Expected return: 10-40% if NVDA recovers to $195-$250 range over 3-6 months
⚖️ Balanced: Bull Call Spread Targeting GTC Rally
Play: Buy the April $180/$195 call spread for ~$5.50, targeting a GTC-driven recovery
Structure:
- Buy 1x April 17 $180 call (~$10.50)
- Sell 1x April 17 $195 call (~$5.00)
- Net debit: ~$5.50 per spread ($550 per contract)
Why this works:
- 🎪 GTC 2026 on March 16-19 is historically NVIDIA's strongest annual catalyst (stock rallied ~15% after GTC 2025)
- 📊 The $180 strike is just 1.2% above current price at the nearest gamma resistance -- a small push higher breaks through
- 🎯 The $195 cap aligns with the $195 gamma resistance level and keeps the trade affordable
- ⏰ April 17 expiration gives 49 days -- enough time for GTC hype to play out and begin price discovery
- 💰 Risk/reward: Pay $5.50 to potentially make $15 (max profit $9.50 = 173% return if NVDA above $195)
- 📊 Implied move through March OPEX is ±$13.69, meaning a rally to $192+ is within the expected range
Estimated P&L:
- 📈 NVDA at $195+ by April 17: Max profit = $9.50 per spread (173% ROI)
- 📈 NVDA at $190 by April 17: Profit = $4.50 per spread (82% ROI)
- 🎯 Breakeven: $185.50 (4.3% above current -- within weekly implied move)
- 📉 NVDA below $180: Max loss = $5.50 per spread (100% loss)
Position sizing: Risk 3-5% of portfolio. At $550 per contract, 10 contracts = $5,500 max risk.
Risk level: Moderate (defined risk, bullish directional) | Skill level: Intermediate
🚀 Aggressive: Sell Put Spread Into Post-Earnings Fear (EXPERIENCED ONLY)
Play: Sell the March 20 $170/$160 put spread to collect premium while volatility is elevated
Structure:
- Sell 1x March 20 $170 put (~$5.00)
- Buy 1x March 20 $160 put (~$2.50)
- Net credit: ~$2.50 per spread ($250 per contract)
Why this works:
- 💥 Post-earnings implied volatility is still elevated -- puts are EXPENSIVE, which benefits sellers
- 📊 The $170 strike sits at the strongest gamma support level (189.8B total GEX) -- market makers will defend this level
- 🎪 March 20 expiration falls after GTC 2026 (March 16-19) -- if GTC is positive, puts collapse in value rapidly
- 💰 Collecting $2.50 on a $10-wide spread = 25% return on capital at risk if NVDA stays above $170
- 📉 Probability of profit: ~70%+ based on implied move data (lower March range is $165.18)
- 🛡️ Even in the bear case, $170 has massive gamma support and the $160 long put limits max loss
Estimated P&L:
- ✅ NVDA above $170 at March 20 OPEX: Keep full $2.50 credit (33% return on $7.50 risk)
- ⚠️ NVDA at $167.50: Breakeven (no profit, no loss)
- 📉 NVDA at $160 or below: Max loss $7.50 per spread ($750 per contract)
- 💀 Below $160: Loss capped at $7.50 (no naked exposure)
Why this could blow up:
- 😰 GTC disappoints AND macro deterioration pushes NVDA below $170 gamma support
- 🇨🇳 New China export restrictions announced before March 20
- 📉 Broader tech selloff drags semiconductor sector lower
- 🎢 $170 gamma support breaks, triggering a cascade to $160
Position sizing: Risk only 2-3% of portfolio. Max loss is defined and limited.
Risk level: HIGH (potential for significant loss on capital at risk) | Skill level: Advanced
⚠️ Risk Factors
Don't get caught by these potential landmines:
-
📉 Post-earnings momentum is negative: NVDA dropped 5.5% after the February 25 earnings report despite beating on every metric. This "sell the news" reaction after a beat-and-raise quarter signals that investors are repricing growth expectations. The market is telling you that 73% YoY growth is no longer enough when you're the world's third-largest company. The stock could continue drifting lower as the post-earnings overhang lingers.
-
🔄 Growth deceleration is real: Revenue growth went from 94% (Q3 YoY) to 73% (Q4 YoY). Q1 FY2027 guidance of $78B implies ~51% YoY growth. Still extraordinary for a $4.5T company, but the trend is unmistakably downward. Markets price acceleration, not just growth -- and NVDA is decelerating.
-
🇨🇳 China revenue is a zero with no clear path forward: NVIDIA has generated zero revenue from approved H200 exports. China's customs authorities are blocking imports. Congressional legislation may further restrict exports. Meanwhile, Huawei's Ascend 910C is capturing domestic market share. What was once a $10-15B annual opportunity may be permanently impaired.
-
⚖️ DOJ antitrust investigation creates regulatory overhang: The Department of Justice probe into NVIDIA's chip distribution practices continues with active subpoenas. The $20B Groq acquisition and RunAI deal are both under scrutiny. No charges have been filed, but the investigation weighs on sentiment and could limit upside.
-
🏭 Competitive threats are intensifying: AMD's MI400 series targets H2 2026 launch claiming 10x performance over MI300X. Google's Trillium TPUs are gaining traction (Anthropic committed to 1M TPUs by 2027). Amazon's Trainium2 and Microsoft's Maia 100 are reducing hyperscaler dependence on NVIDIA. The CUDA moat is real but eroding at the margins.
-
💰 AI spending ROI questions persist: Despite $650B+ in planned hyperscaler capex, markets remain nervous about whether AI revenue can justify these investments. Any pullback by even one major cloud provider would ripple through NVIDIA's order book. The post-earnings selloff reflects this anxiety.
-
📊 188 insider transactions in 90 days -- ALL sells, ZERO buys: Persistent net selling by insiders is common for appreciated stocks but still a yellow flag. If the people closest to the business are consistently reducing exposure, retail investors should take note. The $40.6B in buybacks partially offsets this, but the signal is clear.
-
🔬 Gross margin pressure during Rubin transition: FY2026 full-year GAAP gross margin was 71.1%, down from 75% in FY2025. Product transitions always compress margins. Sustaining 74%+ during the Blackwell-to-Rubin shift is not guaranteed, and any margin miss would be punished at this valuation.
-
🌐 TSMC single-source risk: NVIDIA's entire GPU lineup depends on TSMC fabrication (4nm for Blackwell, 3nm for Rubin). Any disruption -- geopolitical, natural disaster, or capacity constraints -- would directly impact NVIDIA's ability to meet demand. There is no Plan B.
-
🐋 This $59M trade itself signals institutional caution: When a sophisticated player collects $59M in call premium on a stock two days after earnings, they are expressing a view that upside is capped. This is not someone who thinks NVDA is heading to $250 by summer. Pay attention to what large players DO, not what analysts SAY.
🎯 The Bottom Line
Real talk: A major institutional player just collected $59 million in net premium by building a complex call structure that profits if NVDA stays below $190 through June. This trade was executed just two days after a beat-and-raise earnings report that still left the stock bleeding. The message is straightforward: smart money sees a ceiling on NVDA for the next four months.
What this trade tells us:
- 🎯 An institutional player believes NVDA's $190 level (6.8% above current price) acts as a hard cap through June Triple Witch
- 💰 They are willing to take on significant upside risk above $235 for a $59M payday -- that is high conviction
- 📊 The structure aligns perfectly with gamma resistance at $190 (164.7B GEX) and the implied move June upper range of $204.69
- ⏰ The timing is deliberate -- selling premium into elevated post-earnings volatility maximizes credit received
- 🔄 This is likely an overlay on existing long stock, not a naked directional bet -- an institution monetizing consolidation expectations
This is NOT a "sell NVDA" signal -- it is a "range-bound through summer" signal.
If you own NVDA:
- ✅ Consider selling covered calls at $190-$195 against your shares to generate income during consolidation (mirroring this institutional trade at smaller scale)
- 📊 Use the $170 gamma support as your mental floor -- if it breaks, risk management kicks in
- 🎪 GTC 2026 (March 16-19) is the next catalyst that could shake the stock out of this range -- watch closely
- ⏰ Q1 earnings on May 27 is the next binary event -- position accordingly
- 🛡️ At ~$178, you're buying at a forward P/E of ~22x for a company growing 50%+ -- long-term value is there, but near-term patience is required
If you are watching from the sidelines:
- 🎯 The $170-$175 zone offers the best risk/reward entry (major gamma support, sub-22x forward P/E, near implied move lower range)
- ⏰ Wait for GTC reaction before committing significant capital -- could provide clarity on Rubin timeline and competitive positioning
- 📊 The average analyst target of ~$260 implies 40-47% upside from current levels -- meaningful asymmetry for patient investors
- 🤔 If you want exposure but are nervous, the bull call spread ($180/$195 April) offers defined risk with GTC upside capture
If you are bearish:
- 📊 The gamma data supports your view -- net GEX bias is bearish, $180 resistance overhead is formidable
- 🎯 $170 is the first real support; break below targets $160 (10% downside from here)
- ⚖️ Consider bear put spreads rather than naked puts to manage cost of elevated IV
- ⚠️ Do NOT get short ahead of GTC without a plan -- Jensen Huang keynotes have a history of moving the stock 10%+ in either direction
Mark your calendar -- Key dates:
- 📅 March 6 - Weekly OPEX (±4.27% implied move)
- 📅 March 11 - Dividend record date
- 📅 March 16-19 - GTC 2026 (San Jose) -- MOST IMPORTANT NEAR-TERM CATALYST
- 📅 March 20 - Monthly OPEX / Triple Witch (±7.65% implied move)
- 📅 May 27 - Q1 FY2027 Earnings (After Close)
- 📅 June 18 - This trade's expiration (June Triple Witch)
- 📅 H2 2026 - Rubin volume shipments begin / AMD MI400 launch
Final verdict: NVDA's long-term thesis remains among the strongest in the market -- $650B+ in hyperscaler capex, the Rubin platform launching H2 2026, sovereign AI expansion, and a forward P/E of ~23x on projected $8+ EPS. But the near-term setup is messy. Post-earnings selling, growth deceleration, China uncertainty, antitrust overhang, and insider selling all point to a consolidation phase. The $59M institutional call overwrite confirms what the chart and gamma data are saying: NVDA likely stays rangebound between $170 and $190 through the spring, with GTC and Q1 earnings as the events that determine the next major move.
Be patient. Buy the gamma support dips. Let the catalysts come to you. At $170-$175, the risk/reward is compelling. At $190+, the institutional sellers are waiting.
Disclaimer: Options trading involves substantial risk of loss and is not suitable for all investors. This analysis is for educational purposes only and not financial advice. Past performance does not guarantee future results. The multi-leg options structure analyzed here reflects institutional positioning that may involve complex portfolio hedging not applicable to retail traders. The open/close assessment on these trades has LOW confidence (intraday mode). Always do your own research and consider consulting a licensed financial advisor before trading. Position sizing should reflect your personal risk tolerance and financial situation.
About NVIDIA Corporation: NVIDIA designs and manufactures graphics processing units (GPUs) and system-on-chip units for artificial intelligence, data centers, gaming, professional visualization, and automotive markets, with a market cap of $4.49 trillion in the Semiconductors & Related Devices industry.