🐋 NVDA $12M Deep ITM Call Buy - Institutional Stock Replacement Ahead of GTC! 🚀
📅 March 2, 2026 | 🔥 Unusual Activity Detected
🎯 The Quick Take
Someone just loaded up on $12 MILLION worth of deep in-the-money NVIDIA calls at 1:52 PM today — buying 3,000 contracts of the $150 strike June 18th calls right on the ASK, which screams urgency. With NVDA trading at $182.14, this is a stock replacement strategy giving the trader ~$54.6M of NVDA exposure for just $12M. The timing is no accident: GTC 2026 kicks off in just 14 days (March 16-19), where Jensen Huang has promised to unveil "chips the world has never seen before."
📊 Company Overview
NVIDIA Corporation (NVDA) is the undisputed leader in AI chip design, powering the global artificial intelligence revolution:
- Market Cap: ~$4.5 Trillion
- Exchange: NASDAQ
- Industry: Semiconductors & AI Computing
- Current Price: $182.14
- Primary Business: Data Center GPUs (91%+ of revenue), Gaming, Professional Visualization, Automotive
- Forward P/E: ~22x (compressed vs. 5-year average of ~64x)
NVIDIA just reported record Q4 FY2026 revenue of $68.1 billion (up 73% YoY), with full-year revenue hitting $215.9 billion. The stock dropped 5.6% post-earnings on February 26 despite the massive beat, creating what one analyst called "a coiled spring" at compressed valuations.
💰 The Option Flow Breakdown
📊 The Tape (March 2, 2026 @ 13:52:11)
| Time | Symbol | Side | Buy/Sell | Type | Expiration | Premium | Strike | Volume | OI | Size | Spot | Option Price |
|---|---|---|---|---|---|---|---|---|---|---|---|---|
| 13:52:11 | NVDA | ASK | BUY | CALL | 2026-06-18 | $12M | $150 | 90K | 24K | 3,000 | $182.14 | $40.00 |
🤓 What This Actually Means
This is a deep in-the-money call buy — a classic institutional stock replacement play. Let's break down the math:
- 🐋 Massive premium deployed: $12M ($40.00 per contract x 3,000 contracts)
- 🎯 Deep ITM position: $150 strike with NVDA at $182.14 = $32.14 intrinsic value
- ⏰ Cheap time value: Only $7.86 in time value ($40.00 - $32.14) for 108 days of exposure
- 📊 Notional exposure: 3,000 contracts = 300,000 shares = ~$54.6M worth of NVDA for just $12M
- ⚡ Leverage: Roughly 3x leverage compared to buying the stock outright
- 📈 Vol/OI ratio: 3.75x — Volume is almost 4 times the existing open interest, which is extremely unusual
- 💪 Z-Score: 155.82 — Classified as EXTREMELY UNUSUAL activity
- 🔥 Bought on the ASK — This trader hit the offer price, showing real urgency to get filled immediately
What's really happening here:
This is textbook institutional position building. By buying deep ITM calls with a delta around 0.85+, this trader gets nearly dollar-for-dollar exposure to NVDA's upside while tying up only ~22% of the capital needed to buy the equivalent shares. At $40 per contract with $32.14 in intrinsic value, they're paying a very modest premium for 108 days of leveraged upside through both GTC (March 16-19) and Q1 earnings (May 27).
The fact they hit the ASK — paying full ask price rather than working a limit order at the mid — tells you this is not someone casually putting on a position. This is urgent, conviction-driven capital deployment. The Vol/OI ratio of 3.75x means today's volume alone is nearly 4 times all existing open positions at this strike, which happens only a handful of times per month on a name like NVDA.
📈 Technical Setup / Chart Check-Up
YTD Performance Chart
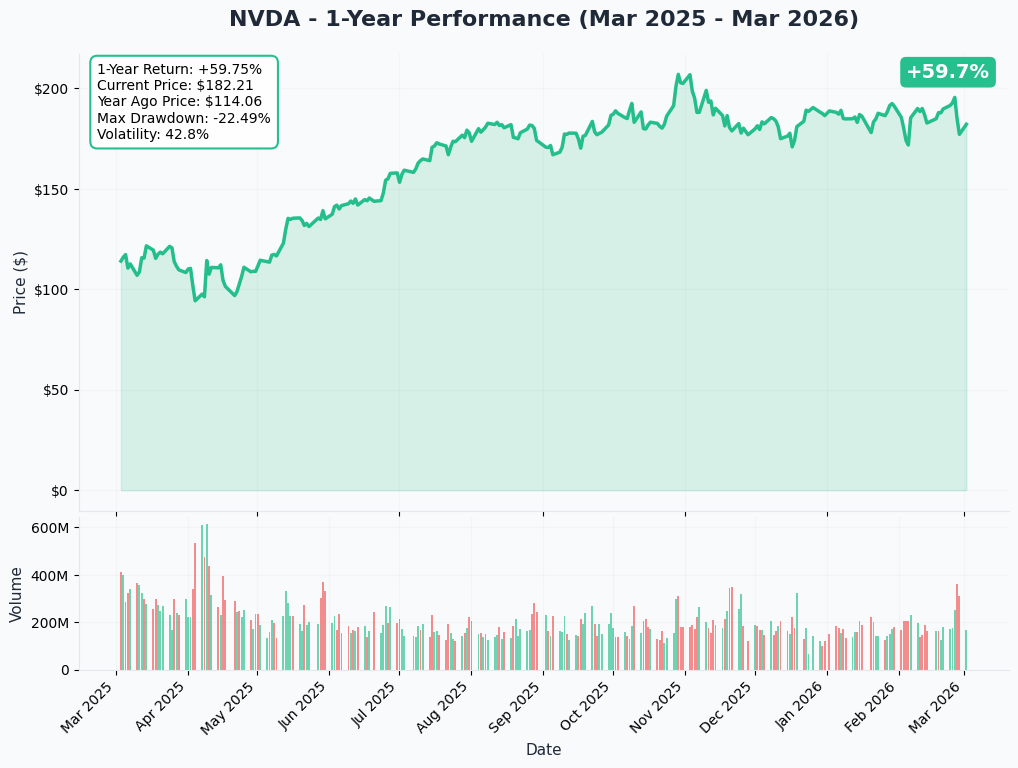
NVIDIA is up +59.7% over the past year with a current price of $182.21. The stock rallied from ~$114 a year ago to an all-time high of $212.19 in late October 2025, then pulled back and has been consolidating in the $170-$190 range since early 2026.
Key observations:
- 📈 Strong long-term trend: Nearly 60% return over the trailing year despite recent weakness
- 📉 Post-earnings dip: The 5.6% drop on February 26 (despite record earnings) created a buying opportunity — and someone just took it
- 🎢 42.8% annualized volatility — this stock moves, which is why leveraged call exposure is attractive
- 🔄 Consolidation base: Trading between ~$175-$185 recently, building a potential launchpad into GTC
Gamma-Based Support & Resistance Analysis
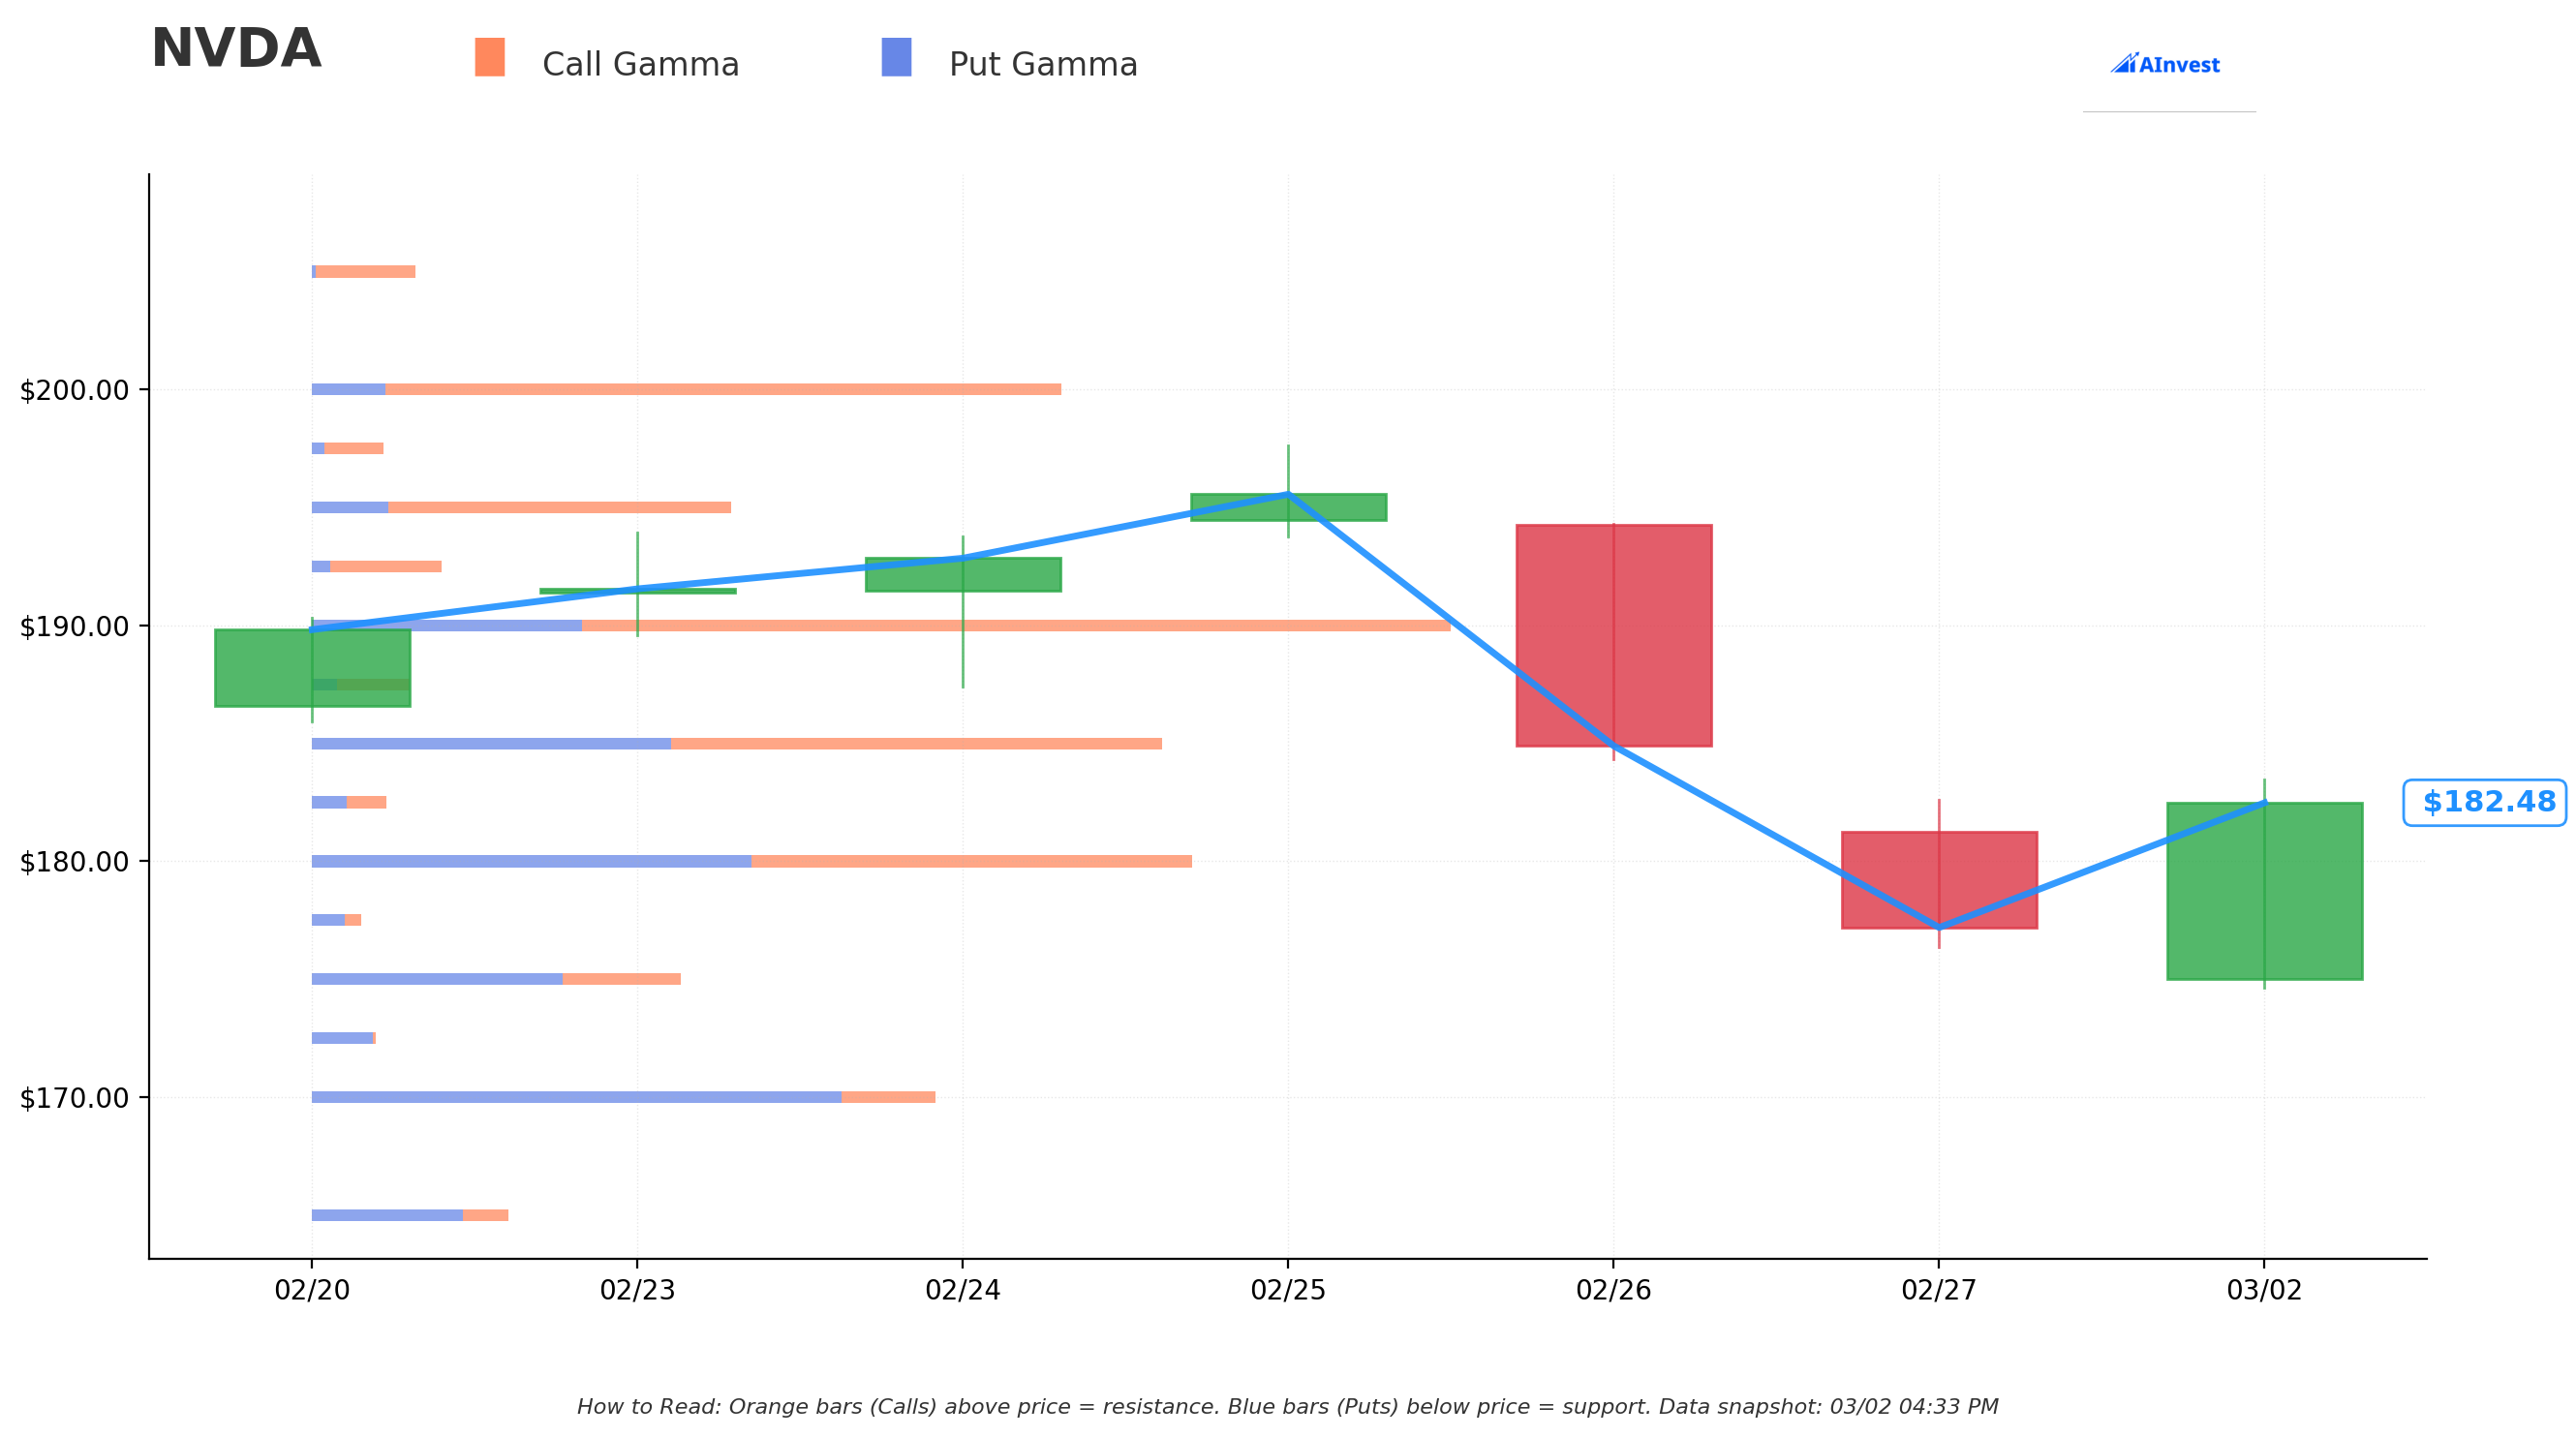
Current Price: $182.48
The gamma exposure chart reveals how options market makers are positioned, which creates natural magnets and barriers for the stock price:
🟠 Resistance Levels (Call Gamma Above Price):
- $185 - Nearby call gamma resistance from multiple expirations
- $190 - Significant call gamma wall, a key level to break through
- $195 - Heavy call gamma, strong resistance from pre-earnings positioning
- $200 - Major psychological and gamma resistance — a breakout above here would be significant
🔵 Support Levels (Put Gamma Below Price):
- $180 - Moderate put gamma providing nearby support
- $175 - Stronger put gamma floor from longer-dated contracts
- $170 - Major put gamma support level — this held after the earnings selloff
- $165 - Deep support with significant put open interest
What this means for traders: The gamma map shows NVDA is sitting right in the middle of a $175-$190 consolidation zone. Market makers are hedging around these levels, which tends to compress price action. A breakout above $190 — which could easily happen on a strong GTC keynote — would force dealers to chase the stock higher as they cover short gamma. On the downside, $175 and $170 represent firm put gamma floors that should catch any selling.
Implied Move Analysis
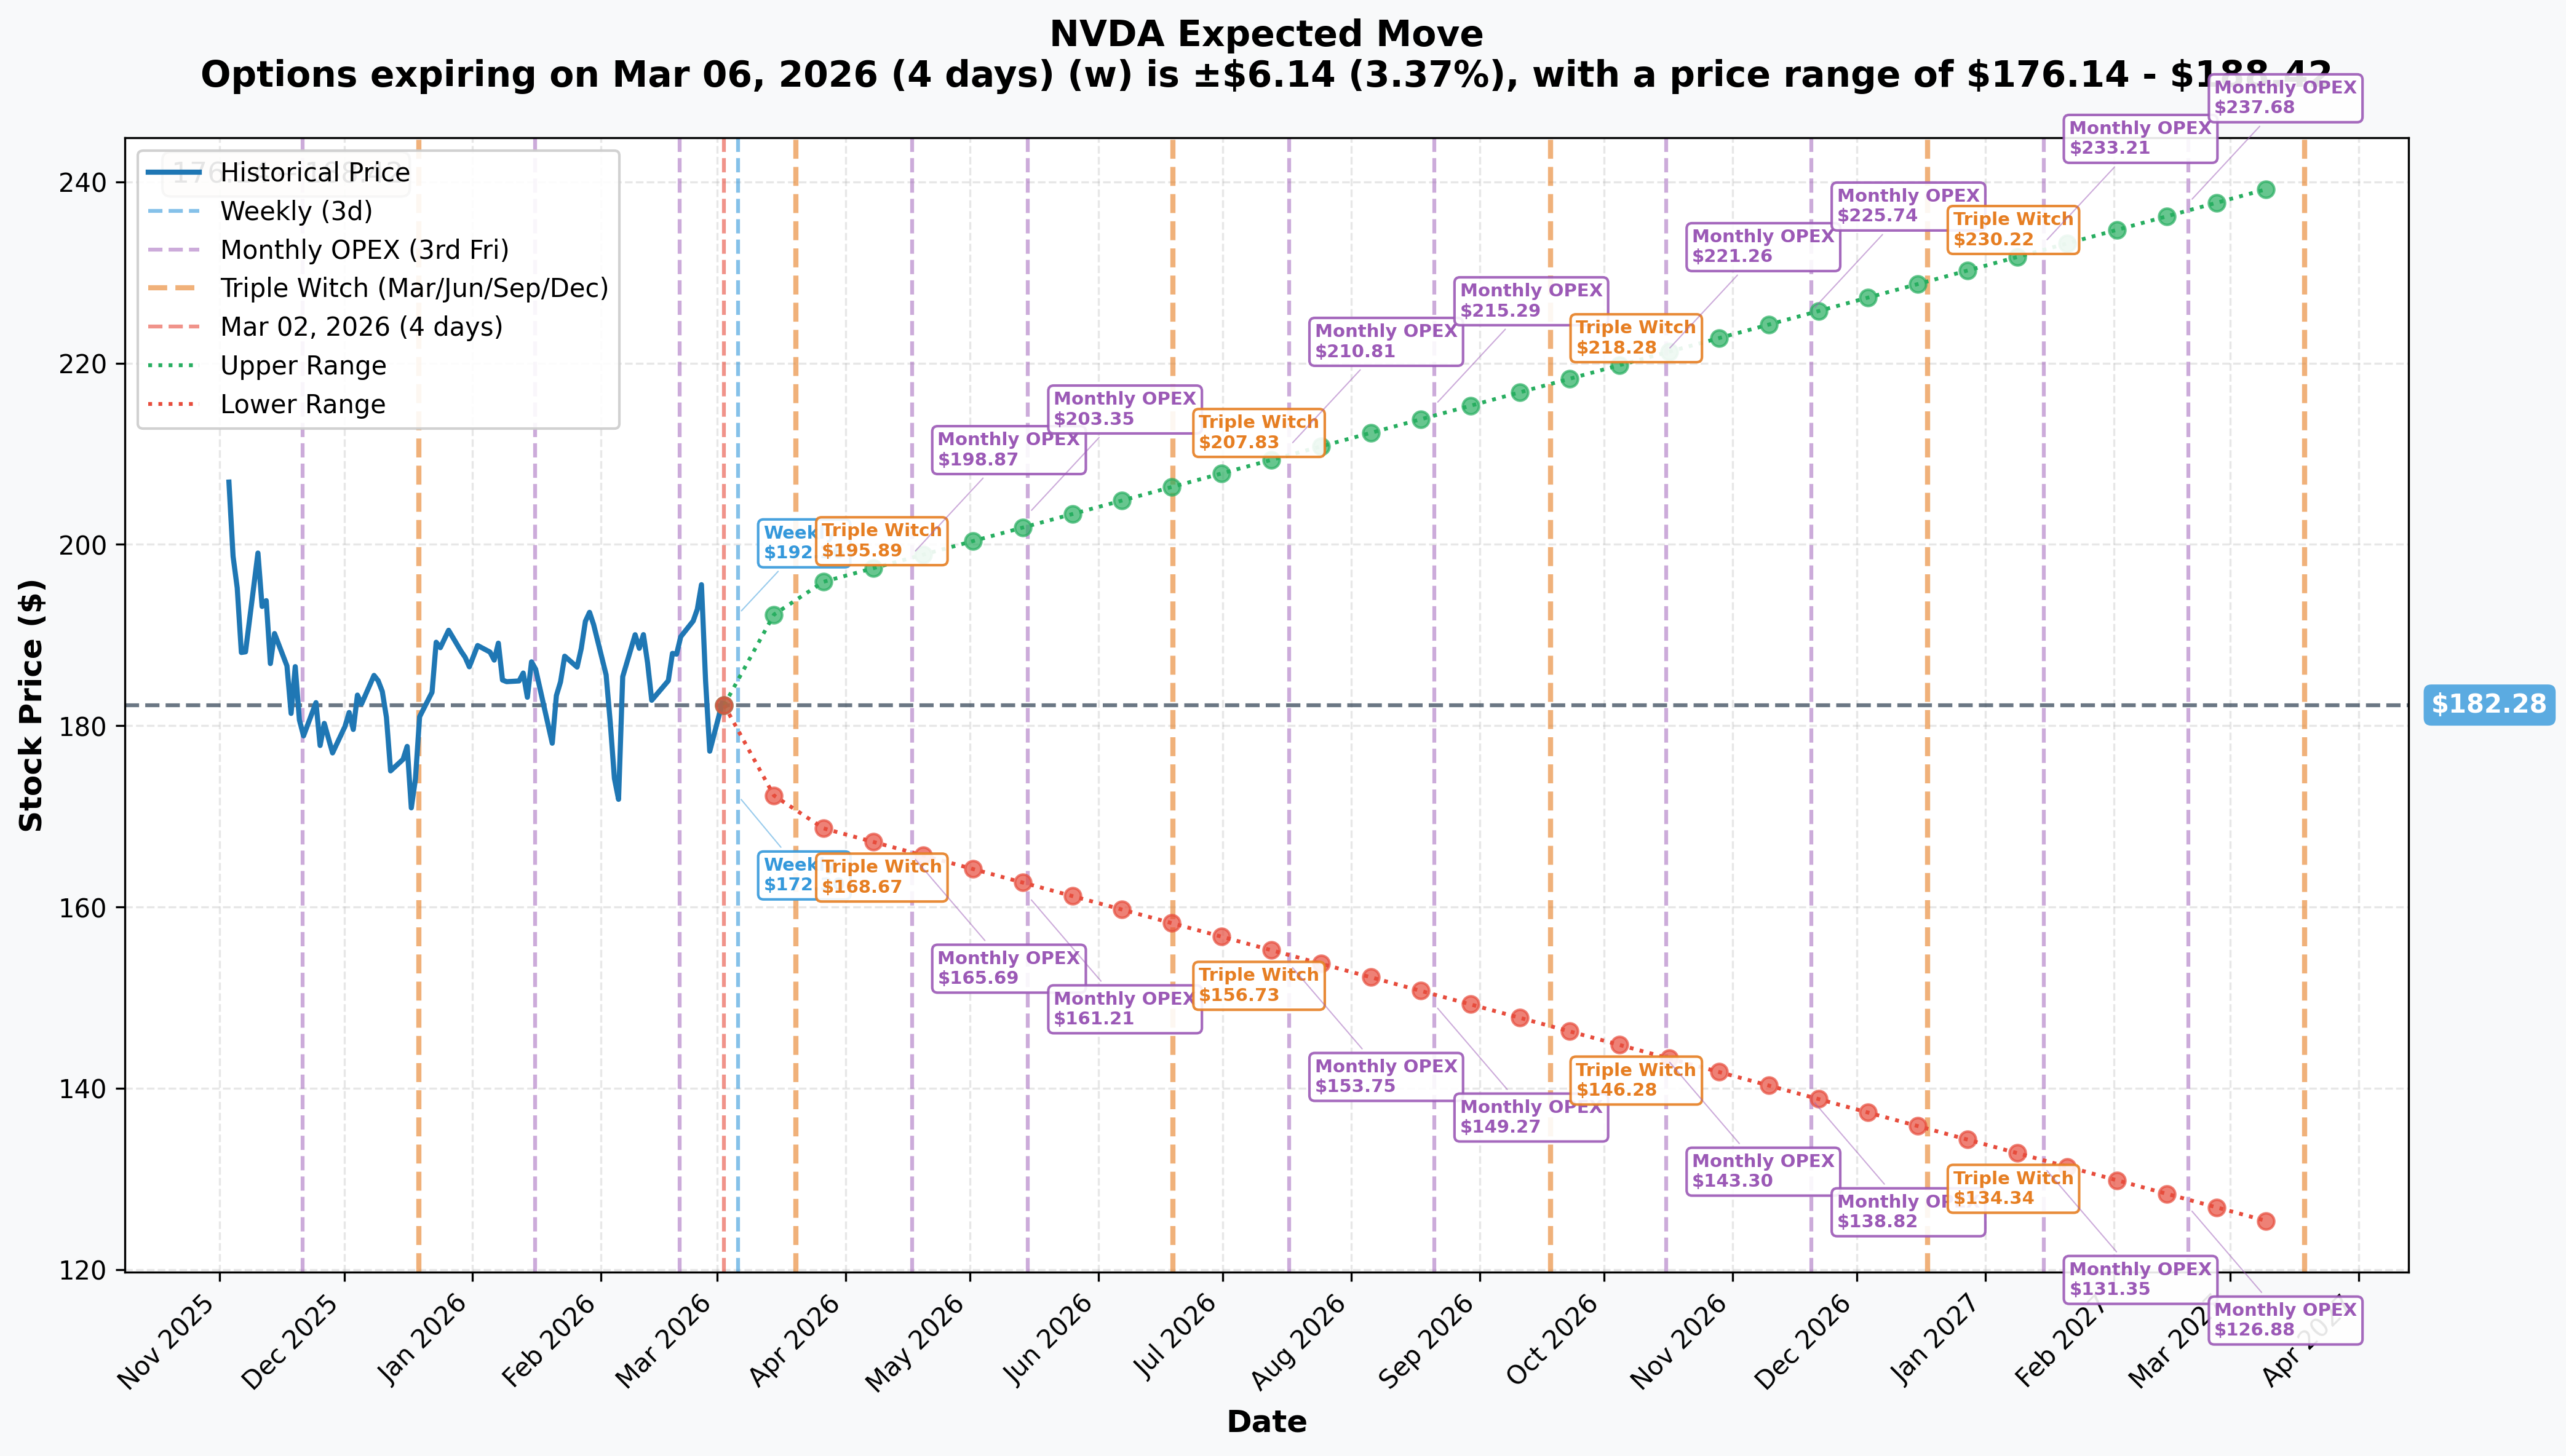
Options market pricing for upcoming expirations:
- 📅 Weekly (March 6 - 4 days): ±$6.14 (±3.37%) → Range: $176.14 - $188.42
- 📅 Monthly/Triple Witch OPEX (March 20 - 18 days): ±$12.86 (±7.05%) → Range: $169.42 - $195.14
- 📅 June Triple Witch (June 19 - trade expiration window): ±$25.55 (±14.0%) → Range: $156.73 - $207.83
- 📅 Yearly LEAPS (March 2027 - 382 days): ±$58.14 (±31.9%) → Range: $124.14 - $240.42
Translation for regular folks:
The options market is pricing in a 3.4% move this week and a 7% move through the March 20 triple witch — which notably includes the GTC conference window. That's a pretty wide expected range ($169-$195), reflecting the market's awareness that GTC can be a big mover.
For the June 18 expiration (when this $12M trade expires), the implied range stretches from $156.73 to $207.83. This means the $150 strike is well below even the bear case — the trader would only lose money if NVDA drops below $150 (a 17.6% decline), which is outside the market's expected range. The upper implied move suggests $207+ is achievable by June, which would make this trade worth $17.1M+ ($57 x 3,000 contracts) — a $5M+ profit.
🎪 Catalysts
🔥 Upcoming Catalysts
NVIDIA GTC 2026 — March 16-19 (14 DAYS AWAY!) 🤖
This is the big one. Jensen Huang's keynote is Monday, March 16 from 8-11 AM PDT, and he's promised to unveil "several new chips the world has never seen before".
Expected reveals include:
- 🧠 Feynman architecture: Next-generation beyond Rubin, built on TSMC's 1.6nm A16 node — this would be the first 1.6nm chip architecture ever publicly detailed
- 🔬 Rubin GPU specifications and deployment timeline: Volume production targeting H2 2026 with AWS, Google, Microsoft, and CoreWeave as launch partners
- 💾 HBM4 memory showcases from Samsung and SK Hynix for Rubin platform
- 🤖 Physical AI, robotics demonstrations, and agentic AI breakthroughs
Catalyst significance: GTC has historically been a major stock-moving event. The Feynman roadmap could reinforce NVIDIA's multi-year technology moat, while Rubin details provide near-term revenue visibility.
Q1 FY2027 Earnings — May 27, 2026 (After Close) 📊
- Revenue guidance already set at $78.0B (+/- 2%) — implying 77% YoY growth acceleration
- Key watch items: Rubin production ramp, Blackwell Ultra revenue mix, gross margins (~75%), and any change in China export stance
- This falls within the June 18 expiration window of today's trade
Rubin GPU Volume Shipments — H2 2026 🚀
Rubin entered full production in Q1 2026, nearly two quarters ahead of schedule. Volume shipments target H2 2026 with ~5x performance over Blackwell. Analysts project 5.7 million Rubin GPUs shipped in CY2026.
Hyperscaler Capex Cycle — Ongoing 💰
Big Five hyperscaler capex is projected at $600B+ in CY2026, up ~36% YoY, with ~75% tied to AI infrastructure. Meta, Microsoft, Amazon, and Google all guided record capex.
✅ Recent Catalysts (Already Happened)
Q4 FY2026 Earnings — February 25, 2026
Record quarter: $68.1B revenue (beat by $3B), $1.62 non-GAAP EPS (beat by $0.08). Data center hit $62.3B (+75% YoY). Networking surged to $10.98B (+263% YoY). Full-year FY2026: $215.9B revenue, $96.6B free cash flow. Despite the beat, stock fell 5.6% on February 26 on slowing sequential growth concerns.
Analyst Price Target Raises — Late February / Early March 2026
Multiple firms raised targets post-earnings: Bank of America, Citi, Baird, and Bernstein all to $300. J.P. Morgan raised to $265. Average 12-month consensus target: $263.39 — 44% upside from current levels.
Blackwell Ultra Momentum
Blackwell Ultra (GB300) now accounts for roughly two-thirds of Blackwell revenue, with shipments expected to rise 129% YoY in 2026. CFO Colette Kress cited $500B in combined Blackwell and Rubin revenue visibility through CY2026.
🎲 Price Targets & Probabilities
Using gamma levels, implied move data, the institutional call purchase, and upcoming catalysts:
📈 Bull Case (35% probability)
Target: $200-$220 by June 18 expiration
How we get there:
- 🤖 GTC keynote delivers on Feynman architecture hype, sparking a re-rating
- 📈 Stock breaks through $190-$195 gamma resistance, triggering dealer short covering
- 💪 Q1 earnings in May beat the already-strong $78B guidance
- 🌍 Sovereign AI momentum continues (tripled to $30B+ in FY2026)
- 📊 Consensus PT of $263 provides room for significant upside
- 💰 Trade P&L at $210: ($60 - $40) x 3,000 = +$6M profit (+50%)
This is what the $12M call buyer is betting on. The implied move data shows June upper range at $207.83, and multiple analysts have $300 targets. A strong GTC could easily push the stock back toward its $212 all-time high.
🎯 Base Case (45% probability)
Target: $180-$200 range through June
Most likely scenario:
- ✅ GTC delivers solid product updates but no massive surprise
- 📊 Stock grinds higher within the gamma consolidation zone ($175-$195)
- ⚖️ China export uncertainty continues to cap multiple expansion
- 🔄 Gradual re-rating as 22x forward P/E looks increasingly cheap vs. 77% growth
- 📈 Stock drifts toward $190-$195 by June as earnings approach
Trade P&L at $190: ($40 - $40) x 3,000 = breakeven to slightly positive (the $150 call at $190 spot would be worth ~$42-44 with time value)
📉 Bear Case (20% probability)
Target: $155-$175
What could go wrong:
- 😰 China export controls tighten further, impacting already-zero China revenue outlook
- 📉 Broader tech selloff or AI spending concerns drag mega-caps lower
- ⚖️ AMD MI400 launch in 2026 with claimed 10x performance improvement erodes market share narrative
- 🤖 DeepSeek efficiency paradigm raises concerns about future GPU demand
- 🛡️ Key floors: Put gamma support at $175 and $170 should limit downside
Trade P&L at $165: ($15 - $40) x 3,000 = -$7.5M loss (-62.5%). However, note the $150 strike provides a natural floor — the trader can only lose 100% of premium ($12M) and no more. Even in the bear case, NVDA would need to fall below $150 (a 17.6% drop) for the calls to expire worthless, which is outside the market's expected move range.
💡 Trading Ideas
🛡️ Conservative: Follow the Whale with a Call Spread
Play: Buy the June 18 $180/$200 call spread on NVDA
Structure:
Why this works:
- 🎯 Defined risk — you know your max loss upfront (debit paid)
- 📈 Captures upside through both GTC (March 16-19) and Q1 earnings (May 27)
- 🐋 Aligned with the institutional trader's bullish thesis
- 💸 Much cheaper than buying the stock or deep ITM calls
- 📊 $200 upper strike aligns with gamma resistance and implied upper range (~$207)
Estimated P&L:
- 💰 Cost: ~$8-10 per spread ($800-$1,000 per contract)
- 📈 Max profit: ~$12-10 per spread at $200+ ($1,200-$1,000 per contract)
- 📉 Max loss: Premium paid (defined)
- 🎯 Breakeven: ~$188-$190
Risk level: Moderate (defined risk) | Skill level: Intermediate
⚖️ Balanced: Pre-GTC Call Purchase with Defined Timeframe
Play: Buy slightly OTM calls targeting the GTC catalyst window
Structure: Buy NVDA March 28 $190 Call
Why this works:
- 🤖 GTC keynote March 16 is the primary catalyst — stock could gap through $190 resistance
- ⏰ Short-dated (26 days) keeps premium affordable
- 📊 $190 strike sits right at key gamma resistance — a breakout above this level would accelerate
- 🔄 IV crush risk is lower for an event like GTC (not a binary earnings miss/beat)
- 📈 If Feynman architecture details impress, $195-$200 is easily achievable in the following sessions
Estimated P&L:
- 💰 Cost: ~$5-7 per contract ($500-$700)
- 📈 At $195 by March 20: ~$5 intrinsic = roughly breakeven to +40%
- 📈 At $200 by March 20: ~$10 intrinsic = roughly +50-100%
- 📉 Max loss: Premium paid if NVDA stays below $190
Risk level: Moderate | Skill level: Intermediate
🚀 Aggressive: Stock Replacement (Mirror the Whale)
Play: Buy deep ITM calls similar to the institutional trade
Structure: Buy NVDA Jun 18 $160 Call (deep ITM, ~0.80+ delta)
Why this works:
- 🐋 Mirrors what the institutional trader did — leveraged exposure to NVDA upside
- 💪 Deep ITM call with high delta moves nearly dollar-for-dollar with stock
- ⏰ 108 days captures both GTC AND May 27 earnings — two major catalysts
- 📊 At ~$28-30 per contract, you get ~$22+ of intrinsic value, paying ~$6-8 in time value
- 🔄 3x leverage: 1 contract (~$3,000) controls $18,200 worth of NVDA stock
Estimated P&L (per contract):
- 💰 Cost: ~$28-30 ($2,800-$3,000 per contract)
- 📈 At $200 by June: ~$40 value = +33-43% return
- 📈 At $210 by June: ~$50 value = +67-79% return
- 📉 At $170: ~$12-14 value = -50-57% loss
- 📉 Max loss: Full premium if NVDA falls below $160 at expiry (unlikely based on implied move data)
Why this could blow up (SERIOUS RISKS):
- 💥 NVDA could have further downside if GTC disappoints or macro deteriorates
- 📉 The post-earnings selloff pattern could repeat — good numbers, bad stock reaction
- 🇨🇳 China export control escalation is a binary risk that could gap the stock down significantly
- ⏰ Time decay works against you every day — 108 days is a lot of theta to bleed
Risk level: HIGH | Skill level: Advanced
⚠️ Risk Factors
Don't ignore these potential landmines:
-
📉 Post-earnings "sell the news" pattern: NVDA just dropped 5.6% after a record quarter. The stock has shown a pattern of selling off on great results. Even Morgan Stanley's analyst was "surprised" by the muted reaction. GTC could get the same treatment if the market decides the news is "priced in."
-
🇨🇳 China export controls remain a $50B overhang: NVIDIA has yet to generate any revenue from approved H200 shipments to China, and Q1 guidance excludes all China data center compute revenue. Any further tightening — especially with the DeepSeek-Blackwell controversy intensifying Washington scrutiny — could weigh on the stock.
-
🏭 Rubin production ramp risk: While Rubin is ahead of schedule, any yield issues with TSMC 3nm + HBM4 could delay volume shipments and create a revenue gap during the Blackwell-to-Rubin transition.
-
⚔️ Competition is heating up: AMD's MI400 series launching in 2026 claiming 10x improvement, Google TPUs are reportedly in advanced talks with Meta, and hyperscalers are building custom silicon. NVIDIA's 85-92% market share is the number to watch.
-
📊 Decelerating sequential growth: Q4 revenue was up 20% QoQ vs. higher sequential rates earlier in FY2026. Investors are watching whether the growth rate is plateauing, even as absolute numbers remain massive.
-
💰 Concentration risk: Over 91% of revenue comes from Data Center, with ~50% from a handful of hyperscalers. Any pullback in AI capex spending — even a slowdown in growth rate — disproportionately impacts NVIDIA.
-
🤖 DeepSeek efficiency paradigm: The idea that algorithmic efficiency can reduce hardware requirements could slow GPU demand growth over time. While the market largely shrugged this off, it remains a longer-term structural concern.
-
📉 ATH is still 14% above current price: NVDA peaked at $212.19 in October 2025 and has been making lower highs. The recent selloff to $177 post-earnings shows sellers are active. The stock needs to clear $190 and then $200 before bulls can feel comfortable.
🎯 The Bottom Line
Here's the deal: An institutional player just deployed $12M into deep ITM NVIDIA calls on the ASK — the most aggressive way to buy options — giving themselves leveraged exposure to 300,000 shares ($54.6M notional) through both GTC and Q1 earnings. At a 155.82 z-score, this trade is extremely unusual — this kind of size and urgency shows up only a handful of times per quarter.
What this trade tells us:
- 🐋 Big money is positioning for upside ahead of GTC, not waiting for the event
- 💪 The $150 deep ITM strike says this is stock replacement, not a speculative lottery ticket
- ⏰ June 18 expiration captures both GTC (March 16-19) AND Q1 earnings (May 27)
- 🔥 Buying on the ASK at 1:52 PM means they wanted this position NOW, not at a better price tomorrow
- 📊 At 22x forward P/E with 77% guided growth, NVDA is genuinely cheap by its own historical standards
If you're bullish on NVDA:
- ✅ GTC on March 16-19 is the next big catalyst — mark your calendar
- 🎯 Watch $190 as the key gamma resistance level to break through
- 📈 Consensus 12-month target of $263 implies 44% upside from here
- 💡 Consider call spreads or shorter-dated calls to manage risk while capturing GTC upside
- 🛡️ Use $175 as your mental floor — strong put gamma support there
If you're watching from the sidelines:
- ⏰ Wait for GTC week (March 16-19) to see if the product reveals justify new positioning
- 🎯 A pullback to $175 or below would be a strong entry point with gamma support as a floor
- 📊 The compressed 22x forward P/E vs. 64x historical average tells you the market is pricing in risks
- 📈 Longer-term, Rubin volume in H2 2026 and $600B+ hyperscaler capex provide structural tailwinds
If you're bearish:
- ⚠️ Fighting this trade is dangerous — institutional money is positioned for upside
- 📊 The $170 and $175 put gamma walls need to break before bears gain control
- 🇨🇳 China export policy is the primary bear catalyst — watch Washington headlines
- 📉 If you must short, wait until after GTC in case announcements trigger a squeeze above $195
Mark your calendar — Key dates:
- 📅 March 6 — Weekly options expiration, expected move ±$6.14 ($176-$188)
- 📅 March 16-19 — NVIDIA GTC 2026 (Jensen Huang keynote March 16, 8-11 AM PDT)
- 📅 March 20 — Triple Witch OPEX, expected move ±$12.86 ($169-$195)
- 📅 May 27 — Q1 FY2027 Earnings (After Close), guided $78B revenue
- 📅 June 18 — This $12M call trade's expiration date (Triple Witch)
- 📅 H2 2026 — Rubin GPU volume shipments begin
Final verdict: This $12M deep ITM call buy is a high-conviction institutional bet that NVDA re-rates higher over the next 3.5 months. At 22x forward earnings with 77% revenue growth, a major product conference in 2 weeks, and $500B in combined Blackwell/Rubin revenue visibility, the fundamental case is strong. The compressed valuation after the post-earnings selloff has created exactly the kind of dislocation that institutions love to exploit. The whale is betting this "coiled spring" finally unwinds — and with $12M on the line, they're putting serious money behind that view.
Disclaimer: Options trading involves substantial risk of loss and is not suitable for all investors. This analysis is for educational purposes only and not financial advice. Past performance doesn't guarantee future results. The 155.82 z-score reflects this specific trade's unusualness relative to recent historical activity — it does not imply the trade will be profitable or that you should follow it. Deep ITM calls carry significant capital risk despite their conservative moneyness. Always do your own research and consider consulting a licensed financial advisor before trading.
About NVIDIA Corporation: NVIDIA is the world's leading designer of AI computing chips, with a $4.5 trillion market cap and 85-92% share of the AI accelerator market. Its GPUs power the data centers of every major cloud provider, and it dominates the semiconductor industry's most important growth segment.