🚀 ORCL Massive Bull Call Spread - $9.1M Recovery Play After Historic Crash!
📅 December 11, 2025 | 🔥 EXTREMELY UNUSUAL Activity Detected
🎯 The Quick Take
Someone just placed a $9.1M bet on Oracle's recovery after its worst single-day crash since 2001! This sophisticated institutional trader bought 21,000 March 2026 $250 calls while selling 22,000 March 2026 $300 calls - a classic bull call spread betting on a 26% recovery from yesterday's bloodbath. With ORCL down 15.6% on December 11 (erasing $105 billion in market cap), this contrarian play is positioning for a bounce back toward all-time highs. Translation: Smart money thinks the selloff was overdone and ORCL is heading to $250+ by March!
The Z-scores on these trades are off the charts - 100.86 and 55.22 - meaning this type of activity virtually never happens. This isn't just unusual, it's a statement trade that screams institutional conviction.
📊 Company Overview
Oracle Corporation (ORCL) is a global leader in cloud infrastructure and enterprise software:
- Market Cap: $548.83 billion (after $105B wipeout)
- Industry: Enterprise Software & Cloud Infrastructure
- Key Products: Oracle Cloud Infrastructure (OCI), Oracle Database, Enterprise Applications
- Current Price: $192.53 (down from $346 September peak - off 44% from highs!)
- 52-Week Range: $118.86 - $345.72
- Major Catalysts: $523 billion AI backlog (up 438% YoY), $300 billion OpenAI contract, 68% cloud infrastructure growth
What Just Happened? Oracle reported Q2 FY2026 earnings on December 10, missing revenue by just $150M ($16.06B vs. $16.21B expected) but beating EPS by 37.8%. The real shock: Oracle raised capex guidance by $15B to $50B for FY2026, triggering its worst single-day drop in 24 years. The stock plunged 15.6%, with analysts downgrading across the board.
💰 The Option Flow Breakdown
📊 What Just Happened
The Tape (December 11, 2025):
| Time | Symbol | Side | Buy/Sell | Type | Expiration | Premium | Strike | Volume | Z-Score | Classification |
|---|---|---|---|---|---|---|---|---|---|---|
| TBD | ORCL $250 CALL | MULTI | BUY | CALL | 2026-03-20 | $9.1M | $250 | 21,000 | 100.86 | EXTREMELY_UNUSUAL |
| TBD | ORCL $300 CALL | MULTI | SELL | CALL | 2026-03-20 | $3.2M | $300 | 22,000 | 55.22 | EXTREMELY_UNUSUAL |
Option Symbols:
- Long Call: ORCL20260320C250
- Short Call: ORCL20260320C300
Net Debit: ~$5.9M total invested ($9.1M - $3.2M = ~$5.9M)
🤓 What This Actually Means
This is a bull call spread - the ultimate "I think you overreacted" trade! The trader:
- ✅ Pays $9.1M to buy $250 calls (betting on recovery)
- ✅ Collects $3.2M by selling $300 calls (capping upside, reducing cost)
- ✅ Maximum profit: ~$44.1M if ORCL hits $300+ ([50-point spread - net debit] × 21,000 contracts)
- ✅ Maximum loss: $5.9M (the net debit paid - only if ORCL stays below $250)
- ✅ Breakeven: ~$228 ($250 strike + net debit per contract)
- ✅ Days to expiration: 99 days (expires March 20, 2026)
Unusual Score: 🚨 EXTREMELY UNUSUAL - Z-scores of 100.86 and 55.22!
Let me explain what these insane Z-scores mean: A Z-score measures how many standard deviations an event is from the norm. A Z-score above 3 is rare (99.7th percentile). A Z-score above 6 is essentially "this never happens." We're seeing Z-scores of 100.86 and 55.22 - this is statistical black swan territory.
Why this matters: This isn't your typical options flow. Someone with serious capital and conviction just made a massive, calculated bet that Oracle's 15.6% crash was an overreaction. The size, timing (right after the worst drop in 24 years), and extreme statistical rarity suggest this is institutional money with deep pockets stepping in to catch the knife.
Risk/Reward Profile: Spending $5.9M to potentially make $44.1M is a 7.5x return if Oracle recovers to $300. That's a 55% gain from current levels - aggressive but not impossible given Oracle's historical volatility and the $523B AI backlog.
📈 Technical Setup / Chart Analysis
YTD Performance Chart
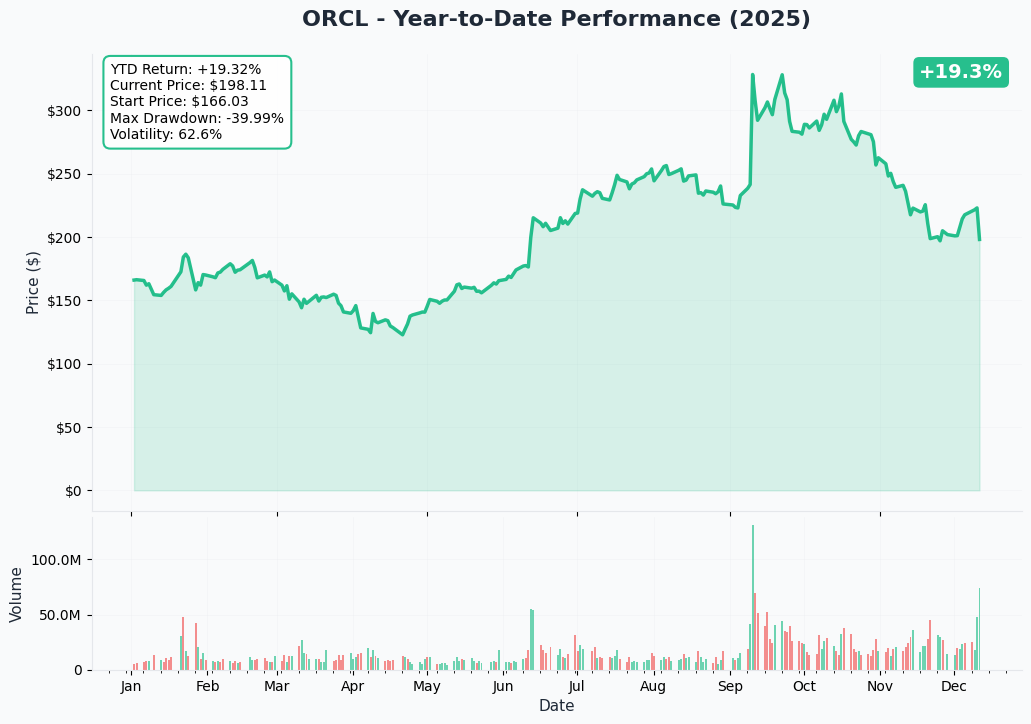
Oracle is down 32% from its September 2025 peak of approximately $346, with yesterday's 15.6% crash being the cherry on top of a brutal quarter. The stock started 2025 strong, rallied into September, then began a steady decline before yesterday's cliff-dive.
Key observations:
- Massive gap down: December 11 opened with a violent gap lower - classic capitulation move
- Volume spike: 54.75M shares traded vs. 23.04M average (138% above normal) - panic selling
- Support zone: Currently testing psychological $190-200 level
- Previous highs: $346 in September, now major resistance at $220-230
- RSI likely oversold: After a 15.6% single-day drop, technical indicators should be flashing extreme oversold
The chart shows clear capitulation. This is the kind of washout that often marks intermediate bottoms - exactly when contrarian traders step in.
Gamma-Based Support & Resistance Analysis
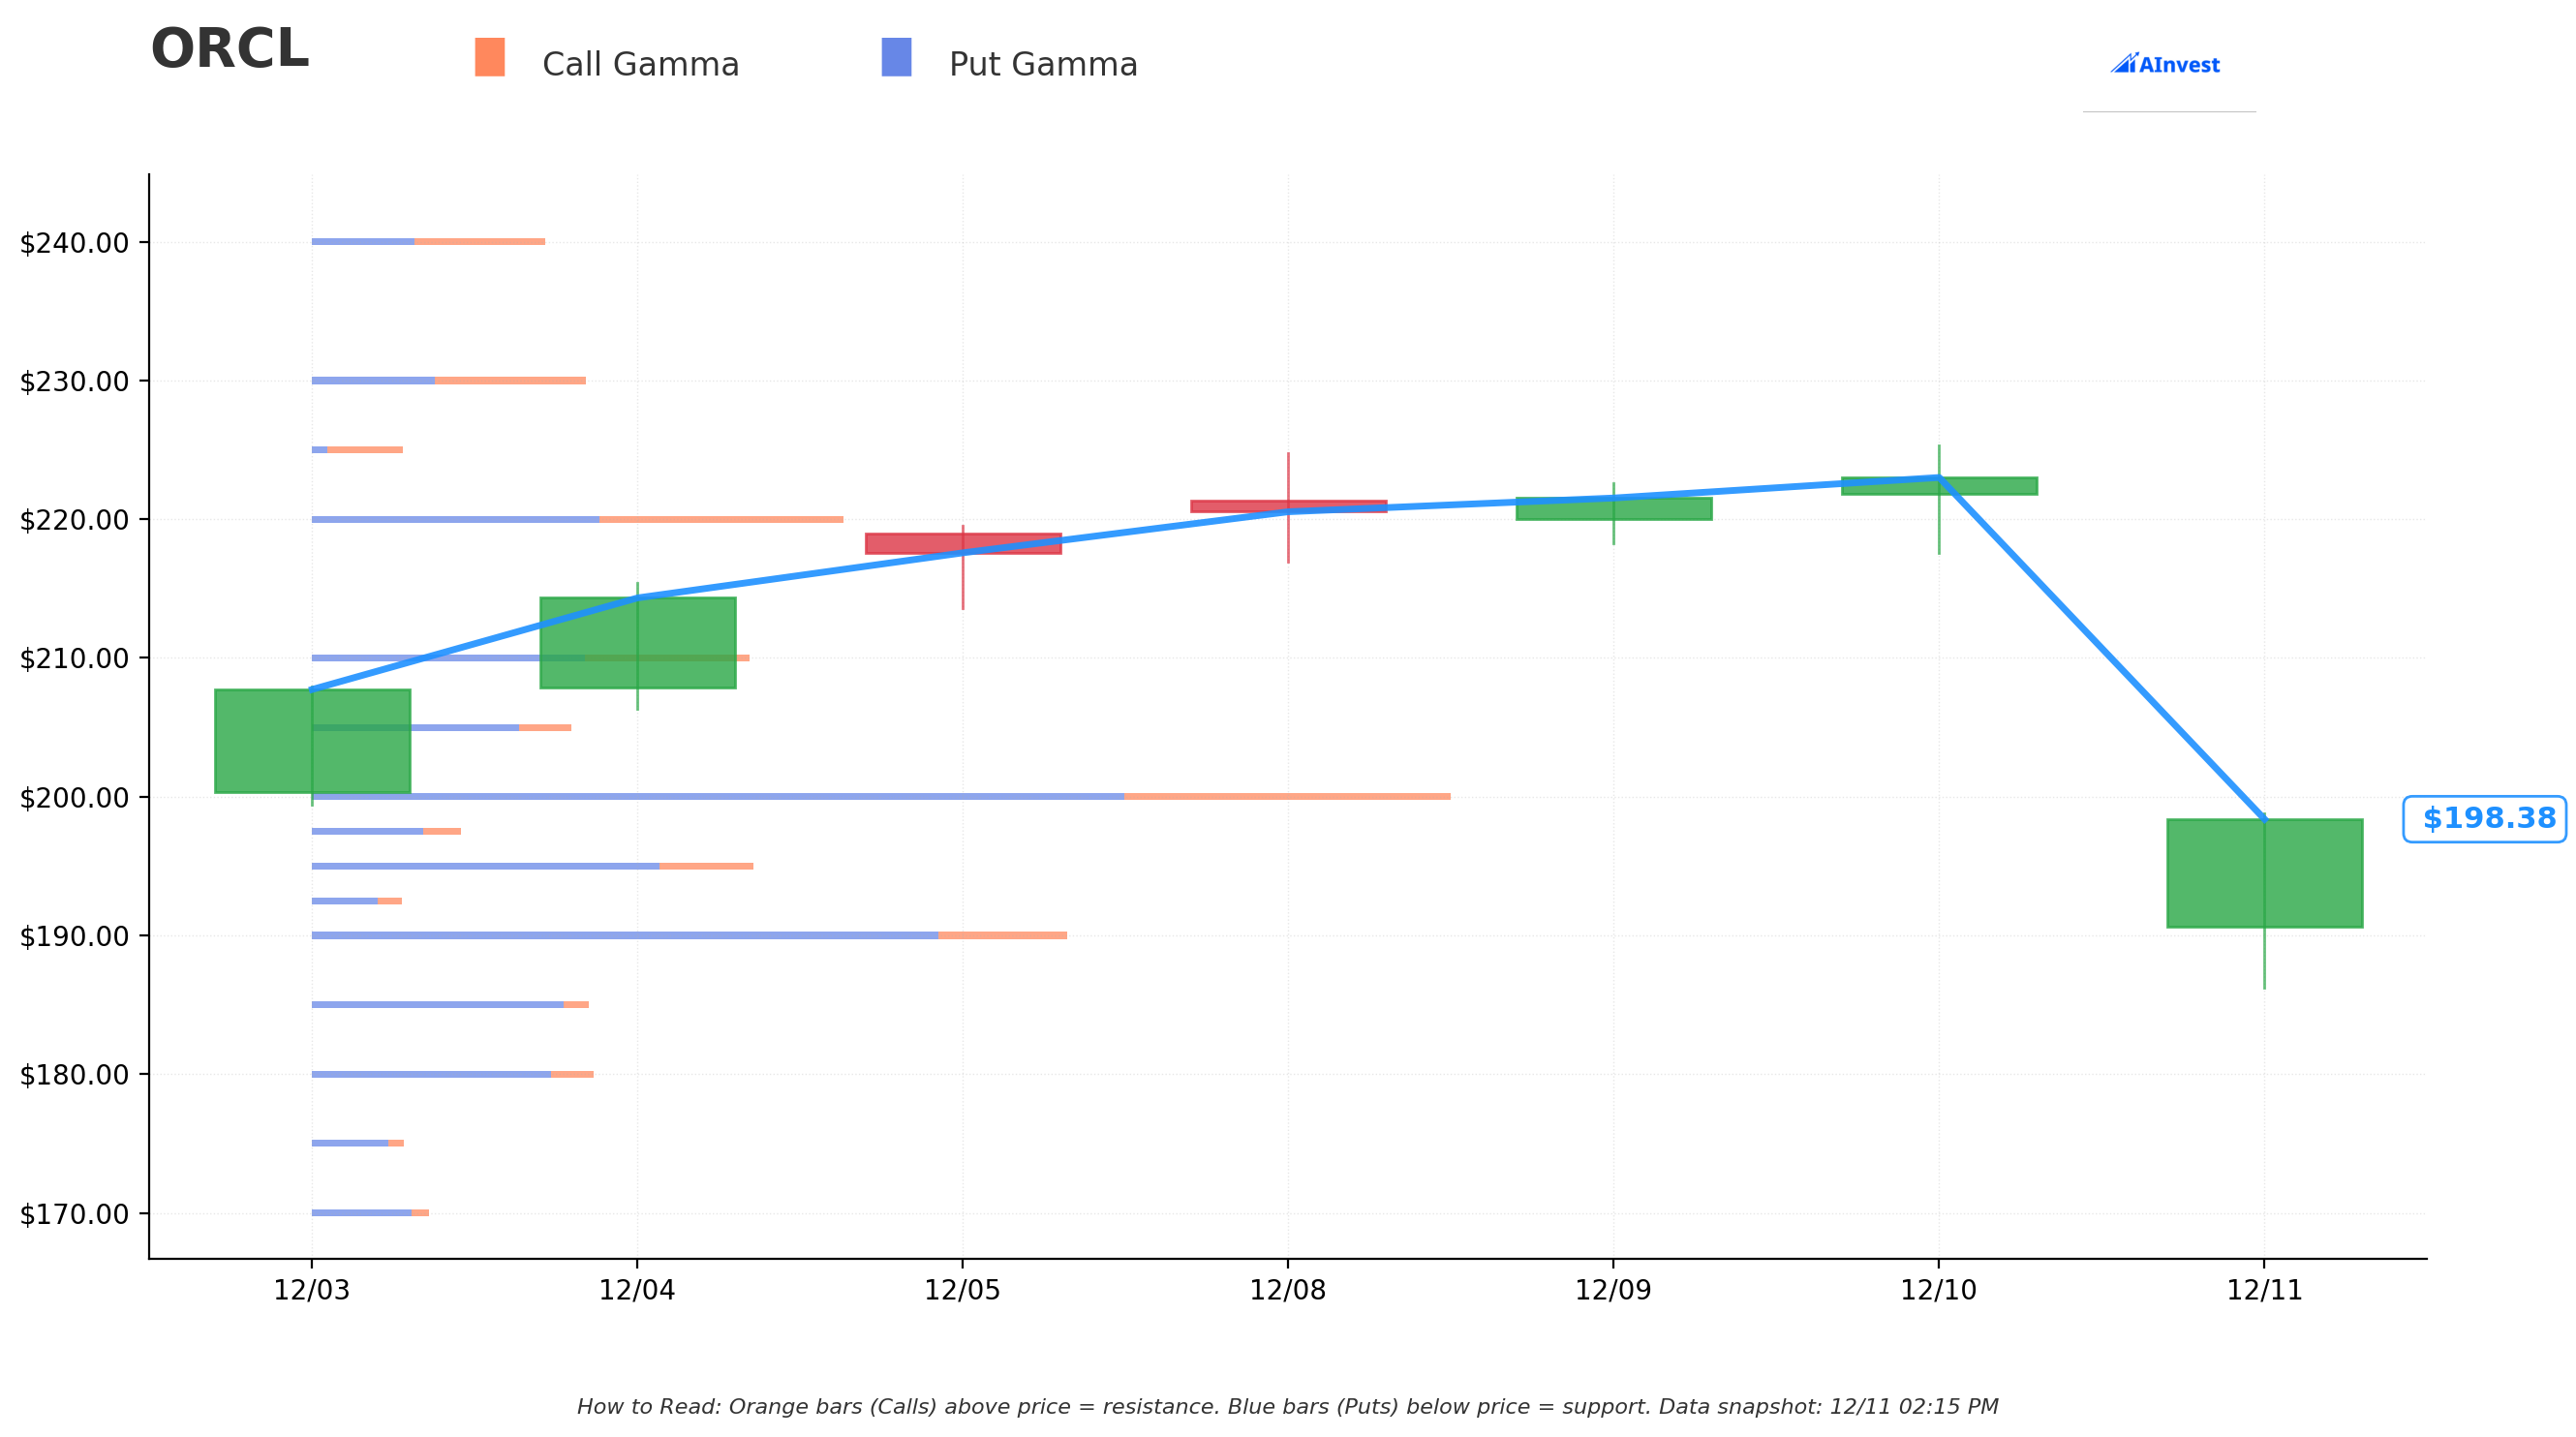
Current Price: $198.98
The gamma chart reveals critical battlegrounds for this trade:
🔵 Support Levels (Put Gamma):
- $197.50: Strongest immediate support with 5.33M GEX - this is the "hold the line" level
- $195.00: Secondary support at 15.70M GEX
- $190.00: Major support at 26.79M GEX - if this breaks, things get uglier
- $185.00: Support at 9.89M GEX
- $180.00: Support at 10.16M GEX - would represent another 8% drop
🟠 Resistance Levels (Call Gamma):
- $200.00: Massive resistance wall at 41.87M GEX - psychological round number
- $205.00: Resistance at 9.70M GEX
- $210.00: Resistance at 16.36M GEX
- $220.00: Strong resistance at 19.92M GEX
- $230.00: Resistance at 10.20M GEX
Net GEX Bias: Bearish (Call GEX: 90.26M, Put GEX: 161.58M)
What this means for the trade: The gamma profile shows dealers are long puts and short calls - creating natural resistance on any rally attempt. The massive call wall at $200 explains why we're seeing price struggle here. However, if the stock can break through $200-205, there's a cleaner path to $220-230. The real battle is just getting off the mat from $198 to $210 - after that, momentum could accelerate toward the $250 strike.
The bearish gamma bias is actually bullish for this trade setup - it means when positive catalysts hit (like Q3 earnings beat in March), dealers will need to buy stock to hedge their short call positions, creating positive gamma squeeze potential.
Implied Move Analysis
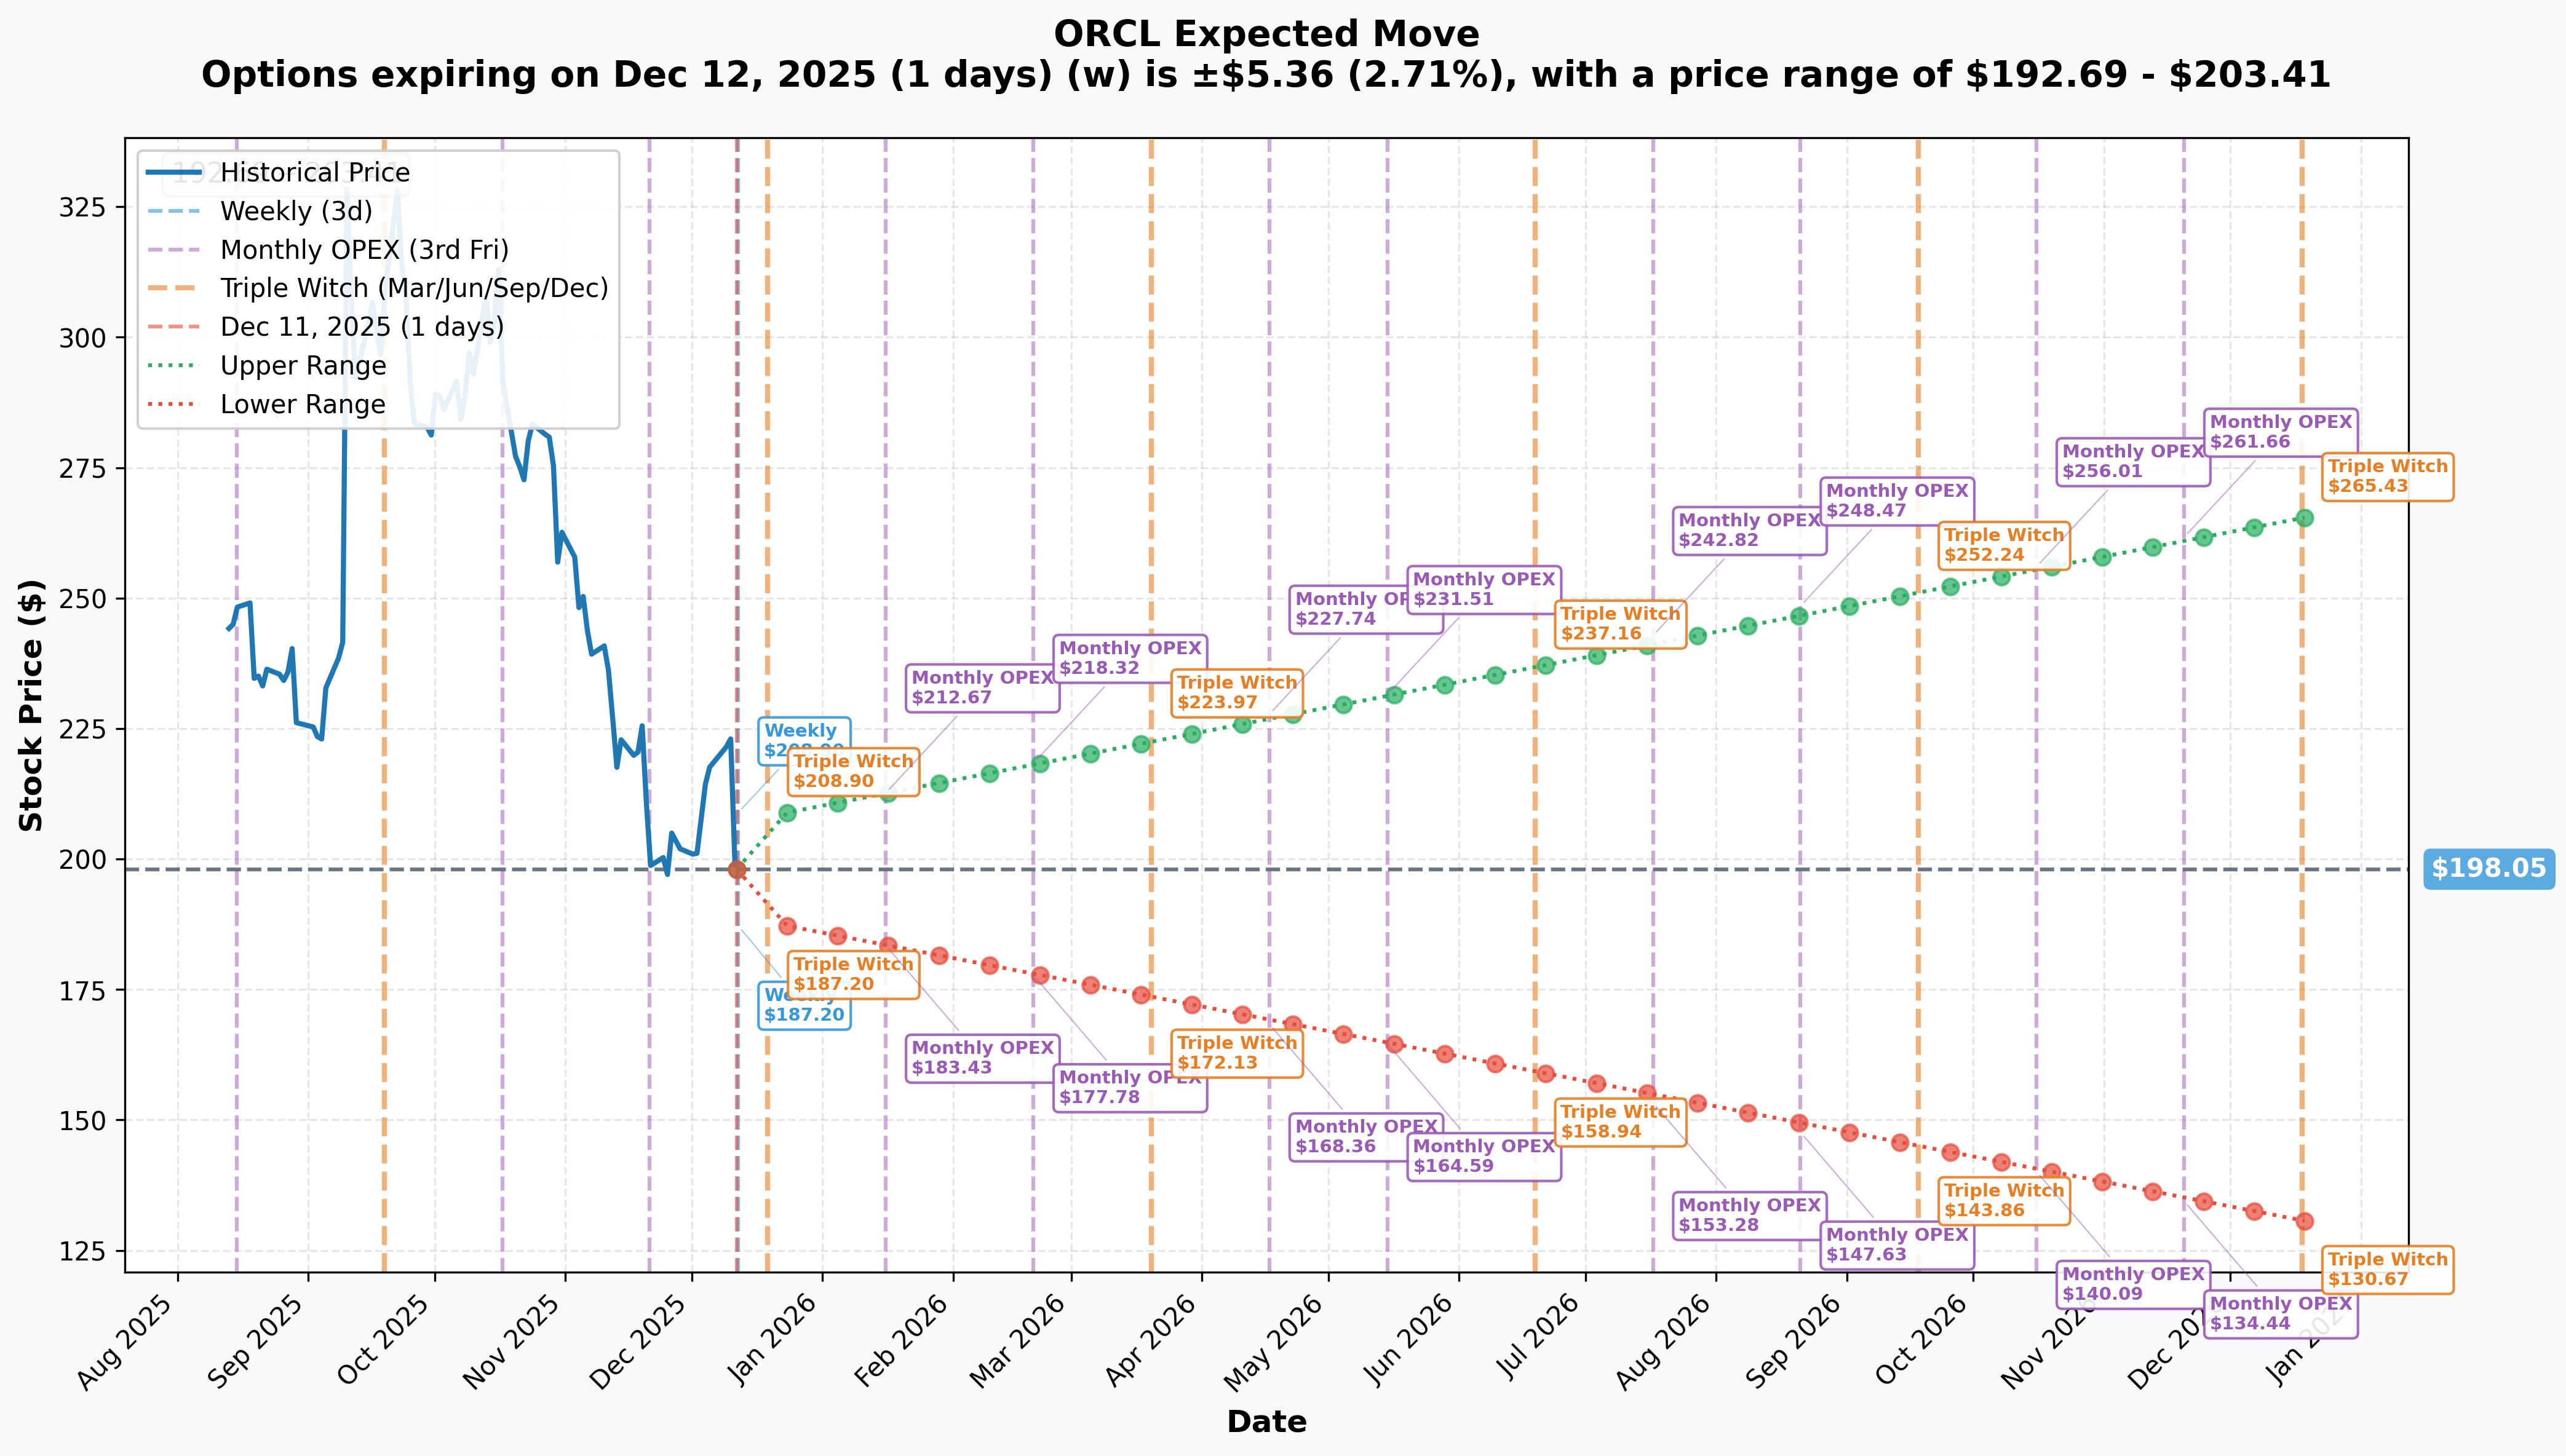
Implied Volatility Expectations:
- Weekly (Dec 12): 2.71% move ($192.69-$203.41)
- Monthly OPEX (Dec 19): 5.16% move ($187.83-$208.27)
- LEAPS (Dec 2026): 34.02% move ($130.67-$265.43)
What this tells us: The options market is pricing in a potential 34% move in either direction over the next year. Interestingly, the upper bound of the LEAPS implied move is $265.43 - well above the $250 strike but below the $300 short call. This suggests the market sees $250-265 as plausible but $300+ as requiring everything to go right.
The near-term weekly implied move of 2.71% suggests volatility will remain elevated through December opex. This is typical after major earnings shocks - the market needs time to digest and re-price.
🎪 Catalysts
Why Did Oracle Crash? (December 10-11, 2025)
The selloff was triggered by a perfect storm of concerns:
-
Revenue Miss: Oracle missed Q2 revenue by $150M ($16.06B vs. $16.21B consensus) - not huge, but enough to spook investors
-
CapEx Shock: Oracle raised FY2026 capex guidance by $15B to $50B - up 136% from FY2025's $21.2B. Wall Street freaked out about profitability and debt
-
Free Cash Flow Bloodbath: Q2 FCF came in at -$13.18B vs. -$5.2B expected. That's an $8 billion miss on FCF!
-
Debt Concerns: Oracle is pursuing $38B in additional debt on top of existing $104B, bringing total debt to ~$142B. Analysts warned Oracle's credit profile is "teetering just above junk"
-
AI Trade Fatigue: The selloff triggered "AI trade fatigue" across the sector - Nvidia, Micron, CoreWeave all dropped
-
Analyst Downgrades: Wave of downgrades on December 11:
The Contrarian Case: Here's the thing - Oracle beat EPS by 37.8%, grew cloud infrastructure revenue 68% YoY, and reported a $523B AI backlog (up 438% YoY). The capex increase? It's to build data centers for the $300B OpenAI contract. Sometimes you have to spend money to make money.
Upcoming Catalysts (Next 6 Months)
Q3 FY2026 Earnings - March 16, 2026 🎯 HIGH IMPACT
Confirmed date: March 16, 2026 after market close - just 4 days before this spread expires!
Consensus Estimates:
- Revenue: $16.87B
- Cloud Revenue Growth: 37-41% YoY (management guidance)
- Total Revenue Growth: 16-18% YoY (management guidance)
- Non-GAAP EPS Growth: 12-14% YoY (management guidance)
Why this matters for the trade: This bull call spread expires March 20, 2026 - perfectly timed for Q3 earnings on March 16. If Oracle delivers a beat (which they're capable of - they beat EPS by 38% in Q2!), the stock could gap up significantly. This trade is essentially a leveraged bet on Q3 earnings redemption.
Key metrics to watch:
- Cloud Infrastructure (OCI) revenue growth - needs to maintain 65%+ to justify the capex
- Free cash flow improvement vs. Q2's disaster
- Updates on OpenAI/Meta contract deployments
- Any revision to the $50B capex number (lower would be bullish)
Database 23ai On-Premise GA - 2026 TBD 📊 MODERATE POSITIVE
Oracle Database 23ai on-prem availability remains limited to specific configurations. General on-prem release timeline is "TBD" but expected by Q2 2026.
Revenue opportunity: $2-4B annualized if 20-30% of existing on-prem customers upgrade Probability: 60-70% chance of GA by June 2026
Debt Financing Closure - Q3-Q4 FY2026 ⚠️ MODERATE RISK
Oracle is pursuing ~$38B in additional debt financing on top of $104B existing debt. CFO committed to maintaining investment-grade rating.
Impact: Successful financing = neutral-to-positive. Failed financing or downgrade = -10% to -15% stock drop. Timeline: Expected Q3-Q4 FY2026 (January-May 2026) - overlaps with this trade's timeline
Oracle AI World 2026 Tour 🌍 MINOR POSITIVE
Oracle AI World Tour 2026 traveling globally with events showcasing AI/cloud breakthroughs.
Expected announcements:
- Database 26ai features
- New multi-cloud partnerships
- Customer adoption case studies
- Timeline: Q1-Q2 2026
- Historical impact: 1-3% stock moves on major product announcements
The Bull Case (Why This Trade Could Work)
1. Oversold Technical Setup After a 15.6% single-day crash and 32% decline from September highs, Oracle is technically oversold. The capitulation volume (138% above average) suggests panic selling has flushed out weak hands.
2. Institutional Support Average analyst price target is $334.52 - 74% upside from current $192.53. 40 Buy ratings, 18 Hold, 0 Sells. Even after downgrades, most price targets are $250-350.
Bernstein maintained Outperform with $339 target on December 11, praising Oracle's expanding AI footprint. Barclays maintained Overweight. TD Cowen views selloff as overdone.
3. AI Infrastructure Demand is Real $523B backlog (up 438% YoY) isn't fake - it's driven by $300B OpenAI contract plus commitments from Meta, Nvidia, and others.
Cloud infrastructure revenue grew 68% YoY - vastly exceeding AWS (17%), Azure (26%), and Google Cloud (32%).
4. Government Contracts Ramping GSA OneGov partnership provides 75% discount on Oracle tech and $0.33 in rewards for every $1 spent. Oracle has Top-Secret security clearances giving it a moat in government cloud.
5. Q3 Earnings Timing March 16 earnings, March 20 expiration. If Oracle delivers any kind of beat or raises guidance, this trade prints. Management knows they disappointed in Q2 - expect them to kitchen-sink any bad news now and set up for a Q3 beat.
6. Mean Reversion Oracle's average analyst target is $334.52. Even the lowered targets (Stifel $275, RBC $250, Scotiabank $260) are above the $250 strike. For this trade to lose, Oracle needs to stay below $228 breakeven through March - that requires sustained pessimism for 3 months.
⚠️ Risk Factors (Why This Trade Could Fail)
1. Free Cash Flow Remains Negative Q2 FCF was -$13.18B, and management indicated FCF will remain negative through FY2026. If Q3 FCF disappoints again, the stock could revisit $170-180.
2. Credit Rating Downgrade Oracle's credit profile is "teetering just above junk" with $142B total debt planned. A downgrade to high-yield would trigger -15% to -25% stock drop, killing this trade.
3. Customer Concentration Risk Heavy dependence on OpenAI and Meta. If either reduces commitments or delays deployments, the $523B backlog story collapses.
4. Low Cloud Margins Oracle's cloud infrastructure operates at ~14% gross margins vs. AWS (30-35%) and Azure (40%+). At $50B capex, profitability questions are legitimate.
5. Macro Headwinds Interest rate sensitivity with $142B debt - each 100bp rate increase adds ~$1.4B annual interest expense. Economic slowdown could delay enterprise cloud migrations.
6. AI Trade Fatigue December 11 selloff triggered "AI trade fatigue" across the sector. If investor enthusiasm for AI infrastructure wanes, Oracle faces extended pressure despite strong backlog.
7. Execution Risk $50B capex must translate to revenue or profitability deteriorates. Gating factors are power, GPUs, networking, and land. Oracle competes with Microsoft, Amazon, and Google for constrained resources.
8. Time Decay This trade has 99 days to work. If Oracle grinds sideways at $190-200 for the next 3 months, theta decay erodes the position. The trader needs movement toward $250 to overcome time decay.
📊 Trading Strategies & Price Targets
Strategy 1: Conservative - Wait for Confirmation 🛡️
Approach: Don't chase this immediately. Wait for Oracle to reclaim $210-220 resistance before entering similar trades.
Rationale: The gamma analysis shows massive resistance at $200 (41.87M GEX). Until Oracle proves it can break and hold above $210, the risk/reward isn't favorable. Let the trade prove itself.
Entry Signal:
- Oracle closes above $210 on strong volume
- RSI rebounds above 40 (from current oversold levels)
- Bullish reversal pattern (hammer, morning star) on daily chart
Position:
- Buy smaller bull call spread: $210/$250 strikes for March 2026
- Or wait for pullback to $185-190 support and buy April/May calls at lower risk
Target: $225-235 (conservative recovery to prior support levels) Probability: 60% - Oracle has strong institutional support and analyst targets well above here Max Risk: 10-15% of trading capital
Strategy 2: Balanced - Follow the Smart Money 📈
Approach: Mirror the institutional trade with a scaled-down version, but give yourself more time.
Rationale: If someone is putting $9.1M to work at these levels, they likely have better information and models than retail traders. However, don't go all-in - scale appropriately.
Position:
- Buy April/May 2026 $220/$260 bull call spread
- Or buy June 2026 $200 calls outright (more time, simpler)
- Size: 3-5% of portfolio maximum
Entry:
- Leg in over 2-3 days to average entry
- Consider entering 1/3 now, 1/3 if Oracle holds $190, 1/3 if it breaks above $205
Target: $250-275 by Q3 earnings Probability: 45-50% - requires execution on Q3 earnings and no major negative catalysts Max Risk: Position can go to zero if Oracle continues declining
Strategy 3: Aggressive - Full Send on the Recovery 🚀
Approach: Bet big that yesterday's crash was maximum pessimism and Oracle bounces hard into Q3 earnings.
Rationale: The extreme Z-scores (100.86, 55.22), record volume, analyst support, and $523B backlog suggest this selloff was emotional rather than fundamental. Oracle has beaten EPS expectations repeatedly - a Q3 beat could gap the stock up 15-20%.
Position:
- Replicate the trade: Buy March 2026 $250 calls, sell $300 calls (scaled to your size)
- Or go more aggressive: Buy March $220/$270 spread (closer to current price, higher probability)
- Alternative: Sell March $180 puts (collect premium, willing to own stock at $180)
Entry: Now - the trade thesis is that $192 was the bottom Target: $280-300 by March expiration Probability: 30-35% - requires everything to go right (Q3 beat, debt financing success, no macro shocks) Max Risk: Total loss possible; only do this with money you can afford to lose
Aggressive Traders: Could also sell put credit spreads at $170/$160 to collect premium betting Oracle doesn't collapse further. Risk is defined ($10 wide spread) but you're betting against continued selling.
🎓 Options Greeks Analysis
For the Bull Call Spread ($250/$300):
Delta:
- Long $250 calls: Delta ~0.30-0.35 (30-35% probability of finishing ITM)
- Short $300 calls: Delta ~0.10-0.15 (10-15% probability of finishing ITM)
- Net Delta: ~0.20-0.25 per spread (behaves like owning 20-25 shares per contract)
At 21,000 contracts, the position has effective delta exposure of ~420,000-525,000 shares ($80M+ directional exposure at current price).
Gamma:
- Positive gamma on the long $250 calls - benefits from upward moves
- Negative gamma on the short $300 calls - hurts from extreme upward moves above $300
- Net: Gamma is positive but capped - accelerates gains from $200 → $250, then slows above $280
Theta (Time Decay):
- Long $250 calls: Losing ~$0.03-0.05 per day per contract
- Short $300 calls: Gaining ~$0.01-0.02 per day per contract
- Net Theta: Slightly negative (~-$0.02-0.03 per day per spread)
With 99 days to expiration, the position loses ~$2-3 per spread per day to theta, or ~$42,000-63,000 daily across 21,000 spreads. This trade needs Oracle to move, not sit still.
Vega (Volatility Sensitivity):
- Long $250 calls: Positive vega - benefits from implied volatility increase
- Short $300 calls: Negative vega - hurts from implied volatility increase
- Net Vega: Slightly positive (~0.10-0.15 per spread)
Post-earnings, IV is likely elevated. If volatility collapses (Oracle chops sideways for weeks), the position loses value even if stock stays flat. However, if another shock hits (bad news, sector weakness), IV expansion helps cushion losses.
Breakeven Analysis:
- Lower Breakeven: ~$228 ($250 strike - [$5.9M net debit / 21,000 contracts])
- Upper Profit Cap: $300 (short call strike)
- Maximum Profit: Reached anywhere above $300 at expiration
- Maximum Loss: $5.9M (if Oracle closes below $250 on March 20)
Probability Analysis (based on implied move):
- Probability ORCL > $250 by March: ~30-35% (based on options pricing)
- Probability ORCL > $228 (breakeven): ~45-50%
- Probability ORCL > $300 (max profit): ~10-15%
Payoff Scenarios at Expiration:
| ORCL Price at Expiry | Spread Value | P&L | Return |
|---|---|---|---|
| $200 or below | $0 | -$5.9M | -100% |
| $228 (breakeven) | ~$28 | $0 | 0% |
| $250 (long strike) | ~$28 | $0 | 0% |
| $275 (mid-point) | $53 | +$5.5M | +93% |
| $300 (short strike) | $78 | +$12.5M | +212% |
| $350+ | $78 (capped) | +$12.5M | +212% |
🔮 Bottom Line
This is a high-conviction contrarian trade placed at a moment of maximum fear. Oracle just experienced its worst crash in 24 years, analysts are slashing targets, and FCF is deeply negative. But someone with $9.1M just stepped in to bet on a 26% recovery by March.
The bull case is compelling:
- $523B AI backlog up 438% YoY
- 68% cloud infrastructure growth (fastest in cloud)
- $300B OpenAI contract driving capex (spend money to make money)
- Avg. analyst target $334.52 (74% upside)
- Technical capitulation - 138% above average volume, oversold conditions
- Q3 earnings March 16 (perfect timing for this trade)
The bear case is real:
- -$13.18B free cash flow miss by $8B
- $142B total debt, "credit teetering just above junk"
- 14% cloud margins vs. AWS 30-35%
- Customer concentration (OpenAI, Meta)
- "AI trade fatigue" across the sector
- Execution risk on $50B capex
Who Should Consider This Trade:
- Experienced options traders comfortable with defined-risk spreads
- Investors who believe Oracle's AI infrastructure story despite the debt concerns
- Traders with 3-month time horizon willing to ride volatility
- Those who can afford to lose the entire premium if Oracle stays weak
Who Should Avoid:
- Options beginners (this is complex timing with high risk)
- Investors concerned about Oracle's debt and FCF situation
- Anyone who can't stomach 100% loss scenarios
- Short-term traders expecting quick profits (this needs time)
Final Verdict: This trade has 45-50% probability of reaching breakeven and 30-35% probability of hitting max profit. The risk/reward is asymmetric (lose $5.9M vs. make up to $44.1M), but you're betting against significant fundamental concerns. The extreme Z-scores suggest smart money sees value here - but remember, even smart money can be wrong.
My take: If you believe in Oracle's AI infrastructure thesis and think the selloff was overdone, consider a scaled-down version with more time (April/May expirations) or wait for technical confirmation above $210. Don't go all-in on one trade, even if the Z-scores are screaming "unusual." Size appropriately and have a plan for Q3 earnings on March 16.
📚 Key Takeaways
- ✅ Massive contrarian bet: $9.1M committed to Oracle recovery after worst drop in 24 years
- ✅ Extreme Z-scores: 100.86 and 55.22 - statistical black swan territory, not your average flow
- ✅ Perfect timing: Expires March 20, just 4 days after Q3 earnings (March 16)
- ✅ Defined risk: Max loss $5.9M, max gain ~$44.1M (7.5x return potential)
- ⚠️ Real risks: Negative FCF, $142B debt, credit rating concerns, customer concentration
- ⚠️ Bearish gamma: Significant resistance at $200-220 levels, needs strong catalyst to break through
- 🎯 Breakeven: ~$228 (18% upside from current $192.53)
- 🎯 Max profit: $300+ (55% upside from current)
- 📊 Probability: ~45-50% chance of profit, ~30-35% chance of max profit
- 🚨 Not for beginners: Complex trade requiring options experience and strong conviction
Disclaimer: This analysis is for educational purposes only and not financial advice. Options trading carries substantial risk and may not be suitable for all investors. The positions described involve risk of total loss. Past performance does not guarantee future results. Always conduct your own due diligence and consult with a qualified financial advisor before making investment decisions.
Data sources: ThetaData (options flow), Oracle Investor Relations (earnings), multiple financial news outlets (catalysts). Analysis current as of December 11, 2025.