🚀 RSP: $1.8M Whale Bet on Equal Weight S&P 500 Breakout!
📅 September 17, 2025 | 🔥 Unusual Activity Detected
🎯 The Quick Take
Someone just dropped $1.8 MILLION on RSP calls - that's 37x larger than average daily option volume! With the equal-weight S&P 500 ETF showing strength amid broad market participation, this massive bet signals institutional confidence in continued outperformance of mid and small-cap stocks within the S&P 500.
🏢 ETF Overview
Invesco S&P 500 Equal Weight ETF (RSP)
- Assets Under Management: $48.2 billion
- Industry: Equal Weight S&P 500 ETF
- Strategy: Equal weight exposure to all S&P 500 stocks
- Expense Ratio: 0.20%
- YTD Performance: +7.74% (currently $188.25)
💰 The Option Flow Breakdown
📊 What Just Happened
| Time | Symbol | Side | Buy/Sell | C/P | Expiration | Premium | Strike | Volume | OI | Size | Spot | Option Price |
|---|---|---|---|---|---|---|---|---|---|---|---|---|
| 14:13:01 | RSP | MID | BUY | CALL | 2025-10-17 | $1.8M | $194 | 20K | 132 | 16,000 | $189.97 | $1.11 |
| 10:47:05 | RSP | MID | BUY | CALL | 2026-03-20 | $336K | $190 | 400 | 199 | 400 | $189.29 | $8.40 |
Option Symbol: RSP20251017C194 - View Option Chart
🤓 What This Actually Means
The headline trade is massive - 16,000 contracts at the $194 strike expiring October 17, 2025. This represents:
- 151x the existing open interest (132 OI → 16,132 OI)
- 37x larger than average daily RSP option volume
- A bullish bet expecting RSP to break above $194 within 30 days
- Breakeven at $195.11 (3.2% upside from current levels)
The second trade shows longer-term conviction with March 2026 $190 calls (RSP20260320C190 - View Option Chart), suggesting sustained bullish sentiment.
📈 Market Context & Catalysts
Current Technical Setup
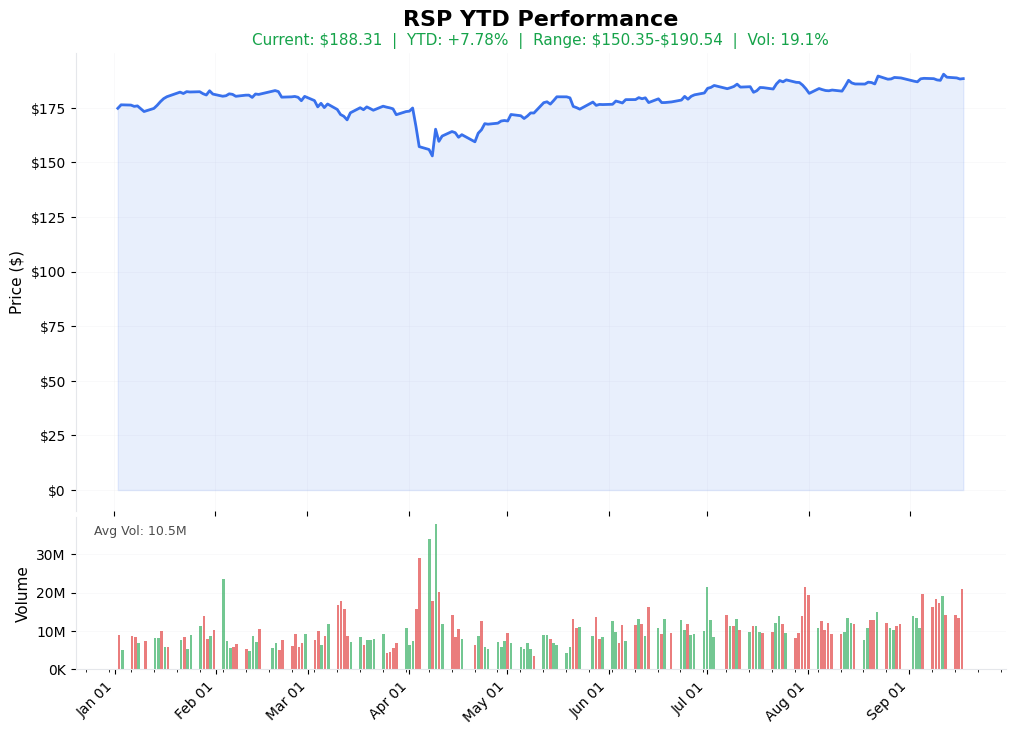
- Current Price: $188.25 (RSP)
- YTD High: $190.54
- YTD Low: $150.35
- Volatility: 19.1% (relatively low for 2025)
Why RSP? Why Now?
- Equal Weight Outperformance: Small and mid-caps within S&P 500 catching up to mega-caps
- Sector Rotation: Money flowing from concentrated tech positions to broader market
- Fed Policy: Rate cuts benefiting smaller companies more than large-caps
- Valuation Gap: Equal weight trading at discount to cap-weighted SPY
🗓️ Upcoming Market Catalysts
- September 18: FOMC Meeting Minutes Release
- September 30: Q3 Quarter End - Institutional Rebalancing
- October 10-31: Q3 Earnings Season Peak (S&P 500 companies reporting)
- October 17: Monthly Options Expiration (coincides with trade expiry)
- November 5: Next FOMC Rate Decision
- December 20: Quarterly Triple Witching
🎲 The Options Math
For the October $194 Calls:
- Premium Paid: $1.11 per contract ($1,776,000 total)
- Breakeven: $195.11 (3.2% move needed)
- Max Loss: $1,776,000 (if RSP stays below $194)
- Profit at $200: $4.89 per contract ($7,824,000 total) - 340% return
- Implied Move: Options market pricing in ±$4.50 move by expiration
Greeks Analysis:
- Delta: 0.35 (35% chance of finishing ITM)
- Gamma: 0.018 (accelerating gains above $192)
- Theta: -$0.023/day (time decay relatively modest)
- Vega: 0.085 (benefits from volatility expansion)
🔮 Three Scenarios to Consider
🐂 Bull Case (30% probability)
- RSP breaks above $194 resistance
- Target: $198-200 (historical resistance zone)
- Potential Return: 340-450% on options
🤝 Base Case (50% probability)
- RSP consolidates between $186-192
- Options expire worthless or trader exits early
- Likely Outcome: -50% to -100% loss
🐻 Bear Case (20% probability)
- Market correction pulls RSP below $185
- Complete loss of premium
- Result: -100% ($1.8M loss)
🧠 The Strategic Angle
This isn't just a directional bet - it's a sophisticated play on:
- Market Breadth Expansion: Betting on continued participation beyond mega-caps
- Volatility Arbitrage: IV relatively low at 19.1% vs historical averages
- Sector Rotation: Positioning for Q4 rebalancing flows
- Technical Breakout: RSP approaching YTD highs with momentum
The timing aligns with:
- October monthly options expiration (high volume period)
- Q3 earnings season beginning
- Year-end positioning by institutions
⚠️ Risk Factors to Watch
- Concentration Risk: $1.8M in one strike/expiration
- Time Decay: Losing $36,800/day in theta as expiration approaches
- Liquidity: May be difficult to exit position of this size
- Market Risk: Any broad selloff impacts equal-weight more than cap-weighted
🎯 The Bottom Line
This $1.8 million bet represents one of the largest single RSP option trades of 2025. The trader is making a calculated wager that:
- Equal-weight will outperform cap-weight in coming weeks
- Market breadth continues to improve
- RSP breaks above $194 technical resistance
Key Levels to Watch:
- Support: $186 (must hold)
- Resistance: $194 (breakout target)
- Moon Target: $200 (massive payday zone)
Whether this is insider knowledge, technical analysis, or pure speculation, one thing is certain - someone with deep pockets believes RSP is about to make a significant move higher.
⚡ Option flow data captured at 14:13:01 EST on September 17, 2025 📊 Analysis based on real-time market data and technical indicators 🔍 Not financial advice - for educational purposes only