💎 SEIC Massive $5.3M Put Calendar Roll - Smart Money Hedging Into Expiration! 🛡️
📅 December 18, 2025 | 🔥 Unusual Activity Detected
🎯 The Quick Take
Someone just executed a $5.3 MILLION diagonal put strategy in SEIC this morning at 09:45:19! This sophisticated trader bought 11,000 contracts of $40 strike puts expiring January 16th while simultaneously selling 4,700 contracts of $50 puts expiring TOMORROW (December 19th). With SEIC trading at $44.52 and tomorrow being quarterly triple witch expiration, this is a defensive roll-down and roll-out - smart money closing short-term positions and extending protection to capture Q4 earnings and FCA regulatory resolution. Translation: Institutional players are repositioning hedges for maximum flexibility through critical upcoming catalysts!
📊 Company Overview
SEI Investments Company (SEIC) is a global financial services technology powerhouse providing mission-critical infrastructure for wealth management:
- Market Cap: $10.17 Billion
- Industry: Security Brokers, Dealers & Financial Services
- Current Price: $44.52
- Primary Business: Investment processing, management, and operations services for financial institutions across four segments: Private Banks, Investment Advisors, Institutional Investors, and Investment Managers
- Assets Under Management/Administration: $1.6 Trillion (including LSV Asset Management stake)
- Competitive Position: Leading provider of wealth management technology platforms serving 4,000+ financial institutions worldwide
💰 The Option Flow Breakdown
The Tape (December 18, 2025 @ 09:45:19):
| Time | Symbol | Side | Buy/Sell | Type | Expiration | Premium | Strike | Volume | OI | Size | Spot | Option Price |
|---|---|---|---|---|---|---|---|---|---|---|---|---|
| 09:45:19 | SEIC | ASK | BUY | PUT $40 | 2026-01-16 | $3.0M | $40 | 11,000 | 151 | 11,000 | $44.52 | $2.71 |
| 09:45:19 | SEIC | BID | SELL | PUT $50 | 2025-12-19 | $2.3M | $50 | 4,700 | 8,100 | 4,700 | $44.52 | $4.90 |
🤓 What This Actually Means
This is a diagonal put calendar roll - a sophisticated institutional hedge repositioning strategy! Here's the breakdown:
The Sell Side (Closing Position):
- 💸 Premium collected: $2.3M ($4.90 × 4,700 contracts)
- 🔒 Expiring tomorrow: December 19th is quarterly triple witch expiration
- ⏰ Deep in-the-money: $50 strike is $5.48 (12.3%) above current price
- 📊 Large open interest: 8,100 contracts shows this was an established position
- 🎯 Why close now: With stock at $44.52, these $50 puts have significant intrinsic value - trader taking profits and exiting before time decay accelerates into final 24 hours
The Buy Side (New Position):
- 💰 Premium paid: $3.0M ($2.71 × 11,000 contracts)
- 🛡️ Protection strike: $40 provides 10.2% downside cushion below current price
- ⏰ Extended duration: 29 days to expiration captures Q4 2025 earnings (expected late January 2026)
- 📊 Massive size increase: 11,000 contracts vs 4,700 sold = 2.3x larger position
- 🎪 Strategic timing: Positions through FCA regulatory resolution timeline and Stratos Stage 2 closing
Net Cost of Trade:
- 📉 Total capital deployed: $3.0M paid - $2.3M collected = $700K net debit
- 🔄 Effective cost per new put: $0.64 per contract ($700K ÷ 11,000)
- 🎯 This is CHEAP insurance: Paying only $0.64 for January $40 puts by using proceeds from closing December $50 puts
What's really happening here: This trader had a profitable short-term hedge ($50 puts expiring tomorrow worth $4.90 with stock at $44.52) and is rolling the entire position to protect through critical January catalysts. By selling high-premium short-dated puts and buying lower-premium longer-dated puts, they're extending protection for only $700K net cost. The 2.3x size increase (11,000 vs 4,700) shows increased concern about downside risk over the next month.
Unusual Score: 🔥 EXTREME - 812.88x average size for the buy leg! The Z-score places this in "EXTREMELY_UNUSUAL" territory - this happens maybe a few times per year for SEIC. The sell leg at 1.16x average is "ABOVE_AVERAGE" with 2 similar closing trades identified. This diagonal roll represents sophisticated portfolio management by institutional players managing significant SEIC exposure.
📈 Technical Setup / Chart Check-Up
YTD Performance Chart
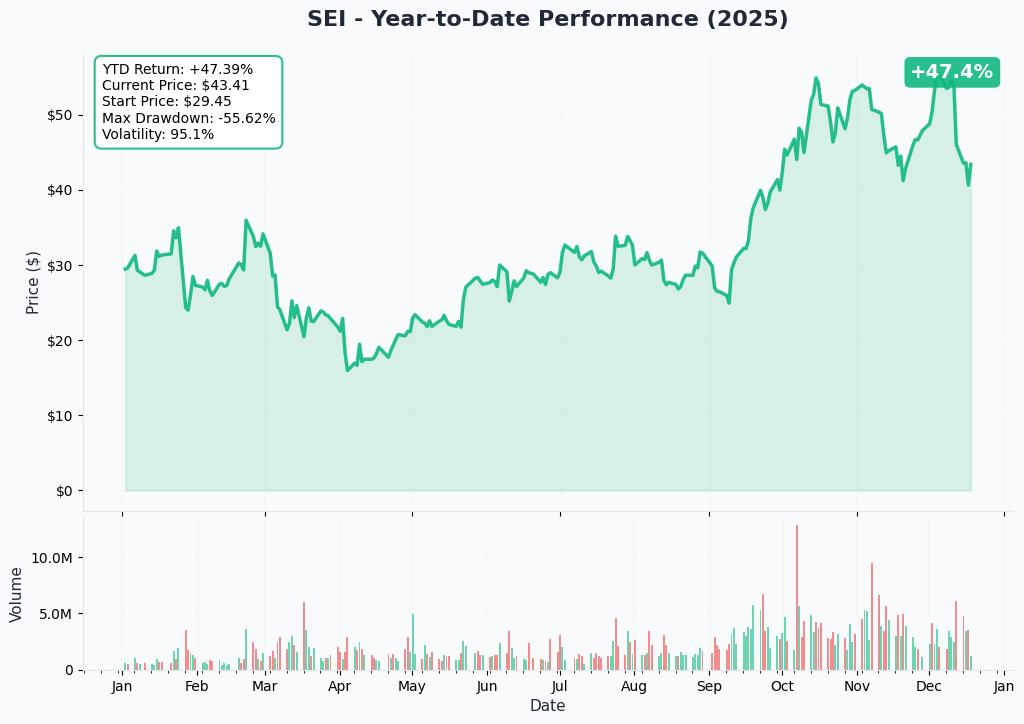
SEIC has delivered a volatile but positive year - currently trading at $44.52 after a wild ride through multiple catalysts. The chart reveals a story of execution and uncertainty - after reaching a 52-week high of $93.96 earlier in the year, the stock has pulled back 52.6% to current levels amid FCA regulatory headwinds.
Key observations:
- 📉 Major correction: Down from $93.96 high, now trading near March lows around $44-45
- 💔 Support tested: Current price sitting on critical support zone that held multiple times this year
- ⚖️ Range-bound action: Trading in $40-50 channel for past several weeks
- 📊 Volume patterns: Increased volume on down days suggests institutional distribution
- 🎢 High volatility: Wide intraday swings typical of stocks facing binary catalyst uncertainty
- ⚠️ Below all moving averages: Bearish technical setup with overhead resistance layers at $50, $55, $60
Gamma-Based Support & Resistance Analysis
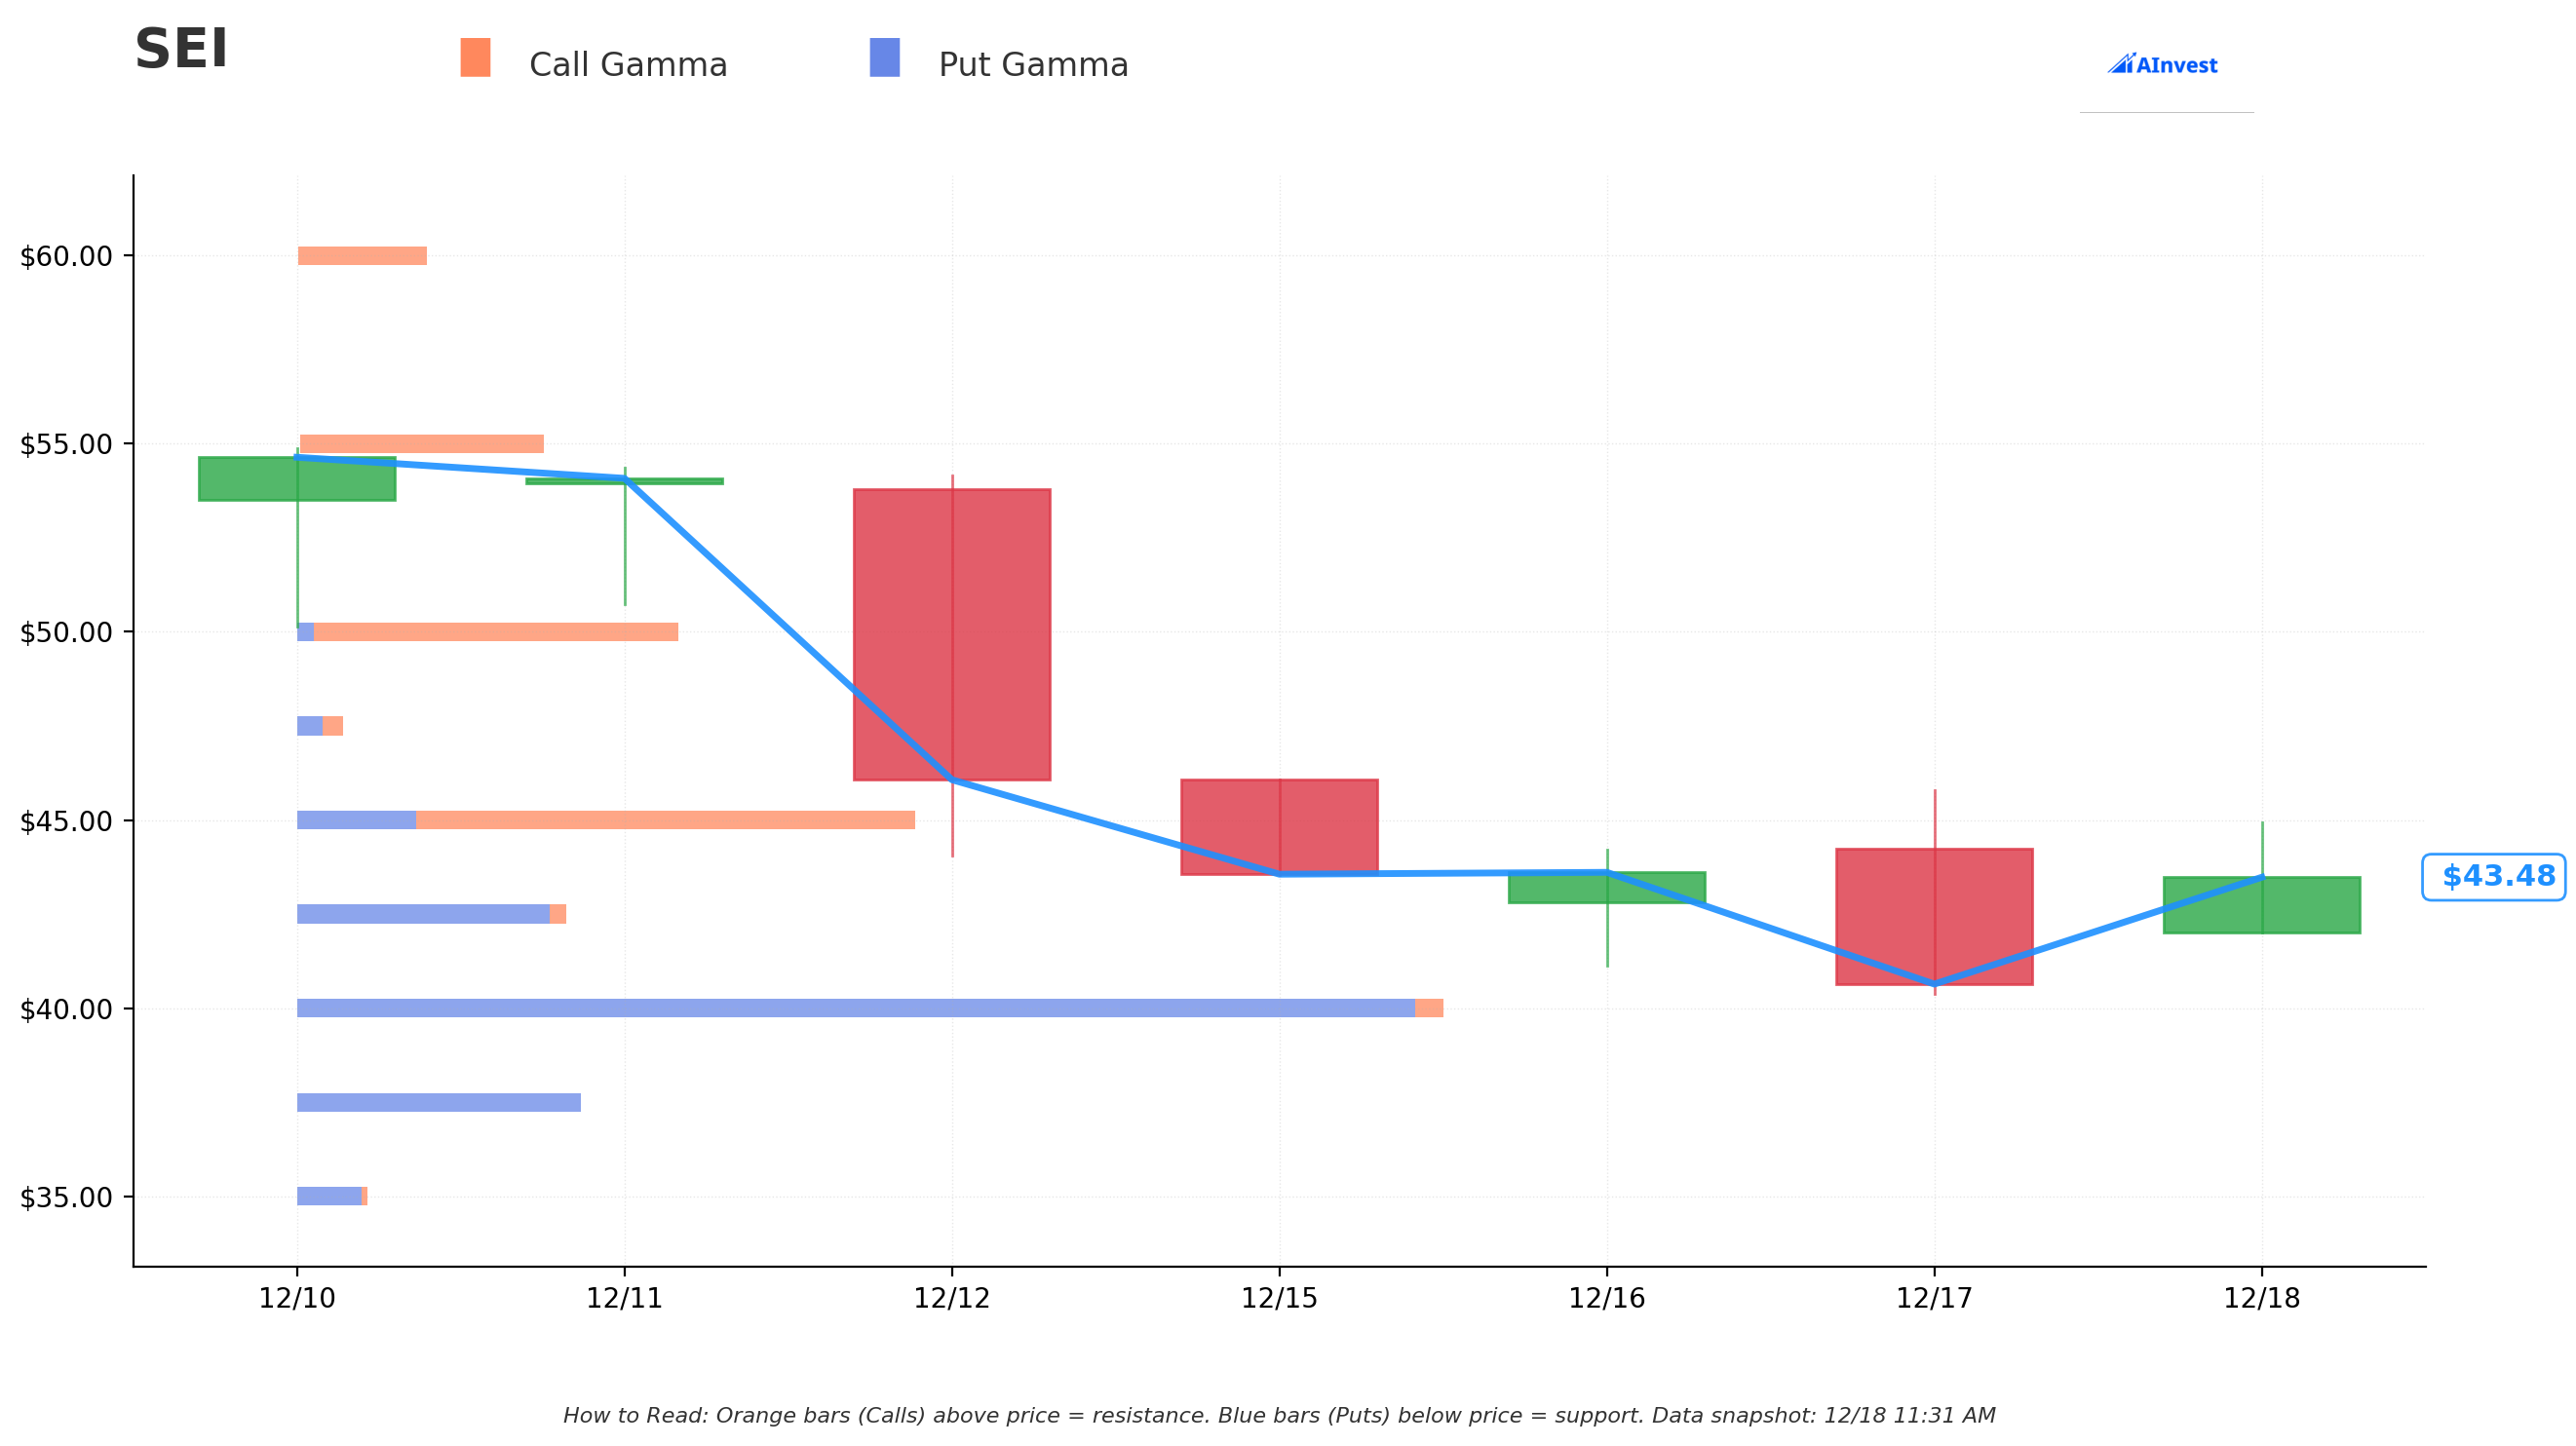
Current Price: $44.52 (as of 11:32 AM ET)
The gamma exposure map reveals critical price magnets and barriers that will govern near-term price action:
🔵 Support Levels (Put Gamma Below Price):
- $42.50 (2.4% below) - Immediate support with 0.76B total gamma exposure (strongest nearby floor)
- $40.00 (8.1% below) - MAJOR STRUCTURAL FLOOR with 3.26B gamma exposure (THIS IS WHERE THE NEW PUTS ARE STRUCK! Not coincidental - highest put gamma level)
- $37.50 (13.9% below) - Secondary support at 0.80B gamma
- $35.00 (19.6% below) - Deep support zone with 0.20B gamma (disaster scenario level)
🟠 Resistance Levels (Call Gamma Above Price):
- $45.00 (1.1% above) - Immediate ceiling with 1.73B gamma exposure (STRONGEST RESISTANCE - dealers will sell into rallies here)
- $47.50 (6.7% above) - Secondary resistance at 0.12B gamma
- $50.00 (12.3% above) - Major ceiling zone with 1.06B gamma (THIS IS WHERE THE OLD PUTS WERE STRUCK - significant level)
What this means for traders: SEIC is trading in a TIGHT consolidation zone just below massive $45 resistance (1.73B call gamma - the single largest overhead level). The stock is essentially pinned between $42.50 support and $45 resistance in a 5.6% range. Market makers holding enormous positions at $45 creates natural selling pressure as price approaches.
Critical insight: The put buyer struck EXACTLY at $40 where there's 3.26B gamma support - the HIGHEST put gamma level on the entire chart. This is the major structural floor that would attract significant buying if tested. They're positioning protection just below current consolidation, expecting that if SEIC breaks $42.50 support, it could flush to $40 quickly (10.2% downside risk).
The $50 level context: Notice the seller closed $50 puts expiring tomorrow. With 1.06B gamma at $50 and stock at $44.52, this represented a 12.3% above-market put position that had served its hedging purpose. Smart to take profits here rather than hold into final day time decay.
Net GEX Bias: Bearish (3.82B call gamma vs 5.52B put gamma = -1.70B net bias). Put gamma dominance shows dealers are net long gamma, which creates dampening effect on volatility and two-way selling pressure. This setup favors range-bound trading between $42.50-$45.00 absent major catalyst.
Implied Move Analysis
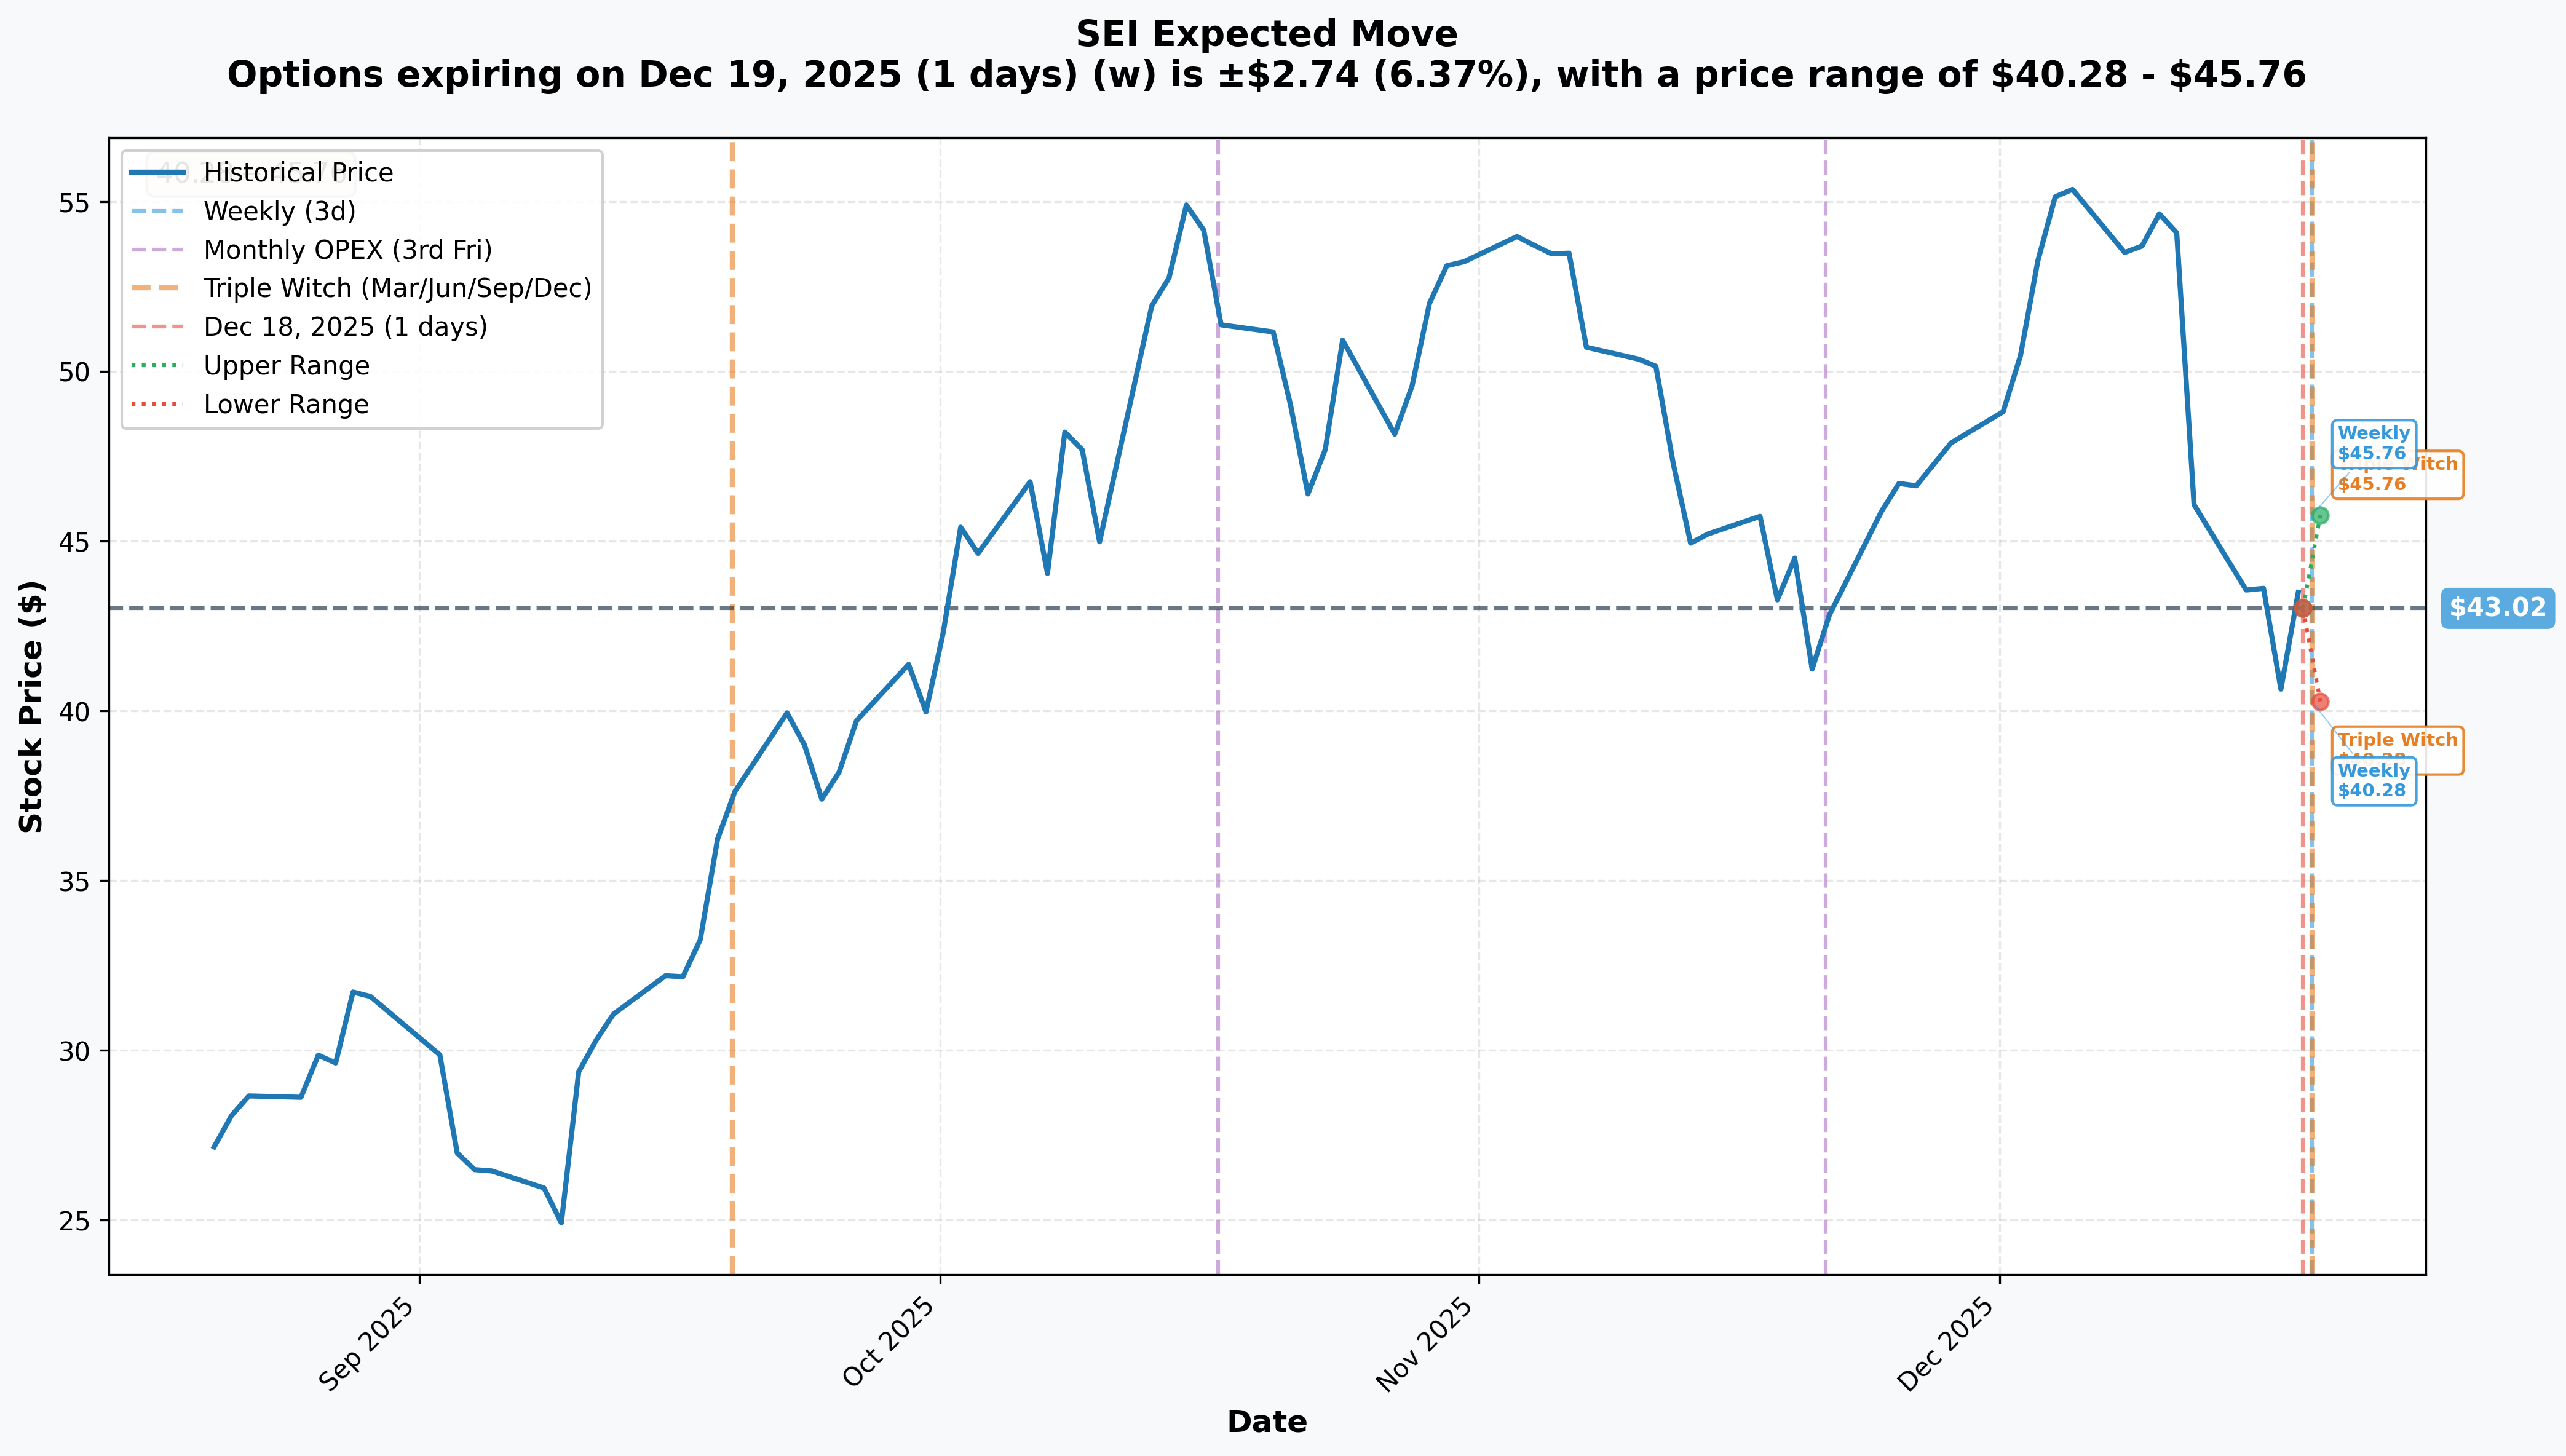
Options market pricing for upcoming expirations:
- 📅 Weekly/Monthly/Quarterly (Dec 19 - 1 day - TOMORROW!): ±$2.74 (±6.37%) → Range: $40.28 - $45.76
- 📅 January OPEX (Jan 16 - 29 days - THIS TRADE!): Not separately displayed, but extrapolating from weekly move suggests ±$4-5 range
Translation for regular folks: Options traders are pricing in a 6.37% move ($2.74) by tomorrow's expiration - that's a MASSIVE implied move for a 1-day period! This reflects the quarterly triple witch expiration pin dynamics and potential news flow risk. The market expects SEIC could trade anywhere from $40.28 to $45.76 by tomorrow's close.
Key insight: The lower bound of tomorrow's implied move ($40.28) aligns PERFECTLY with the $40 put strike this trader bought for January. They're positioning protection at the extreme downside tail of the near-term distribution. This suggests they view tomorrow's quarterly expiration as a potential volatility event, but want protection extending beyond just December 19th through critical Q4 earnings and FCA catalysts in January.
The upper range of $45.76 sits just above the $45 gamma resistance, confirming that level as the realistic near-term ceiling. If SEIC rallies into year-end, expect systematic selling pressure at $45-46.
🎪 Catalysts
🔥 Immediate Catalysts (Already Happened - Setting Context)
Stage 1 Stratos Wealth Holdings Closing - December 3, 2025 ✅
SEIC completed the first stage of its strategic $544M Stratos acquisition on December 3rd - just 15 days ago:
- 💰 Acquired U.S.-based Stratos business for ~$441M (81% of total transaction)
- 🎯 Brings 350+ financial advisors across 29 states with ~$38B in client assets
- 📈 Immediate accretion to Investment Advisors segment revenue
- ✅ Execution milestone achieved - reduces one uncertainty overhang
- ⏰ Market still digesting integration implications and advisor retention metrics
FCA Regulatory Restrictions - Ongoing Since February 26, 2025 ⚠️
The UK Financial Conduct Authority imposed restrictions on SEI Investments (Europe) Limited (SIEL) earlier this year that remain in effect:
- 🚨 Cannot enter significant new agreements with institutional clients without FCA permission
- 🔒 Restricted from introducing new products/services without written FCA approval
- 📊 Comprehensive governance review required with no clear timeline for resolution
- 💸 Material impact on SIEL revenue growth - UK platform business constrained
- ⚖️ Status remains unclear with market awaiting resolution updates
🚀 Near-Term Catalysts (Next 30 Days - THIS IS KEY!)
Q4 2025 Earnings Release - Expected Late January 2026 (Within Put Expiration Window!) 📊
SEIC will report fiscal Q4 2025 results in late January 2026 based on historical patterns (Q4 2024 announced January 29, 2025). This falls EXACTLY within the January 16th put expiration window or immediately after:
Wall Street Expectations:
- 📊 Q4 2025 EPS: $1.26 consensus (Zacks estimate)
- 💰 Full Year 2025 EPS: $5.51 (Zacks) to $5.58 (William Blair) - up from $4.75 in 2024
- 📈 Revenue trajectory: Continuation of double-digit growth from Q3 2025 levels
- 🎯 Operating margin target: Maintain or expand Q3's record 28% operating margin
Critical Metrics to Watch:
- 💵 Net Sales Events: Q3 2025 was $30.5M with 9-month total of record $106.3M. Q4 needs strong finish to match 2024's full-year $127.9M
- 📊 AUM/AUA Growth: Despite market volatility in Q4 2025, need to show asset growth
- 🇬🇧 FCA Update: Any resolution or timeline on UK regulatory restrictions would be MAJOR catalyst
- 🤝 Stratos Integration: Early feedback on advisor retention and revenue synergies post-Stage 1 closing
- 🛠️ LifeYield Progress: Integration milestones for unified managed household technology
- 💸 Capital Allocation: Buyback continuation (had $556M authorization remaining in March 2025)
Upside Surprise Potential: If SEIC can deliver:
- EPS above $1.30 (beating $1.26 consensus by 3%+)
- Operating margins expanding to 29-30% from efficiency gains
- FCA restrictions lifted or positive resolution timeline announced
- Strong Stratos revenue contribution with high advisor retention (>95%)
- 2026 guidance showing acceleration from OpenAI-related industry tailwinds
...stock could rally 10-15% to $50-52 range, breaking through gamma resistance.
Downside Disappointment Risk: If SEIC reports:
- EPS miss below $1.20 or weak Q1 2026 guidance
- Net sales events disappointing (<$25M in Q4)
- FCA restrictions extended with no timeline
- Stratos advisor attrition above 10% post-closing
- Margin compression from integration costs or competitive pricing pressure
...stock could break $42.50 support and test $40 floor quickly (exactly where this put protection kicks in!).
Quarterly Triple Witch Expiration - December 19, 2025 (TOMORROW!) 📅
Tomorrow's expiration creates unique dynamics:
- 🎯 Pin risk: Stock may gravitate toward max pain around $45 level
- 📊 Volume surge: Quarterly expirations see 2-3x normal volume creating volatility
- 🔄 Position rebalancing: Institutions roll or close positions creating unusual flow
- ⚠️ After-hours risk: Significant moves possible post-4pm as hedges come off
This explains the urgency of today's roll - the trader is exiting tomorrow's expiration entirely and repositioning for January catalysts.
Holiday Trading Period - December 20 - January 2 🎄
The next two weeks feature:
- 📉 Thin liquidity as institutions reduce risk into year-end
- 🎢 Potential for exaggerated moves on low volume
- 📰 Limited news flow during holiday period
- ⏰ Year-end portfolio rebalancing and tax-loss harvesting
- 🎯 January effect: Potential for early-year rally as funds deploy capital
This relatively quiet period allows the put buyer to hold protection cheaply (low theta decay on holidays) before January earnings volatility.
📊 Medium-Term Catalysts (Q1-Q2 2026)
Stage 2 Stratos Wealth Closing - Expected 2026 🤝
Pending acquisition of Mexico-based NSC business for remaining ~$103M:
- 📋 Subject to regulatory approval and customary closing conditions
- 🎯 Completes the $544M strategic investment reaching 57.5% equity stake
- 📈 Further scale addition to Investment Advisors segment
- ⚖️ Put/call rights potentially leading to 100% SEIC ownership
- 🚨 Risk Factor: Advisor retention and integration execution in both U.S. and Mexico
LifeYield Integration Milestones - H1 2026 🛠️
SEI acquired LifeYield in December 2024 to become the first in the industry to provide real-time, automated unified managed household (UMH) capabilities:
- 🔧 Full API integration into SEI Wealth Platform expected throughout 2025-2026
- 🚀 Launch of automated tax-smart investing at scale across client base
- 💰 Cross-selling opportunity to existing 4,000+ institutional clients
- 📊 Client adoption metrics will be key indicator of value realization
- 🎯 Revenue impact initially not material, but positions SEIC as industry leader in tax-efficient investing
FCA Regulatory Resolution - Timeline Uncertain ⚖️
Potential outcomes for UK platform business restrictions:
- ✅ Best case: FCA lifts restrictions in H1 2026 after satisfactory governance review - stock rallies 15-20%
- 📋 Base case: Partial restrictions lifted with ongoing monitoring through 2026 - neutral to slight positive
- ❌ Downside case: Extended restrictions with operational changes or financial penalties - stock drops 10-15%
- ⏰ Timeline: No clear end date communicated; creates ongoing uncertainty overhang
Resolution would remove significant uncertainty and unlock SIEL growth potential.
SEI Access Marketplace Expansion - Ongoing 🌐
Alternative investment platform momentum continues:
- 📈 As of July 2025: 23,500+ subscriptions, $5.1B+ in transactions processed
- 🎯 17 new fund managers added in July 2025 including BlackRock, Hamilton Lane, Invesco, KKR
- 📊 Target: Expand from 165 to 200+ fund managers by mid-2026
- 💰 Revenue impact: Incremental fee revenue from subscription processing and platform usage
- 🚀 Positions SEIC to capture share of growing private markets democratization trend
Capital Allocation Updates - Ongoing 💸
SEIC has demonstrated shareholder-friendly capital allocation:
- 💰 Buybacks: $556M authorization remaining as of March 2025 (6.1% of market cap)
- 📊 Historical pace: Repurchased 3.1M shares in Q4 2024 ($259.5M), 2.5M shares in Q1 2025 ($192.8M)
- 💵 Dividends: Increased semi-annual dividend to $0.52/share in December 2025 (was $0.49) - 37 consecutive years of payments, 11 straight years of increases
- 🎯 Yield: 1.19% with low 17.66% payout ratio indicates strong earnings coverage
Continued buybacks at current depressed levels would be significant positive catalyst.
⚠️ Risk Catalysts (Negative)
Institutional Segment Weakness - Ongoing Headwind 📉
Q4 2024 showed concerning trends that may persist:
- 📊 AUM declined 3% in Institutional Investors segment due to plan terminations
- 💸 LSV value strategy has faced redemptions amid growth style dominance
- 📉 Declining defined benefit pension market creates structural headwind
- ⚖️ If Q4 2025 shows continued net outflows, validates negative segment trajectory
Expense Pressure - Management Flagged Risk 💰
Management indicated gradual expense increases in 2025 from:
- 👥 Hiring to support growth initiatives (Stratos integration, LifeYield rollout)
- 🖥️ Technology investments for platform enhancements
- 🏢 Integration costs from M&A activity
- ⚠️ Could pressure operating margins if not offset by revenue growth
If Q4 shows margins compressing below 26%, would concern investors.
Competitive & Market Risks ⚖️
- 🏦 Primary competitors (FIS, SS&C Technologies, FNZ Group) have deeper pockets and scale
- 💸 Fee compression from fintech competition and passive investing trends
- 📊 Performance tied to market conditions - equity market corrections impact asset-based revenue
- 🌍 Geopolitical uncertainty in UK/Europe exposes SIEL operations to regional risks
🎲 Price Targets & Probabilities
Using gamma levels, implied move data, catalysts, and the unusual put positioning, here are scenarios through January 16th expiration:
📈 Bull Case (20% probability)
Target: $50-55
How we get there:
- 💪 Q4 earnings CRUSH expectations with EPS $1.30+ (vs $1.26 consensus) and operating margins expanding to 29%+
- ✅ FCA BREAKTHROUGH: UK regulatory restrictions lifted or major progress announced with clear timeline - removes biggest overhang
- 🤝 Stratos integration ahead of schedule with >95% advisor retention and immediate revenue synergies
- 💵 Net sales events strong finish (>$35M in Q4) bringing full-year to $140M+ vs $127.9M in 2024
- 📈 AUM/AUA growth accelerates despite Q4 market volatility
- 💰 Management announces accelerated buyback program taking advantage of depressed valuation
- 🌐 SEI Access marketplace crosses $6B in transactions with major new fund manager additions
- 📊 Strong 2026 guidance citing industry tailwinds from AI-driven wealth management adoption
Key metrics needed:
- Operating margin 28-30% (proving operating leverage)
- Data center/technology investments yielding measurable efficiency gains
- Private Banks and Investment Advisors segments showing strong double-digit growth
- Institutional segment stabilization (net flows positive or flat)
Probability assessment: Only 20% because it requires multiple positive catalysts aligning simultaneously (especially FCA resolution) with stock already facing technical resistance at $45. The put buyer clearly doesn't see this as likely or they wouldn't be paying for downside protection.
🎯 Base Case (55% probability)
Target: $40-47 range (CONSOLIDATION WITH DOWNSIDE BIAS)
Most likely scenario:
- ✅ Solid earnings meeting consensus ($1.24-1.28 EPS, in-line revenue)
- 📊 Operating margins maintain Q3's 28% level without expansion
- ⚖️ Net sales events decent but not spectacular ($28-32M in Q4)
- 🇬🇧 FCA update provides timeline but no immediate resolution - "progress being made"
- 🤝 Stratos integration progressing but too early for meaningful revenue impact
- 📉 Institutional segment shows continued modest weakness (low single-digit AUM decline)
- 💤 No major positive or negative surprises - market remains in "wait and see" mode
- 🔄 Trading within gamma bands ($42.50 support, $45 resistance) for weeks
- 💰 Volatility remains elevated due to regulatory uncertainty
This aligns with the put buyer's positioning: Stock consolidates in low $40s, threatens $42.50 support occasionally, but $40 puts expire out-of-the-money or with minimal value. The hedge served its purpose by providing downside insurance during uncertain earnings/catalyst period. Net cost of $700K for the roll is simply the "insurance premium" for peace of mind through January.
Why 55% probability: Stock at technical inflection point with fundamentals solid (strong margins, record sales, good capital allocation) but multiple uncertainties preventing breakout (FCA overhang, integration execution, institutional segment weakness). Most institutional players will hold and wait for clarity before adding exposure. Range-bound action most probable outcome.
📉 Bear Case (25% probability)
Target: $38-42 (TEST THE PUT STRIKE!)
What could go wrong:
- 😰 Earnings miss consensus or weak Q1 2026 guidance disappoints - EPS below $1.20
- 🚨 FCA announces extension of restrictions with NO clear timeline or path to resolution
- 💸 Stratos advisor attrition exceeds 10% post-Stage 1 closing - questions $544M valuation
- 📉 Net sales events disappoint (<$25M in Q4) suggesting competitive pressure
- 💰 Operating margins compress to 25-26% from integration costs and expense growth
- 🏦 Institutional segment shows accelerating AUM decline (>5%) from continued plan terminations
- 📊 Management guides conservatively for 2026 citing macro uncertainty and UK challenges
- 🌍 Broader financial services selloff drags all wealth management stocks lower
- 🔨 Break below $42.50 gamma support triggers technical selling cascade toward $40
Critical support levels:
- 🛡️ $42.50: Immediate floor with 0.76B gamma - MUST HOLD or momentum shifts bearish
- 🛡️ $40.00: MAJOR structural floor with 3.26B gamma (highest put gamma) + this $40 put strike - likely STRONG buying here
- 🛡️ $37.50: Extended support at 0.80B gamma - disaster scenario requiring multiple negative catalysts
Probability assessment: 25% because it requires several negative catalysts to align. SEIC's fundamentals remain strong (28% operating margins, record sales momentum, $1.6T AUA, strong buyback capacity), but FCA overhang, integration execution risk, and institutional segment weakness create realistic downside scenarios. The put buyer paying $700K net to roll protection clearly thinks this scenario has >25% odds.
Put P&L in Bear Case:
- Stock at $38 on Jan 16: Puts worth $2.00, net profit after $0.64 cost = $1.36/share × 11,000 = $1.50M gain (214% ROI on $700K net cost)
- Stock at $36 on Jan 16: Puts worth $4.00, net profit = $3.36/share × 11,000 = $3.70M gain (528% ROI!)
- Stock at $40 on Jan 16: Puts worthless (at-the-money), loss = -$0.64/share × 11,000 = -$700K (100% loss of net roll cost)
- Stock at $42+ on Jan 16: Puts worthless, loss = -$700K but underlying long position profitable
The genius of this trade: By rolling from $50 puts expiring tomorrow to $40 puts expiring January, they achieved:
- Extended protection through critical Q4 earnings catalyst
- Reduced strike from $50 to $40 (more realistic hedging level)
- Increased size 2.3x (11,000 vs 4,700 contracts) for broader coverage
- Net cost of only $700K ($0.64 per contract) by monetizing short-dated premium
💡 Trading Ideas
🛡️ Conservative: Cash Gang Until Q4 Earnings Clarity
Play: Stay on sidelines until late January Q4 earnings removes major uncertainty
Why this works:
- ⏰ Q4 earnings in ~30 days creates binary event risk - too dangerous to initiate new positions
- 🇬🇧 FCA regulatory overhang unresolved - no clear timeline for restrictions lifting
- 📊 Stock at technical inflection point ($42.50-$45 range) with no clear breakout/breakdown
- 💸 Better entry likely post-earnings after uncertainty resolves one way or another
- 🐋 The $5.3M institutional diagonal roll signals smart money is CAUTIOUS - why fight the tape?
- 📉 Historical pattern: Stocks facing regulatory uncertainty often consolidate/drift lower until resolved
- 🤔 Tomorrow's quarterly expiration could create volatility spikes on low volume
Action plan:
- 👀 Watch late January earnings for: EPS (need $1.26+), operating margins (target 28%+), FCA update, Stratos integration feedback
- 🎯 Look for pullback to $38-40 gamma support post-earnings if results disappoint - provides 12-15% margin of safety
- ✅ Need to see clear FCA resolution path before committing capital to eliminate major overhang
- 📊 Monitor unusual options activity in January - if institutions add MORE put protection, stay defensive
- ⏰ Revisit Q1 2026 when LifeYield integration and Stage 2 Stratos closing provide next catalysts
Risk level: Minimal (cash position) | Skill level: Beginner-friendly
Expected outcome: Avoid potential -10-15% drawdown if earnings disappoint or FCA news negative. Get better entry if stock consolidates lower. Maintain optionality for breakout on positive catalysts.
⚖️ Balanced: Post-Earnings Bull Put Spread (Define Risk, Collect Premium)
Play: After Q4 earnings clarity, sell bull put spread targeting gamma support zone
Structure: Sell $42.50 puts, Buy $40 puts (February 20 expiration - AFTER earnings)
Why this works:
- 📊 Targets identified gamma support levels ($42.50 immediate, $40 major floor with 3.26B gamma)
- 🎯 Essentially betting stock holds above $40 through earnings - aligning with strongest put gamma zone
- 💰 Defined risk spread ($2.50 wide = $250 max risk per spread, collect ~$60-80 credit)
- 🤝 "Copying" institutional positioning by selling premium at same levels they're buying protection
- ⏰ Post-earnings entry captures IV crush - sell when implied volatility elevated from earnings uncertainty
- 🛡️ Protects against modest downside to $42.50 while profiting if stock consolidates or rallies
Estimated P&L (adjust after seeing post-earnings premium levels):
- 💰 Collect ~$0.60-0.80 credit per spread (depends on IV levels post-earnings)
- 📈 Max profit: $60-80 per spread if SEIC above $42.50 at February expiration
- 📉 Max loss: $190-170 per spread if SEIC below $40 (defined and limited)
- 🎯 Breakeven: ~$41.70-41.90
- 📊 Risk/Reward: ~2.4:1 (risking $190 to make $80) which is acceptable for high-probability premium collection
Entry timing:
- ⏰ Wait 2-3 days post-Q4 earnings announcement (likely late January) for IV normalization
- 🎯 Only enter if:
- Earnings results not catastrophically bad (EPS >$1.15)
- FCA update not overtly negative (restrictions extended indefinitely)
- Stock trading $43-46 range (not already testing $40 floor)
- ❌ Skip if stock already below $41 (too close to lower strike, unfavorable risk/reward)
Position sizing: Risk only 3-5% of portfolio on this defined-risk trade (5-10 spreads for $10K account)
Management plan:
- ✅ Take profits at 50% max gain ($30-40) if achieved quickly
- 🛑 Close position if stock breaks $43 and threatens $42.50 (don't let small winner become big loser)
- ⚠️ If assigned at $42.50, own stock with effective basis of $41.70-41.90 (acceptable if fundamentals support)
Risk level: Moderate (defined risk, neutral-to-bullish bias) | Skill level: Intermediate
🚀 Aggressive: Mimic The Institutions - Diagonal Put Calendar Roll (ADVANCED!)
Play: Copy the exact institutional strategy structure with smaller size
Structure: Sell January $47.50 puts, Buy March $42.50 puts
Why this could work:
- 🎯 Mirrors the institutional trade structure: sell shorter-dated higher strike, buy longer-dated lower strike
- 💰 Collect premium from January $47.50 puts ($47.50 is 6.7% above current $44.52) to fund March protection
- 🛡️ March $42.50 puts provide extended downside protection through Q1 2026 earnings
- 📊 Targets gamma support levels ($47.50 resistance, $42.50 support)
- ⏰ Benefits from time decay on short January leg while maintaining longer-term hedge
- 🎢 Profits if stock consolidates in $44-47 range (short puts expire worthless, long puts retain value)
Why this could blow up (SERIOUS RISKS):
- ⚠️ SHORT PUTS EXPOSED: If stock rallies above $47.50 by January 16th, short puts lose money
- 💸 Complex Greeks: Negative theta on long puts, multiple vega exposures, delta changes dynamically
- 😱 Earnings volatility: Q4 earnings could gap stock in either direction, creating losses on one or both legs
- 📊 Early assignment risk: If stock drops sharply, short $47.50 puts could be assigned early (rare but possible)
- 🎢 Two-way risk: Stock rallying to $50+ loses on short leg; stock staying $44-47 sees long puts decay
- 🧠 Requires active management: Not a "set and forget" trade - need to monitor and adjust
Estimated P&L:
- 💰 Collect ~$0.50-0.70 for January $47.50 puts (depends on exact timing)
- 💸 Pay ~$1.00-1.30 for March $42.50 puts
- 📉 Net debit: $0.30-0.80 per diagonal spread
- 📈 Max profit scenario: Stock consolidates $44-46, January puts expire worthless (+$50-70), March puts retain $0.50-0.80 value = $20-50 gain per spread (30-60% ROI)
- 🚀 Jackpot scenario: Stock drops to $40-42 by mid-January, cover short puts for small loss, hold March puts as stock continues down = potential $2-3 gain per spread (200%+ ROI)
- 💀 Max loss scenario: Stock rallies to $50+, lose $2.50+ on short puts, March puts decline to $0.10 = $2.60+ loss per spread (300%+ loss on net debit)
Breakeven dynamics (complex):
- Need stock to stay below $47.50 by January expiration (short puts expire worthless)
- AND/OR stock to decline below $42.50 by March expiration (long puts gain value)
- This is a TIME SPREAD - profits from differential time decay and volatility changes
CRITICAL WARNING - DO NOT attempt unless you:
- ✅ Understand diagonal spread mechanics and Greeks (theta, vega, delta)
- ✅ Can monitor position daily and adjust if necessary
- ✅ Have experience with short put assignment scenarios
- ✅ Accept that you may need to roll the short leg if stock behavior changes
- ✅ Understand this is a HEDGE STRATEGY, not pure speculation
- ⏰ Plan to actively manage rather than holding to expiration passively
Management plan:
- 📅 January 16th: If January puts worthless, keep March puts as pure downside hedge
- 🔄 If stock rallies: Consider buying back January $47.50 puts at $0.10-0.20 to avoid assignment risk
- 📉 If stock drops: Take profits on March puts if stock breaks $40 (hedge achieved goal)
- 🎯 Optimal outcome: January leg expires worthless, roll March puts to later date if wanting to maintain protection
Position sizing: Only 1-2 diagonal spreads MAX (this is ADVANCED portfolio hedging, not speculation)
Risk level: HIGH (short puts create unlimited upside risk, complex Greeks) | Skill level: Advanced only
Probability of profit: ~45-55% (depends heavily on execution timing and stock behavior)
⚠️ Risk Factors
Don't get caught by these potential landmines:
-
⏰ Q4 earnings binary event in ~30 days: Results expected late January 2026 create MASSIVE uncertainty. The street expects $1.26 EPS, but even small misses matter at current valuation. Management commentary on FCA resolution, Stratos integration, and 2026 outlook will drive post-earnings direction. Historical precedent shows SEIC can move 8-12% on earnings surprises either way. Options pricing 6.37% implied move by tomorrow, but January earnings likely bigger catalyst.
-
🇬🇧 FCA regulatory overhang unresolved - BIGGEST RISK: UK Financial Conduct Authority restrictions imposed February 26, 2025 remain in effect with no clear timeline for resolution. SEIC cannot onboard significant new institutional clients or launch new products without FCA permission for SIEL operations. This constrains UK platform business growth indefinitely until comprehensive governance review satisfies regulators. If restrictions extended or penalties imposed, stock could drop 15-20% quickly. This is THE catalyst everyone is waiting for.
-
🤝 Stratos integration execution risk - $544M bet on the line: Stage 1 closed December 3rd bringing 350+ advisors and $38B AUA, but Stage 2 still pending. RIA roll-up deals have mixed track records - advisor retention is CRITICAL. Industry average attrition post-acquisition is 10-20% in first year. If SEIC loses >15% of advisors or integration costs blow up, the $544M investment thesis falls apart. Early Q4 earnings commentary will provide first data point. Any negative surprises here could crater stock 10-15%.
-
📉 Institutional segment structural decline - ongoing headwind: Q4 2024 showed 3% AUM decline in Institutional Investors segment from plan terminations. LSV value strategy facing redemptions amid growth style dominance. Defined benefit pension market shrinking structurally - not a temporary headwind. If Q4 2025 shows accelerating AUM declines (>5%), validates that this segment has peaked and is in terminal decline. This segment represented meaningful portion of historical revenue.
-
💰 Expense pressure threatening margin expansion: Management flagged gradual expense increases from hiring for growth initiatives, technology investments, and M&A integration costs. Q3 2025 hit record 28% operating margins, but sustainability is questioned. If Q4 shows margins compressing below 26%, concerns about operating leverage and efficiency would emerge. Bulls are counting on margin expansion story - compression would be major disappointment.
-
💸 Valuation stretched relative to history despite pullback: At current $44.52 price with $5.51-5.58 estimated 2025 EPS, SEIC trades at ~8x P/E. While cheaper than 52-week high of $93.96, this is still above historical trough valuations of 12-15x in past downturns. If multiple contracts further on negative catalysts, $35-38 range is feasible (6-7x P/E). Zero margin of safety at current levels given regulatory/integration uncertainties.
-
🐋 Smart money hedging at current levels - clear caution signal: The $5.3M diagonal put roll (813x average size!) shows sophisticated institutions are WORRIED about downside risk through January. When funds managing significant SEIC positions pay $700K net to extend protection rather than staying fully long through earnings, it's a major red flag. The timing (day before quarterly expiration) and structure (roll down from $50 to $40, increase size 2.3x) suggest elevated concern about January catalyst outcomes.
-
📊 Gamma ceiling at $45 creates mechanical resistance: Massive 1.73B call gamma at $45 (strongest overhead level) means market makers will systematically SELL into rallies to hedge their exposure. Current price at $44.52 sitting just below this ceiling creates natural cap on upside absent major positive catalyst. Every rally attempt toward $45 will face heavy selling pressure. Need significant institutional buying to overcome.
-
🎢 Tomorrow's quarterly expiration creates volatility risk: December 19th triple witch expiration with significant open interest creates pin dynamics and potential post-expiration gap moves. Low liquidity into holidays amplifies volatility potential. Could see exaggerated moves in either direction on light volume. The put buyer clearly wanted OUT of tomorrow's expiration, preferring to pay up for January exposure instead.
-
🏦 Competitive threats from better-capitalized players: Primary competitors (FIS with $58B market cap, SS&C with $20B market cap) have significantly deeper pockets for technology investments and M&A. SEIC's $10.17B market cap limits ability to compete for largest deals. Fee compression from fintech disruptors and passive investing trends pressures margins across industry. SEIC needs to execute flawlessly to maintain market position.
-
📉 Market conditions impact asset-based revenue model: ~40-50% of SEIC's revenue comes from asset-based fees on $1.6T AUA. Equity market correction of 10-15% would immediately impact revenue in following quarter. Q4 2025 market volatility may already be showing up in AUM/AUA numbers when reported in late January. If broader market enters bear market in 2026, SEIC faces 20-30% revenue headwind regardless of operational execution.
-
🌍 Geopolitical risks in UK/Europe for SIEL operations: Beyond FCA regulatory issues, UK/European operations face Brexit aftermath, regional economic weakness, and geopolitical tensions. SIEL represents meaningful portion of international revenue. Extended UK/Europe recession or financial crisis would compound FCA-related challenges. Limited ability for U.S. strength to offset European weakness given business model.
🎯 The Bottom Line
Real talk: Someone just spent $700K NET (after collecting $2.3M from closing December $50 puts) to buy 11,000 contracts of January $40 put protection on SEIC - a 2.3x SIZE INCREASE over their expiring position. This isn't bearish on SEIC's long-term story (strong fundamentals: 28% operating margins, record $106.3M net sales events through 9 months, $1.6T AUA, shareholder-friendly capital allocation). This is smart risk management by institutions who see significant binary risk through late January Q4 earnings and FCA resolution uncertainty.
What this diagonal roll tells us:
- 🎯 Sophisticated player expects VOLATILITY through January (not crash, but hedging against 10-15% downside scenario)
- 💰 They're worried enough about $44→$40 move to pay net $0.64/share for insurance despite profiting on expiring December puts
- ⚖️ The urgency (rolling day before quarterly expiration) shows they DON'T want exposure to tomorrow's triple witch dynamics
- 📊 Striking at $40 - exactly where 3.26B put gamma sits (highest on chart) - expects IF stock breaks $42.50 support, cascade to $40 likely
- ⏰ January 16th expiration captures Q4 earnings (late Jan), FCA potential updates, Stratos early feedback, year-end AUM/AUA marks
This is NOT a "sell everything and run" signal - it's a "manage risk intelligently into uncertain catalysts" signal.
If you own SEIC:
- ✅ Consider trimming 25-30% at $44-45 levels if you have large gains (de-risk ahead of earnings binary event)
- 📊 If holding through earnings, set MENTAL STOP at $42.50 (gamma support) to protect against breakdown
- 🎯 Current risk/reward UNFAVORABLE - stock needs MULTIPLE positive catalysts (FCA resolution + strong earnings + Stratos success) to break $45 resistance, but only ONE negative catalyst (any of those disappointing) to test $40 floor
- 🛡️ Consider buying 1-2 protective puts per 100 shares if holding concentrated position (copy this trade's structure at smaller size)
- ⏰ After Q4 earnings clarity, re-evaluate - if FCA resolved positively and margins sustain, $50-55 becomes achievable
If you're watching from sidelines:
- ⏰ Late January 2026 is the moment of truth - DO NOT enter before Q4 earnings removes uncertainty!
- 🎯 Post-earnings pullback to $38-40 would be EXCELLENT long-term entry (15-20% below current with gamma support and resolved catalysts)
- 📈 Looking for confirmation of: FCA resolution timeline, Stratos advisor retention >90%, operating margins 28%+, net sales events $30M+ in Q4
- 🚀 Longer-term (12-18 months), LifeYield integration, Stage 2 Stratos completion, and SEI Access marketplace expansion are legitimate catalysts for $55-65 IF execution delivers
- ⚠️ Current setup offers POOR risk/reward for new longs - multiple binary risks with limited upside until catalysts resolve
If you're bearish:
- 🎯 Wait for post-Q4 earnings clarity before initiating shorts - trading costs/borrow rates make this inefficient
- 📊 Better approach: Post-earnings bull put spreads ($42.50/$40) offer defined-risk way to profit from consolidation after IV crush
- ⚠️ Watch for break below $42.50 support - that's the trigger for potential cascade to $40, then $37.50
- 📉 Bearish case requires: earnings miss + negative FCA update + Stratos issues (need multiple catalysts)
- ⏰ Timing is EVERYTHING: Premature bearish positioning risks short squeeze if FCA resolves positively; post-earnings offers clarity
Mark your calendar - Key dates:
- 📅 December 19, 2025 (TOMORROW) - Quarterly triple witch expiration (volatility event!)
- 📅 December 20 - January 2 - Holiday trading period (thin liquidity, exaggerated moves possible)
- 📅 Late January 2026 - Q4 FY2025 earnings report (THE CATALYST - likely Jan 22-29 window)
- 📅 January 16, 2026 - Monthly OPEX, expiration of this $5.3M diagonal put trade
- 📅 Q1 2026 - Stage 2 Stratos closing expected (Mexico-based NSC business for ~$103M)
- 📅 H1 2026 - LifeYield full integration and UMH capabilities launch
- 📅 2026 TBD - FCA regulatory resolution (no clear timeline - ongoing uncertainty)
Final verdict: SEIC's long-term fundamentals remain solid - record net sales momentum ($106.3M through 9 months), industry-leading 28% operating margins, strategic positioning in wealth management technology megatrend, and shareholder-friendly capital allocation ($556M buyback capacity at 6.1% of market cap). The $544M Stratos acquisition and LifeYield integration provide genuine growth catalysts IF executed well.
BUT, the FCA regulatory overhang remains the elephant in the room - unresolved since February 2025 with no clear timeline. Combined with Q4 earnings binary risk, Stratos integration uncertainty, and institutional segment weakness, the near-term (next 30 days) risk/reward is UNFAVORABLE for new positioning.
The $5.3M institutional diagonal put roll is a CLEAR signal: smart money is de-risking into January catalysts, not adding exposure.
Be patient. Let Q4 earnings and FCA situation clarify. The wealth management technology opportunity will still be here in 2-3 months, and you'll sleep better buying SEIC at $38-40 with resolved catalysts instead of $44-45 with maximum uncertainty.
This is about capital preservation and asymmetric risk/reward. Protect your capital. 💪
Disclaimer: Options trading involves substantial risk of loss and is not suitable for all investors. This analysis is for educational purposes only and not financial advice. Past performance doesn't guarantee future results. The 812.88x unusual score reflects this specific trade's size relative to recent SEIC history - it does not imply the trade will be profitable or that you should follow it. Always do your own research and consider consulting a licensed financial advisor before trading. Q4 earnings create binary event risk with potential for 8-12% gaps either direction. The put buyer may have complex portfolio hedging needs not applicable to retail traders. Diagonal spreads involve short option positions which carry significant risk including potential for unlimited losses.
About SEI Investments Company: SEI Investments Company provides investment processing, management, and operations services to financial institutions, asset managers, asset owners, and financial advisors across four business segments: Private Banks, Investment Advisors, Institutional Investors, and Investment Managers, with a market cap of $10.17 billion in the Financial Services industry managing/administering/advising approximately $1.6 trillion in assets.