🚀 SMCI Bull Call Spread - $4.1M AI Server Bet! 💰
📅 October 21, 2025 | 🔥 Unusual Activity Detected
🎯 The Quick Take
Someone just dropped $4.1M on a Super Micro Computer bull call spread betting the AI server maker climbs to $65-80 by June 2026! This sophisticated play collects maximum profit if SMCI surges 19-47% from current levels. With earnings in 20 days and the Nvidia Blackwell ramp accelerating, this trader is positioning for a recovery rally. Translation: Smart money sees a bottom forming here!
📊 Company Overview
Super Micro Computer, Inc. (SMCI) is a high-performance AI server technology provider with:
- Market Cap: $32.7 Billion
- Industry: Electronic Computers
- Primary Business: AI server systems, direct liquid cooling technology, and rack-scale data center solutions
- Key Customers: Major hyperscalers, cloud providers, enterprise AI deployments
Super Micro specializes in turnkey AI datacenter solutions, with over 70% of Q4 FY2025 revenue coming from AI platform systems featuring the latest Nvidia, AMD, and Intel GPU technologies.
💰 The Option Flow Breakdown
The Tape (October 21, 2025 @ 13:19:31):
| Time | Symbol | Side | Buy/Sell | Type | Expiration | Premium | Strike | Volume | OI | Size | Spot Price | Option Price |
|---|---|---|---|---|---|---|---|---|---|---|---|---|
| 13:19:31 | SMCI | ASK | BUY | CALL | 2026-06-18 | $2.9M | $65 | 3.4K | 1.8K | 3,000 | $54.16 | $9.70 |
| 13:19:31 | SMCI | BID | SELL | CALL | 2026-06-18 | $1.9M | $80 | 3K | 2.4K | 3,000 | $54.16 | $6.25 |
Net Debit: $3.45 per contract = $1.035M total invested ($9.70 - $6.25 = $3.45 × 3,000 contracts × 100)
🤓 What This Actually Means
This is a bull call spread - a way to bet on upside while limiting both risk and reward! The trader:
- Pays $2.9M to buy the right to own SMCI at $65 calls
- Collects $1.9M by selling $80 calls to cap upside
- Profits if SMCI rises above $68.45 by June 2026 expiration
- Maximum profit of $3.465M if SMCI closes above $80 (335% return!)
- Maximum loss of $1.035M if SMCI stays below $65
Trade Metrics:
- Breakeven: $68.45 (26.4% above current price)
- Days to Expiration: 240 days (8 months)
- Return on Risk: 335% if maximum profit achieved
- Size: 3,000 contracts representing 300,000 shares of exposure
Unusual Score: Moderately unusual - This 3,000 contract spread is significantly larger than typical retail positioning. While not unprecedented, this represents institutional-level conviction in SMCI's recovery potential.
📈 Technical Setup / Chart Analysis
YTD Performance Chart
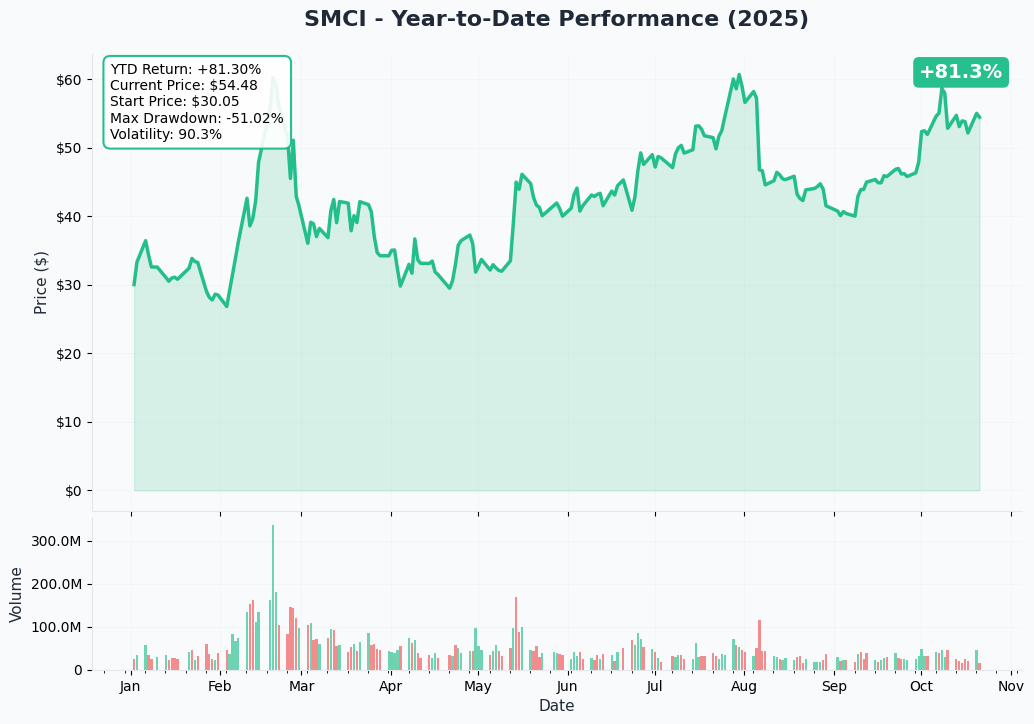
Super Micro Computer has been on a wild ride in 2025 with +81.3% YTD performance, but the path has been anything but smooth. The stock started the year at $30.05 and surged to highs near $62 before recent consolidation.
Key observations:
- Extreme volatility: 90.3% implied volatility signals massive uncertainty
- Maximum drawdown: -51.02% from peak shows significant risk
- Current price: $54.48 consolidating after August highs
- Volume spikes: Heightened institutional interest around earnings and product launches
- Recovery pattern: Stock finding support after resolving accounting issues
The chart shows three distinct phases: early consolidation ($30-35), explosive breakout to $62, and current digestion phase around $54. This suggests a potential re-accumulation period before the next move.
Gamma-Based Support & Resistance Analysis
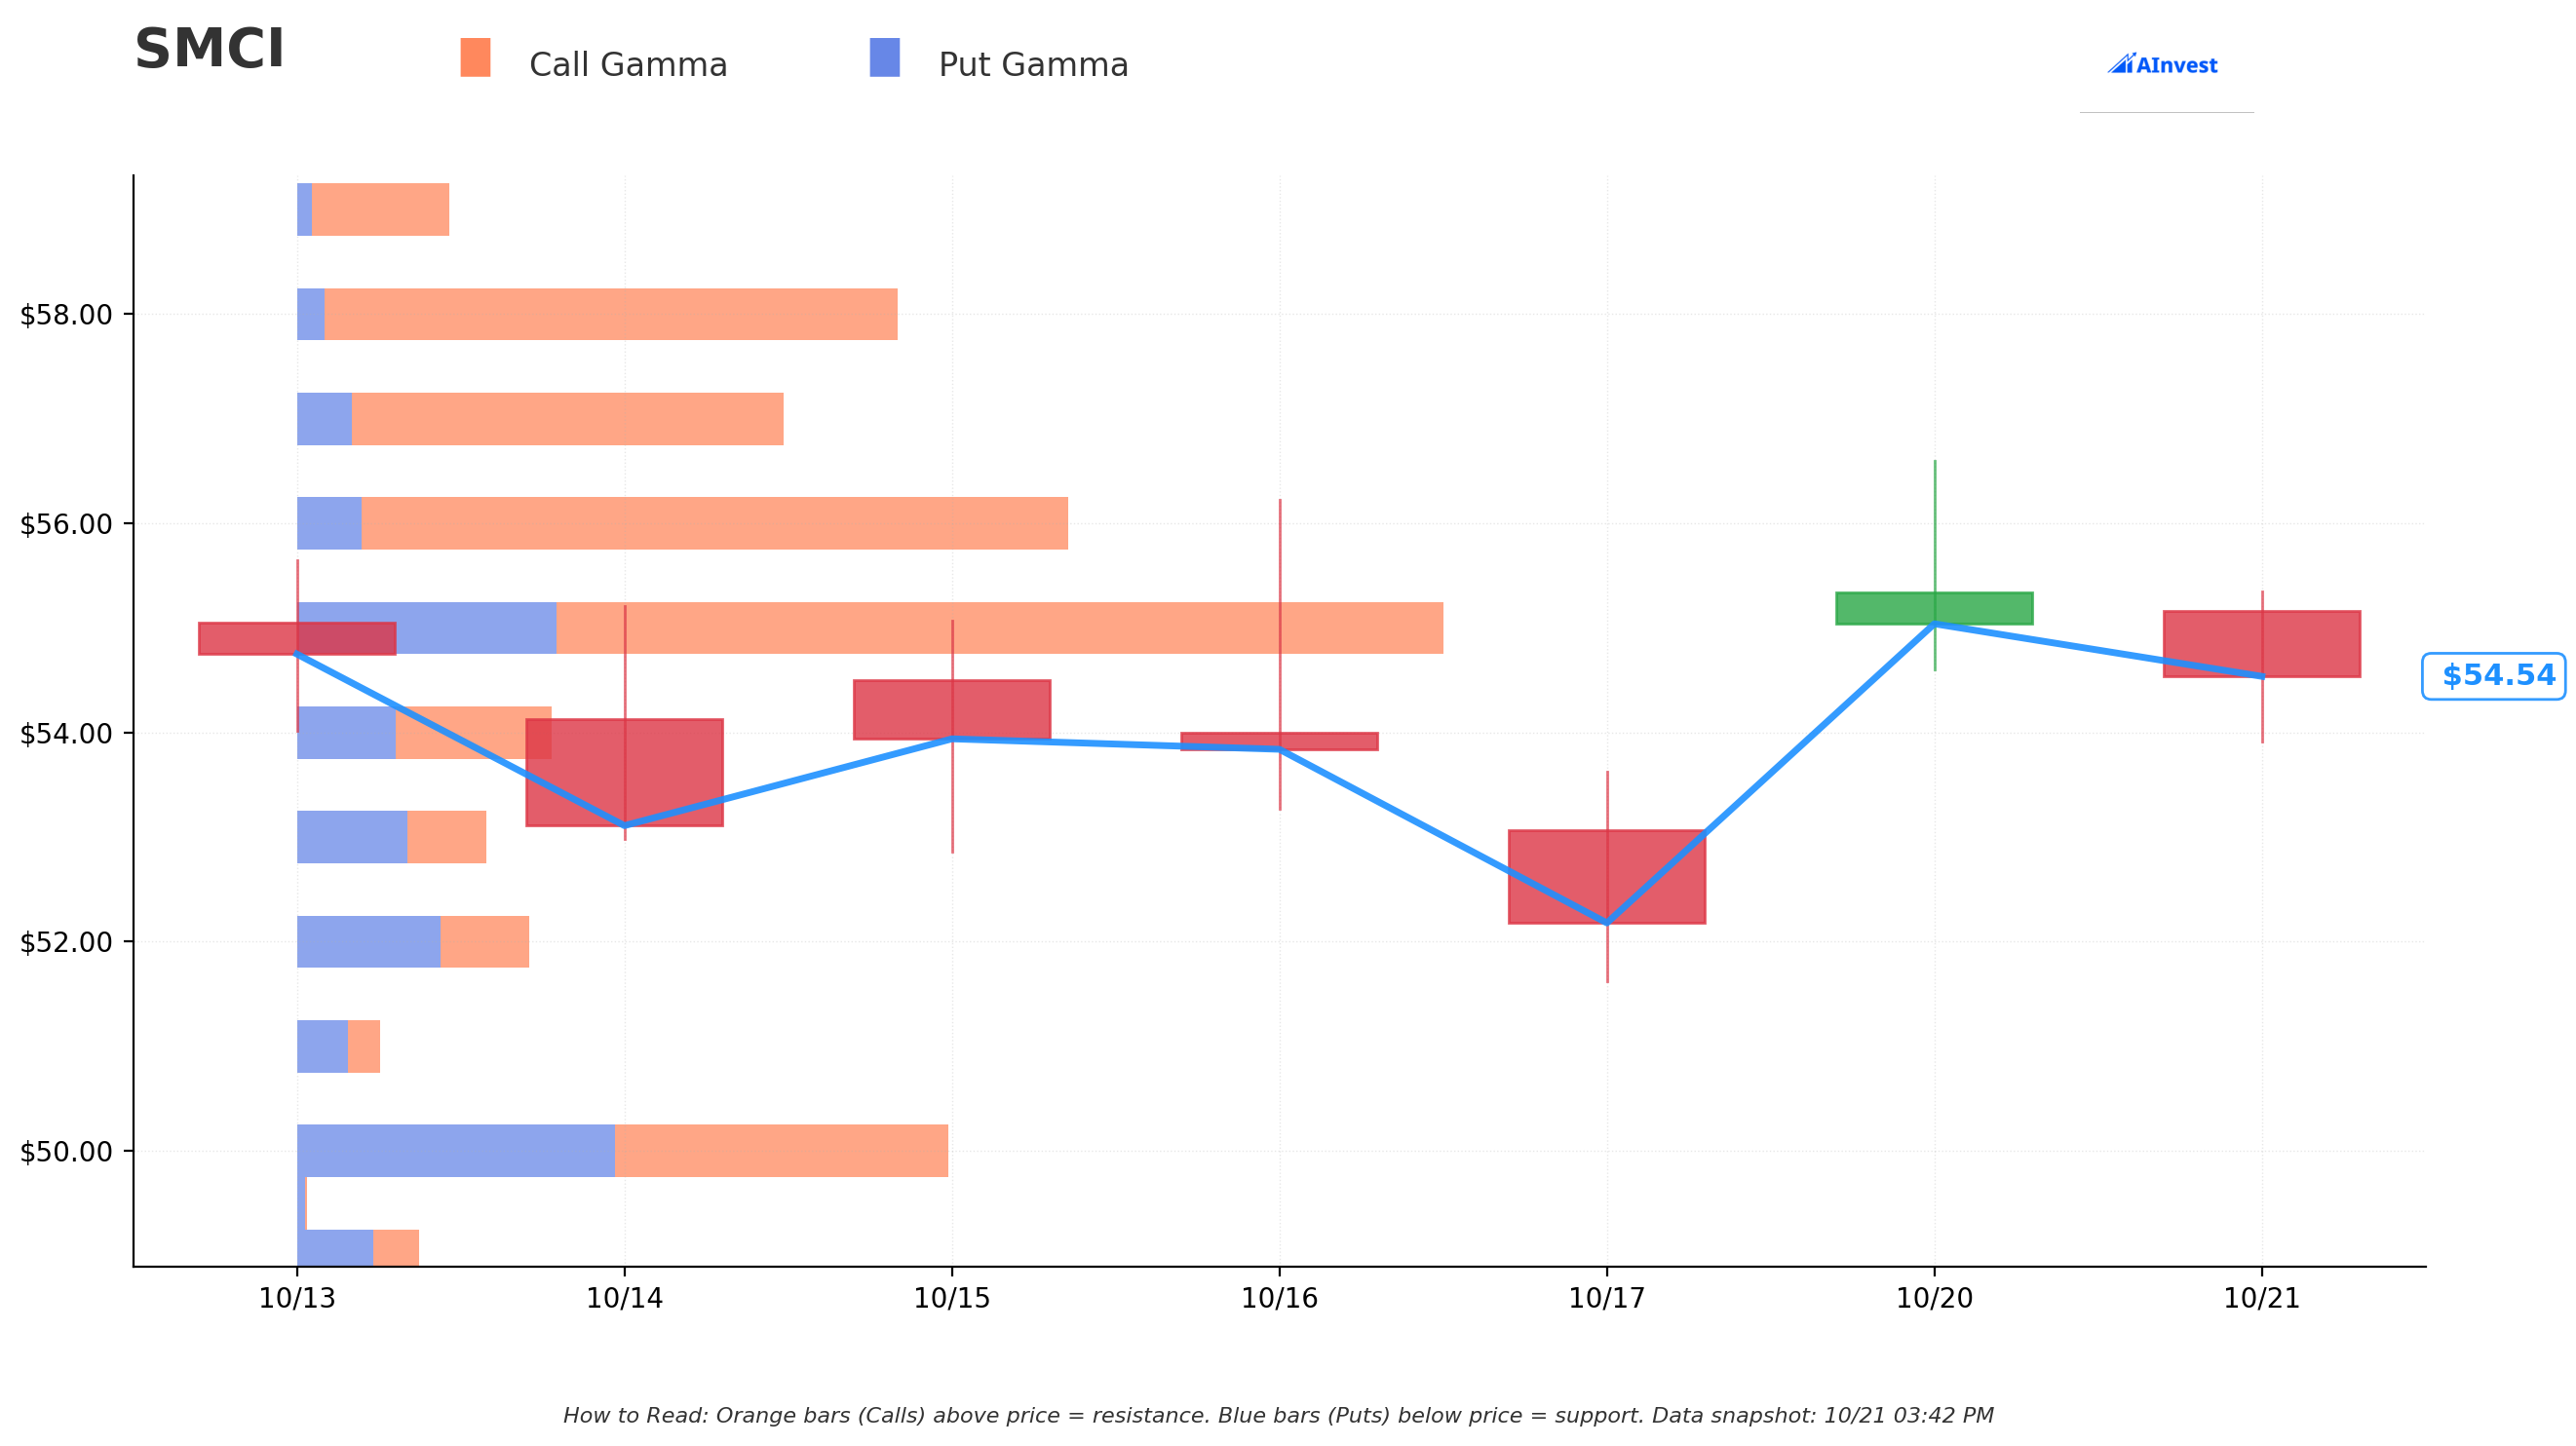
Current Price: $54.54
The gamma chart reveals critical levels that perfectly align with this bull call spread strategy:
Immediate Resistance Levels (Call Gamma):
- $55 strike: Strongest nearby resistance with 16.53M in call gamma - massive dealer selling pressure just above
- $56 strike: Secondary wall at 13.18M call gamma, 2.7% above current price
- $58 strike: Another significant level with 10.69M call gamma
- $60 strike: Major psychological level with 16.71M call gamma acting as ceiling
Support Levels (Put Gamma):
- $54 strike: Immediate support with balanced gamma (1.07M net positive)
- $52 strike: First meaningful floor with 2.68M put gamma
- $50 strike: Strong support zone with 5.93M put gamma providing downside cushion
- $45 strike: Major backstop level with 2.93M put gamma
Gamma Analysis:
- Total Call Gamma: 138.18M vs Total Put Gamma: 53.19M
- Net GEX Bias: Strongly bullish - market makers positioned for upside
- Strongest Resistance: $55 (just 0.9% above current price)
- Strongest Support: $54 (current price level)
This gamma setup suggests the stock is coiling at a critical inflection point. The heavy call gamma wall at $55-60 explains why a breakout would need significant buying pressure, but once cleared, the path to $65+ becomes clearer.
🎪 Catalysts
Upcoming Events
Q1 FY2026 Earnings - November 10, 2025
SMCI reports earnings after market close on November 10, 2025 in just 20 days, representing the first full quarter following resolution of accounting issues and auditor changes.
Consensus Expectations:
- Revenue: $6.0-7.0B (company guidance) - representing strong sequential growth
- EPS: $0.46 (analyst consensus) vs $0.40-0.52 range
- Key Focus Areas: Delivery targets for AI servers and gross margin trends
This earnings report is critical - it's the first major test of operational execution following months of uncertainty. Wall Street will be watching delivery numbers closely.
Nvidia Blackwell GPU Ramp (Q1-Q2 2026)
The Nvidia Blackwell platform represents SMCI's most significant growth driver with the company shipping:
Industry estimates project 25,000-35,000 NVL72 racks will ship in 2025, equating to 2.52M GPUs. SMCI has partnerships with Lambda, Microsoft, Meta, and Oracle for these systems.
Data Center Building Block Solutions (DCBBS) Revenue Acceleration
The newly launched DCBBS offering is generating $6-7B in Q1 FY2026 revenue expectations. DCBBS provides:
- Plug-and-play modular data center infrastructure
- Reduced deployment time from 12-18 months to 3-6 months
- Integration with Hitachi Vantara for enterprise AI workloads
Management expects DCBBS to become a major revenue pillar supporting the $33B FY2026 revenue target.
Liquid Cooling Technology Leadership
SMCI achieved 2,000+ DLC racks per month production in Q3 FY2025. With Blackwell's higher power requirements necessitating liquid cooling, SMCI's DLC-2 technology positions it ahead of competitors. The market is projected to see 30%+ of new data centers adopt liquid cooling within the next year.
Analyst Rating Upgrades & Institutional Positioning
Recent analyst activity shows growing institutional confidence:
- Needham upgraded to Buy with $60 target (10% upside from current levels)
- Wedbush maintains Buy rating citing innovative data center solutions
- Forward P/E of 20.37 and PEG ratio of 0.375 suggests undervaluation relative to growth
- Consensus: HOLD (6 Buy, 13 Hold, 3 Sell) with average price target range of $15 to $70
- #1 in AI server growth rate though Dell leads in overall server market share
Recently Completed
Resolution of Accounting Issues - February 2025
After months of uncertainty that weighed heavily on the stock, SMCI successfully:
- Filed all delinquent financial reports in February 2025
- Replaced auditor EY with BDO following EY's resignation
- Resolved Nasdaq delisting concerns
- Cooperating with DOJ and SEC investigations (subpoenas issued late 2024)
An internal investigation found "no evidence of misconduct" by management, and the company stated no restatements of prior financials are required.
FY2026 Revenue Guidance: $33B+
Management projects at least $33B in FY2026 revenue, representing 45%+ YoY growth. This aggressive target assumes:
- Continued hyperscaler AI infrastructure spending
- Successful GB200/B200 server ramps
- DCBBS market adoption
- Global manufacturing expansion (Taiwan, Netherlands, Mexico, Silicon Valley)
🎲 Price Targets & Probabilities
Using gamma levels, catalyst timing, and technical setup:
🚀 Bull Case (35% chance)
Target: $75-85 by June 2026
What needs to happen:
- Strong Q1 & Q2 earnings beats on Blackwell server volumes
- Gross margins stabilize or improve from current 9.6% levels
- DCBBS revenue contribution exceeds $15B annually
- DOJ/SEC investigations conclude favorably
- Blackwell supply constraints ease allowing full production
Gamma dynamics: Breaking above $60 resistance opens path to $65+ with reduced selling pressure
This spread profits big: Maximum $3.465M profit achieved in this scenario (335% return)
😐 Base Case (45% chance)
Target: $60-75 range
Most likely scenario:
- Mixed earnings with revenue beats but margin pressure continues
- Blackwell ramp proceeds but slower than hoped
- Competition from Dell/HPE remains intense
- Stock consolidates between key gamma levels at $55-65
- Regulatory overhang persists but no adverse findings
Gamma dynamics: Chop between $55 resistance and $65 breakthrough level
This spread outcome: Moderate profits of $1M-2.5M depending on final price
😰 Bear Case (20% chance)
Target: $45-55
Risk factors:
- Earnings miss on delivery numbers or margin compression deepens
- Blackwell delays or supply issues hurt revenue
- Adverse DOJ/SEC findings or financial restatements required
- Hyperscaler spending slowdown impacts orders
- Dell and HPE win market share with better margins
Gamma dynamics: Falls back to $50-52 support zone with put gamma providing floor
This spread outcome: Full loss of $1.035M premium paid
💡 Trading Ideas
🛡️ Conservative: Mini Bull Spread
Play: Smaller bull call spread (June 2026 expiration)
Buy 10x $60 calls, sell 10x $70 calls
Risk: ~$3,000-4,000 per 10 contracts Reward: $10,000 max profit if above $70
Why this works: Defined risk structure limits downside while maintaining upside exposure to recovery. Breakeven around $63-64 is achievable if earnings are solid.
⚖️ Balanced: Earnings Straddle into Spread
Play: Buy Nov 15th $55 straddle, convert winner to spread
Phase 1: Buy straddle before Nov 10 earnings Phase 2: After earnings, convert winning side to spread for June expiration
Risk: Premium paid for straddle (~$12-15 with 90% IV) Reward: Capture volatility crush then ride trend
Why this works: Earnings will likely cause 15-20% move either direction with 90% IV. Capture initial move, then position for follow-through.
🚀 Aggressive: Replicate the Whale
Play: Bull call spread matching the detected trade
Buy $65 calls, sell $80 calls (June 2026)
Risk: $3.45 per spread × contracts Reward: Up to $11.55 per spread if above $80
Why this works: If you share the conviction that SMCI rebounds to $65-80 over next 8 months, this is the exact play. Maximum 335% return with defined risk.
⚠️ Risk Factors
Margin Pressure Continues
- Gross margins compressed to 9.6% in Q4 FY2025, down from 13.9% in FY2024
- Intense competition from Dell and HPE which have higher profitability
- Race to bottom on pricing for AI server contracts
Regulatory Overhang
- Ongoing DOJ and SEC investigations create uncertainty
- Accounting issues damaged credibility even if resolved
- Any adverse findings could tank the stock
Execution Risk
- GB200 supply constraints and potential delays
- Manufacturing ramp-up challenges across global facilities
- Customer concentration risk with major hyperscalers
Competitive Threats
- Dell leads in overall server market share with better margins
- HPE aggressively pursuing AI infrastructure deals
- White-box competitors undercutting on price
Volatility Crush
- Current 90.3% IV is extremely elevated
- Options premium will decay rapidly if stock consolidates
- Theta burn accelerates as expiration approaches
🎯 The Bottom Line
Real talk: This $4.1M bull call spread tells us institutional money sees a recovery play in Super Micro Computer over the next 8 months. The trade structure is sophisticated - betting on a measured recovery to $65-80 rather than a moonshot back to all-time highs.
If you own SMCI: The $55-60 resistance zone is critical. A breakout above with volume confirms the recovery thesis. Consider holding through earnings if you believe in the AI infrastructure story.
If you're watching: November 10th earnings will be the immediate catalyst. Look for:
- Revenue guidance and Blackwell shipment numbers
- Gross margin trends (improvement = bullish)
- DCBBS traction with customers
- Management commentary on competitive positioning
If you're bullish: The gamma data shows heavy resistance at $55-60, but once cleared, the path to $65+ opens up. The June 2026 timeframe gives multiple earnings catalysts and the Blackwell ramp to play out.
Mark your calendar:
- November 10, 2025 - Q1 FY2026 Earnings (critical test)
- February 2026 - Q2 FY2026 Earnings (Blackwell ramp should be visible)
- June 18, 2026 - Option expiration
This spread is a bet that SMCI's accounting troubles are behind them and the AI server opportunity ahead is massive. The risk/reward at 335% max return for a 26.4% breakeven move over 8 months is compelling if you share that conviction!
Disclaimer: Options trading involves substantial risk of loss. This analysis is for educational purposes only and not financial advice. The options positions discussed involve significant risk including total loss of premium paid. Past performance doesn't guarantee future results. Always conduct your own research and consider consulting a financial advisor.
About Super Micro Computer: Super Micro Computer Inc provides high-performance server technology services to cloud computing, data centers, high-performance computing, and the Internet of Things embedded markets. The company specializes in turnkey AI datacenter solutions with a $32.7B market cap in the electronic computers sector.