🛡️ SOFI $1.9M Bearish Bet - Smart Money Loads Puts Ahead of Q1 Earnings!
📅 February 17, 2026 | 🔥 Unusual Activity Detected
🎯 The Quick Take
Someone just dropped $1.9 MILLION on SOFI puts this morning at 10:22:11! This institutional-sized trade bought 8,750 contracts of $19 strike puts expiring May 15th - a clear directional bearish bet on the fintech darling that's pulled back 41% from January highs. With SOFI trading at $19.28 after the post-earnings correction and Q1 results expected around May 4th, smart money is positioning for more downside. Translation: Institutions see SOFI's recent pullback as just the beginning, not a buying opportunity!
📊 Company Overview
SoFi Technologies (SOFI) is a San Francisco-based digital financial services powerhouse that's evolved from a student loan refinancer into a full-stack fintech platform:
- Market Cap: $24.78 Billion
- Industry: Finance Services (digital banking, lending, investing)
- Employees: 5,000
- Current Price: $19.28 (down 41% from January 2026 highs of $32.73)
- Primary Business: Personal loans, student loans, mortgages, banking (checking/savings), investing (brokerage, crypto), and B2B fintech infrastructure (Galileo, Technisys)
- Members: 13.7 million with 20.2 million products as of Q4 2025
SoFi operates exclusively through digital channels - its mobile app and website - positioning itself as a "one-stop shop" for consumer finances. The 2020 Galileo acquisition added payment infrastructure capabilities that now power other fintechs and banks.
💰 The Option Flow Breakdown
The Tape (February 17, 2026 @ 10:22:11):
| Time | Symbol | Side | Buy/Sell | Type | Expiration | Premium | Strike | Volume | OI | Size | Spot | Option Price |
|---|---|---|---|---|---|---|---|---|---|---|---|---|
| 10:22:11 | SOFI | ASK | BUY | PUT $19 | 2026-05-15 | $1.9M | $19 | 8.8K | 1.9K | 8,750 | $19.28 | $2.22 |
🤓 What This Actually Means
This is a directional bearish bet - NOT a hedge! Here's what went down:
- 💸 Hefty premium paid: $1.9M ($2.22 per contract × 8,750 contracts)
- 🎯 Strike at the money: $19 puts with stock at $19.28 - looking for breakdown
- 📊 Massive size vs OI: 8,750 contracts vs only 1,900 open interest - 4.6x the existing position!
- ⏰ Strategic timing: 87 days to expiration captures Q1 2026 earnings (expected May 4th) and any S&P 500 inclusion news
- 🐻 Classification: BTO (Buy to Open) - Long Put position, outright bearish
- 🔥 Z-Score: 43.47 - EXTREMELY UNUSUAL activity
What's really happening here:
Unlike protective hedges where institutions own stock and buy puts for insurance, this trade screams DIRECTIONAL BEAR. The Volume/OI ratio of 4.6x means this is fresh positioning, not rolling existing positions. Someone with serious conviction is betting SOFI breaks below $19 by mid-May.
The timing is critical - Q1 2026 earnings expected around May 4th will be the make-or-break moment. After management's aggressive 2026 guidance (30% revenue growth, $0.60 EPS), any miss or even soft guidance would justify this bearish positioning.
Unusual Score Analysis: A Z-score of 43.47 means this trade is roughly 43 standard deviations above average activity - we're talking about something that happens maybe a few times a year. This isn't your neighbor Bob's Robinhood account - this is institutional money making a calculated bearish bet at a critical technical juncture.
📈 Technical Setup / Chart Check-Up
YTD Performance Chart
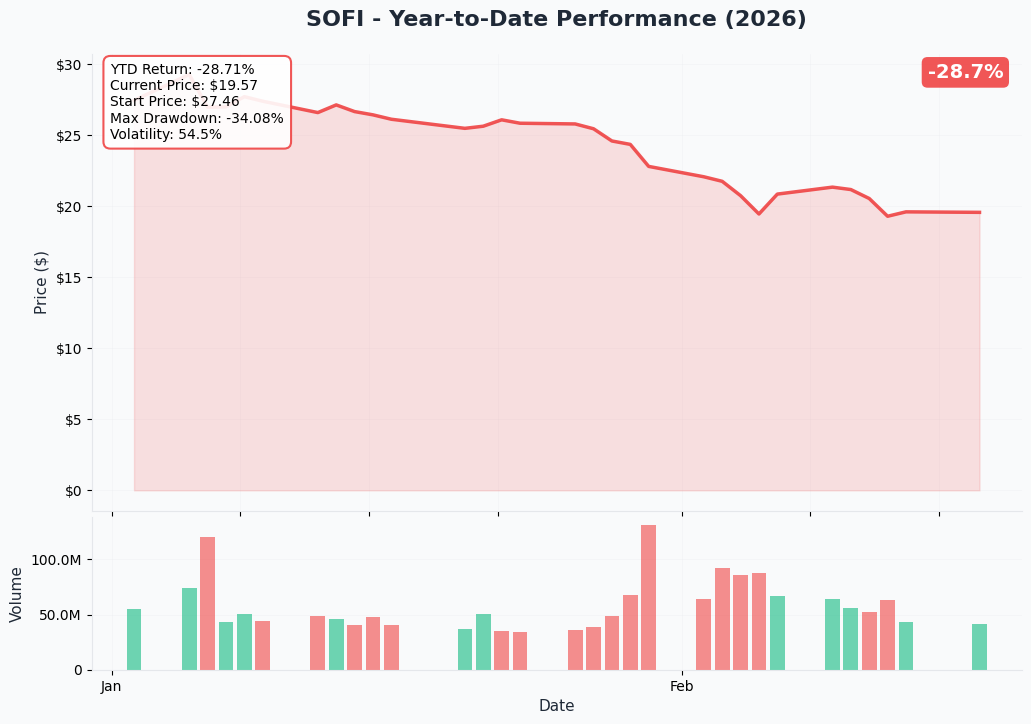
SOFI has been through the wringer in 2026 - down -19.1% YTD after an incredible +92% rally in 2025. The stock touched highs of $32.73 in January before the wheels came off. Here's what the chart tells us:
Key observations:
- 📉 Brutal pullback: Down 41% from $32.73 highs to ~$19.28 in just 6 weeks
- 🔻 Broken support: Smashed through $27.16 support with negative double-top signal
- 📊 Oversold but trending down: RSI at 29.8 (oversold territory) but downtrend firmly established
- ⚠️ ADX at 31.7: Confirms established downtrend with momentum
- 💔 Below all moving averages: Trading under 50-day MA ($21.85) and 200-day MA ($25.42)
The December 2025 capital raise ($1.5B at $27.50/share) created dilution concerns, and the post-Q4 earnings rally faded quickly. Current price action suggests the "buy the dip" crowd has been overwhelmed by selling pressure.
🔵🟠 Gamma-Based Support & Resistance Analysis
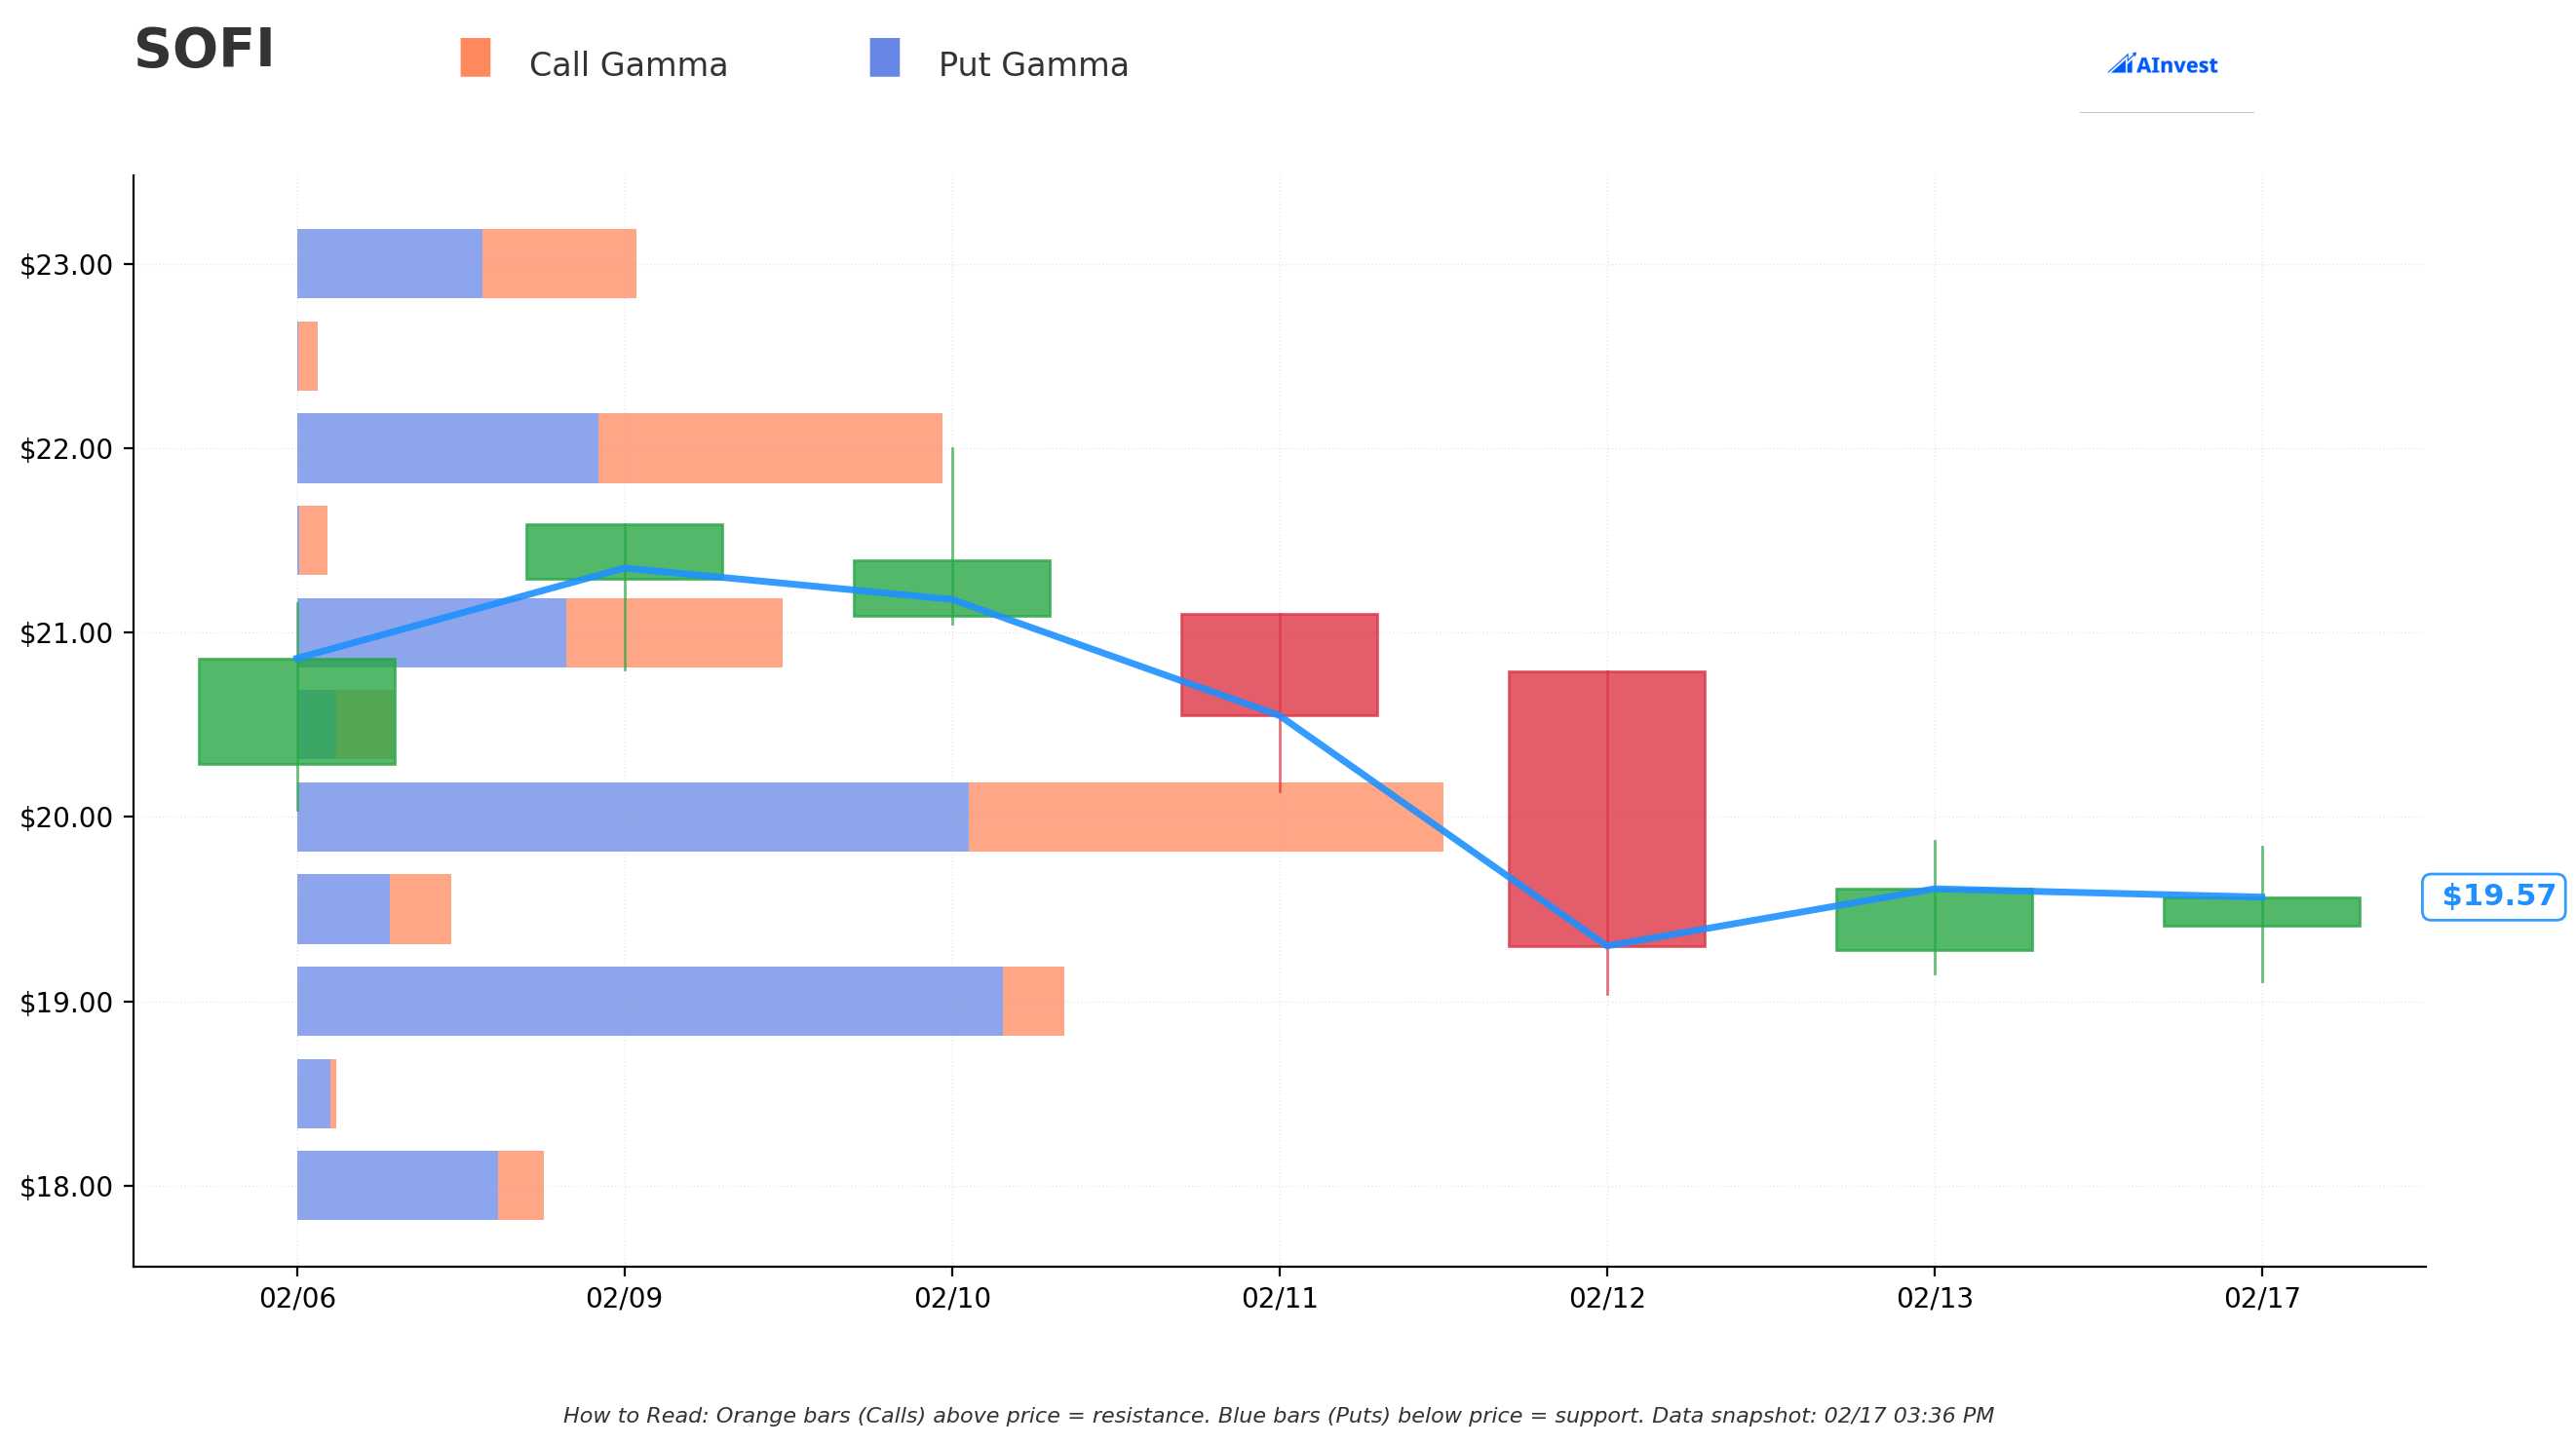
Current Price: $19.55
The gamma exposure map reveals critical price magnets and barriers that will govern near-term price action:
🔵 Support Levels (Put Gamma Below Price):
- $19.50 - Immediate support with 6.3B total gamma (0.2% below current - BARELY holding!)
- $19.00 - MAJOR structural floor with 31.6B gamma (2.8% below - THIS IS THE LINE IN THE SAND and exactly where the put is struck!)
- $18.50 - Secondary support at 1.6B gamma (5.3% below)
- $18.00 - Deep support at 10.3B gamma (7.9% below)
- $17.00 - Extended floor at 9.1B gamma (13% below - disaster scenario)
🟠 Resistance Levels (Call Gamma Above Price):
- $20.00 - Immediate ceiling with 47.3B gamma (STRONGEST LEVEL - 2.3% overhead)
- $20.50 - Secondary resistance at 4.0B gamma (4.9% above)
- $21.00 - Major ceiling at 19.7B gamma (7.4% above)
- $22.00 - Extended resistance at 27.7B gamma (12.6% above)
- $23.00 - Outer resistance at 16.7B gamma (17.7% above)
What this means for traders:
SOFI is trading in a DANGER ZONE between $19.50 immediate support and crushing $20 resistance. The put buyer struck EXACTLY at $19 where massive 31.6B gamma support sits - they're betting that if SOFI loses $19.50, it accelerates quickly to test $19 and potentially breaks through to $18.
Notice anything? The net GEX bias is BEARISH (148.2B put gamma vs 143.0B call gamma). This aligns perfectly with the directional put purchase - market maker positioning confirms the bearish tilt.
The $20 level with 47.3B gamma (single largest level on the chart) creates a ceiling that SOFI needs significant buying pressure to overcome. Without a positive catalyst, the path of least resistance appears lower.
📊 Implied Move Analysis
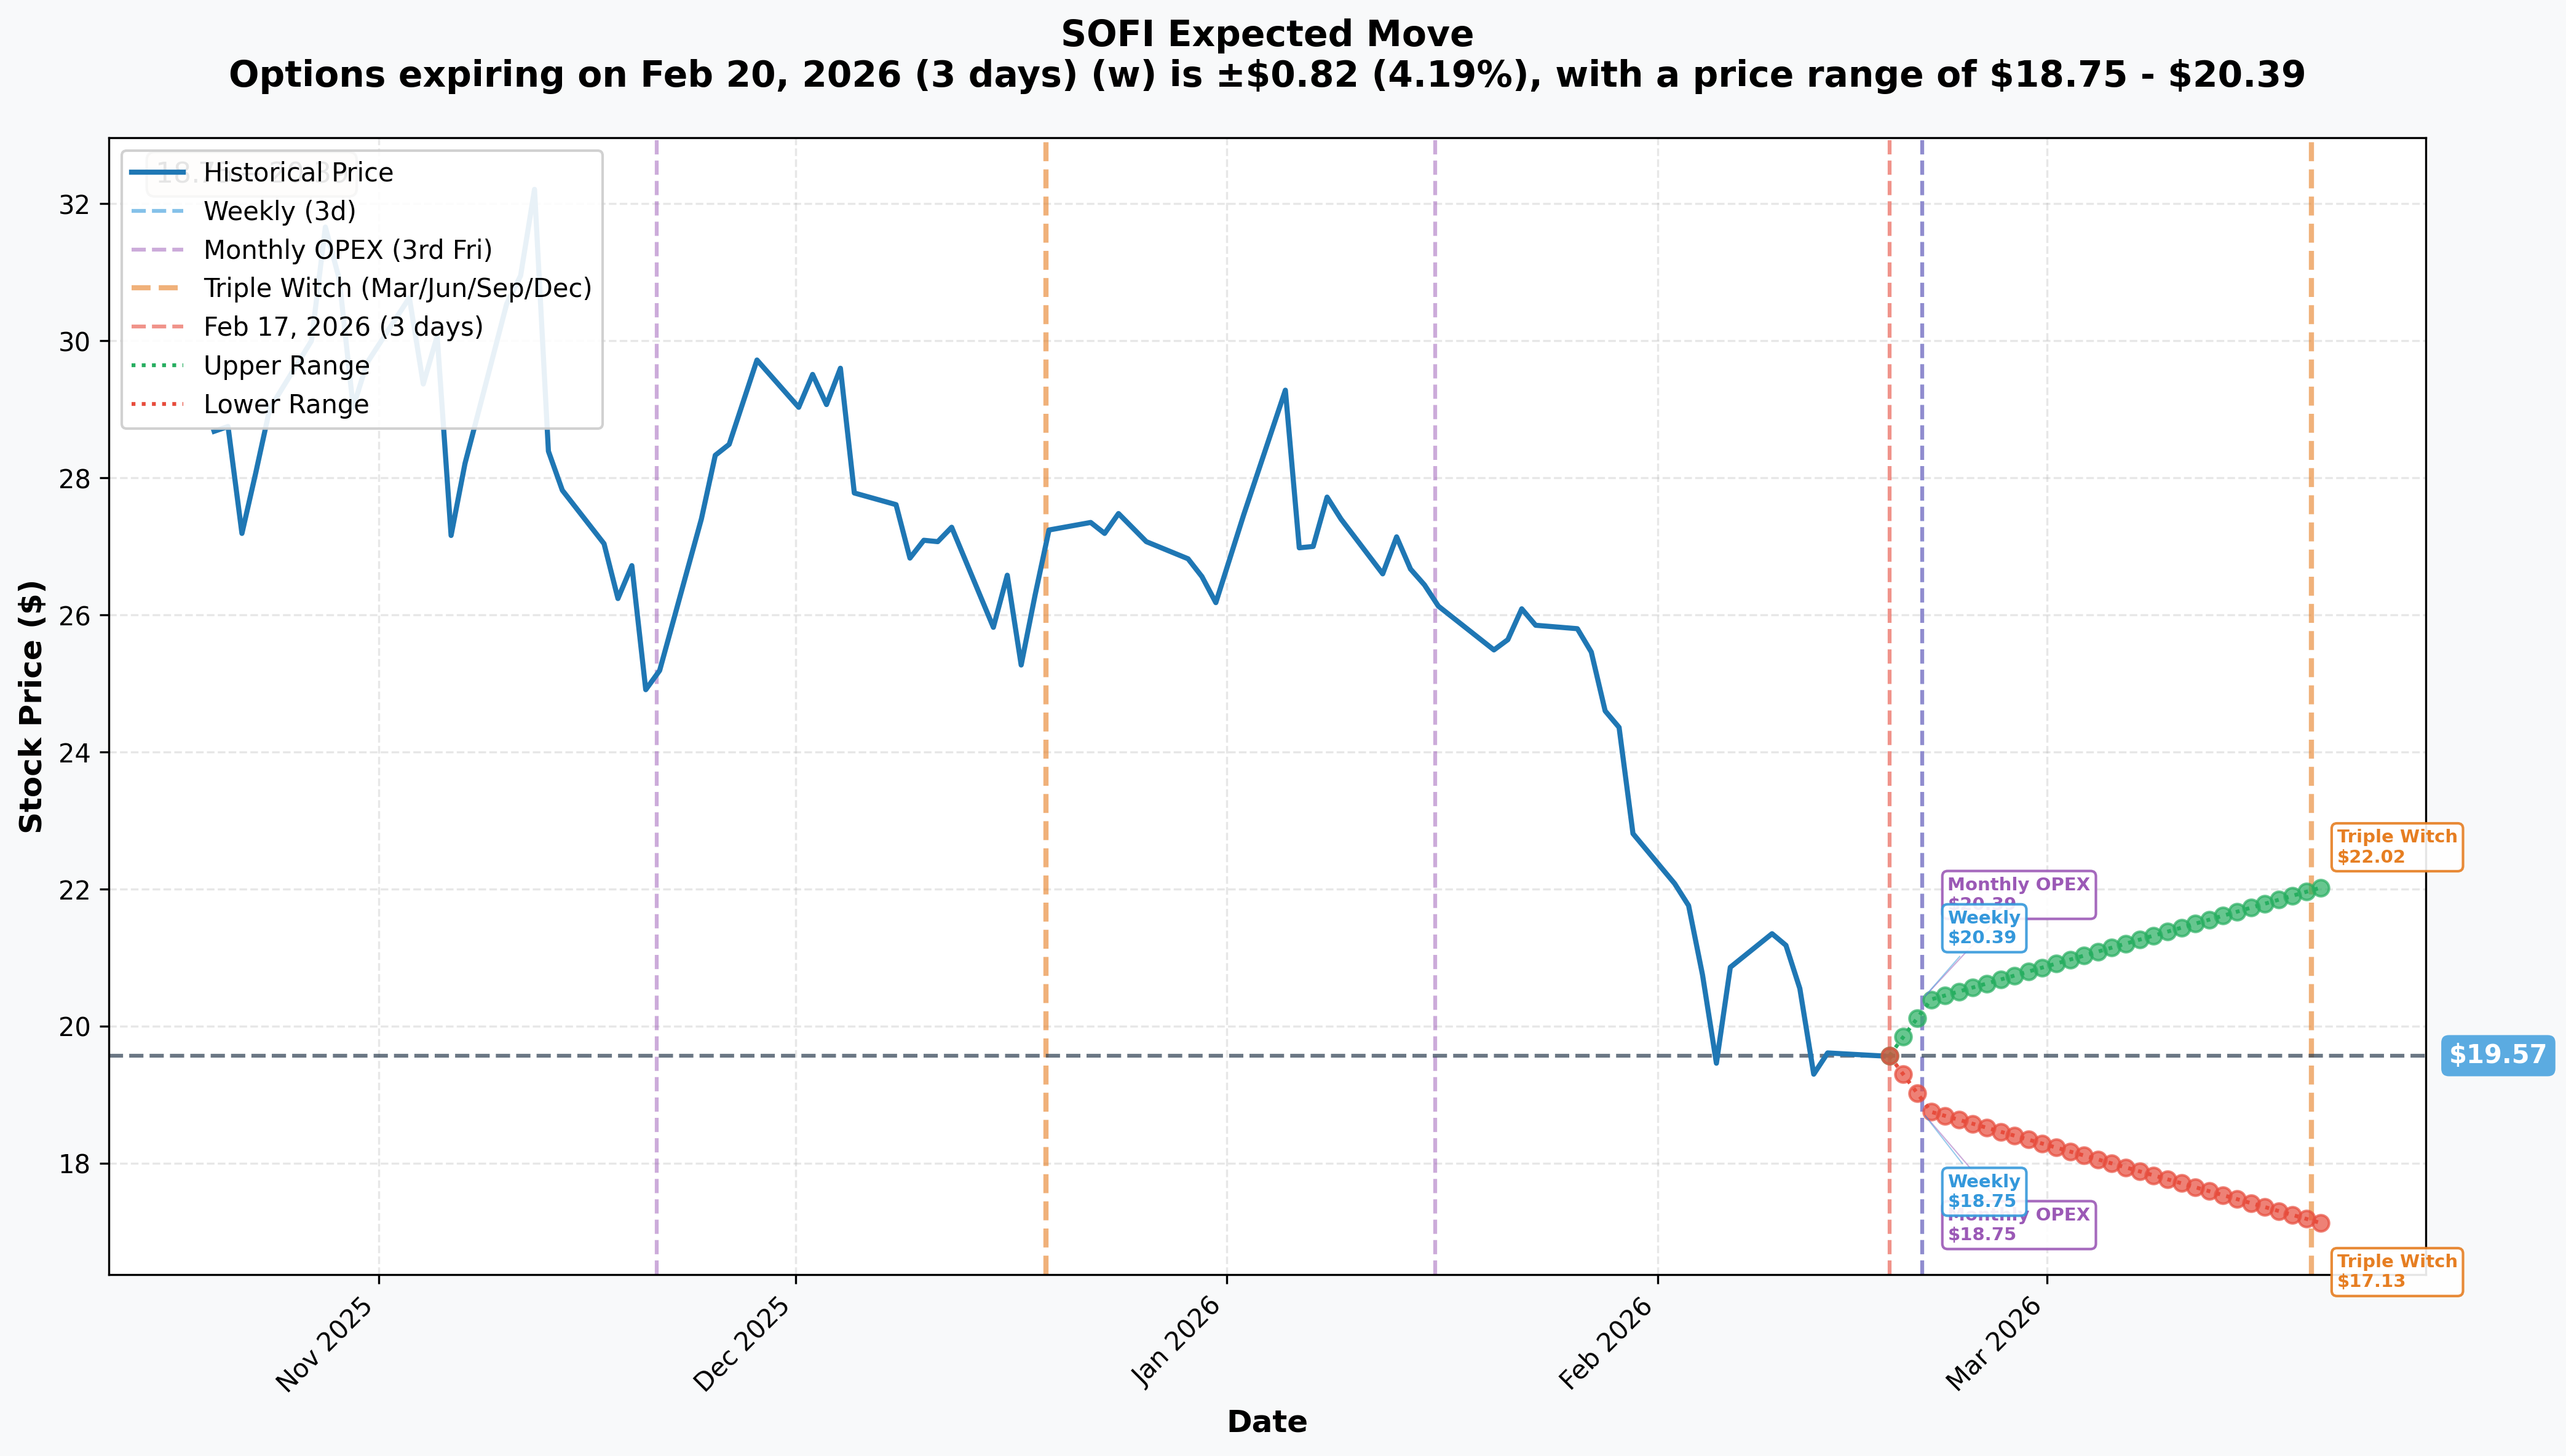
Options market pricing for upcoming expirations:
- 📅 Weekly (Feb 20 - 3 days): ±$0.82 (±4.19%) → Range: $18.75 - $20.39
- 📅 Monthly OPEX (Feb 20 - 3 days): ±$0.82 (±4.19%) → Range: $18.75 - $20.39
- 📅 Quarterly Triple Witch (Mar 20 - 31 days): ±$2.45 (±12.51%) → Range: $17.13 - $22.02
Translation for regular folks:
Options traders are pricing in a 4.2% move ($0.82) by this week's Friday expiration and a BIGGER 12.5% move ($2.45) through March Triple Witch. The market expects continued volatility as SOFI digests its pullback and positions for Q1 earnings.
The March lower range of $17.13 aligns closely with the $17 gamma support level - meaning the options market thinks there's a real possibility SOFI could trade as low as $17 over the next month. This validates the put buyer's thesis: they see continued weakness ahead.
The May 15th expiration (when this $1.9M trade expires) gives ample time for Q1 earnings to play out, any S&P 500 inclusion disappointment to materialize, and credit quality concerns to surface.
🎪 Catalysts
🔥 Upcoming Catalysts (February - May 2026)
Q1 2026 Earnings - Expected May 4, 2026 📊
SOFI reports fiscal Q1 results approximately May 4th. This is THE catalyst that will determine whether this put trade prints or expires worthless:
- 📊 2026 Revenue Guidance: $4.655B (+30% YoY) - management needs to show progress
- 💰 2026 EPS Target: $0.60 adjusted EPS (+54% YoY) - high bar after recent dilution
- 🏦 Member Growth: At least 30% growth targeted - watch for deceleration
- 💳 Fee-Based Revenue: Expected +40% for Financial Services - critical for multiple expansion
- 📈 Credit Quality: Personal loan portfolio $15B exposure - any deterioration would crater stock
S&P 500 Index Inclusion - High Uncertainty 📈
SoFi meets all technical criteria for S&P 500 inclusion, but the timing remains uncertain:
- ✅ Market cap ~$25B (threshold: $18-22.7B) - MEETS
- ✅ 9 consecutive quarters GAAP profitability (requirement: 4) - EXCEEDS
- ✅ High liquidity - MEETS
- 🎯 Truist: "SoFi meets all of the criteria" for inclusion
- 📊 58% of retail traders picked SOFI as most likely Q1 add
- ⚠️ BUT: S&P committee decisions are unpredictable - no announcement = disappointment catalyst
Product Launches:
- 🏦 Business Banking Launch (2026): Targeting fiat/crypto business customers - addressing critical market gap
- 💰 SoFi Plus Subscription (March 2026): $10/month premium tier - revenue diversification
- 🌍 SoFi Pay International: Expanding to 30+ countries via Bitcoin Lightning
✅ Recent Catalysts (Already Happened)
Q4 2025 Earnings - January 30, 2026 (STRONG BEAT)
SOFI delivered landmark results crossing $1B quarterly revenue:
- 💰 Revenue: $1.01B vs $982M consensus (+40% YoY) - BEAT
- 📈 GAAP Net Income: $173.5M (+2.1x YoY)
- ✅ GAAP EPS: $0.13 vs $0.12 consensus - BEAT
- 🚀 Member Growth: Record 1.027M added, 13.7M total (+35% YoY)
Despite the beat, stock gave back gains - WHY?
The December 2025 $1.5B capital raise at $27.50/share (54.5M shares) created 4-5% dilution right after CEO Noto was buying shares at $24-25. This timing raised governance questions. The aggressive 2026 guidance sets a HIGH bar that any stumble would punish.
Analyst Reactions (Mixed):
| Date | Firm | Rating | Price Target |
|---|---|---|---|
| Feb 9, 2026 | Citizens JMP | Outperform | $30 (Upgrade) |
| Jan 31, 2026 | J.P. Morgan | Overweight | $31 (Upgrade) |
| Recent | Goldman Sachs | -- | $24 (Lowered from $27) |
| Recent | Mizuho | -- | $38 (Street High) |
Consensus: 15 analysts, average target $26.68 (+36% upside), range $12-$38
🎲 Price Targets & Probabilities
Using gamma levels, implied move data, and upcoming catalysts, here are the scenarios through May 15th expiration:
📈 Bull Case (25% probability)
Target: $24-$28
How we get there:
- 🚀 S&P 500 inclusion announced (forces passive buying of tens of millions of shares)
- ✅ Q1 earnings track toward 30% revenue growth guidance
- 🏦 Business banking launch gains traction, diversifies revenue
- 💳 Fee-based revenue accelerates past 40% of total
- 📊 Break above $20 gamma resistance triggers technical rally to $22, then $24
- 🌍 International expansion news catalyzes re-rating
Probability assessment: Only 25% because stock is in established downtrend, broken key technical levels, and needs multiple positive catalysts to reverse sentiment. The $20 gamma ceiling (47.3B - strongest level) creates major headwind.
Put trade outcome: $19 puts expire worthless, $1.9M loss for put buyer.
🎯 Base Case (45% probability)
Target: $17.50-$20.50 range (CHOPPY CONSOLIDATION)
Most likely scenario:
- ⚖️ Stock bounces between gamma support ($19) and resistance ($20)
- 📊 No S&P 500 inclusion announcement through Q1
- ✅ Q1 earnings meet expectations but don't exceed
- 😰 Credit quality questions linger without clear resolution
- 🔄 Oversold bounce attempts capped by selling pressure
- 💤 Market awaits clearer direction on execution
This is the uncertain zone for the put buyer: Stock could end anywhere from $17.50 to $20.50. Puts would have value if below $19, losses if above.
📉 Bear Case (30% probability)
Target: $14-$17 (PUT PRINTS BIG!)
What could go wrong:
- 😰 Q1 earnings miss or guidance cut citing macro weakness
- 🚨 Credit quality deterioration in $15B personal loan portfolio
- ❌ S&P 500 inclusion passed over, triggering disappointment selling
- 💸 Competition intensifies (Chime IPO, Robinhood expansion)
- 📉 Break below $19 gamma support triggers cascade to $18, then $17
- 🏦 Rising unemployment pressures consumer lending quality
- 📊 Valuation compression from 49x forward P/E toward 30-35x
Critical support levels:
- 🛡️ $19.00: Major gamma floor (31.6B) - THE PUT STRIKE
- 🛡️ $18.00: Deep support (10.3B gamma)
- 🛡️ $17.00: Extended floor (9.1B gamma) - bear case target
Put P&L in Bear Case:
- Stock at $17 on May 15: Puts worth $2.00, profit = -$0.22/share loss (bought at $2.22)
- Stock at $16 on May 15: Puts worth $3.00, profit = $0.78/share × 8,750 = $683K gain (36% ROI)
- Stock at $15 on May 15: Puts worth $4.00, profit = $1.78/share × 8,750 = $1.56M gain (82% ROI)
- Stock at $14 on May 15: Puts worth $5.00, profit = $2.78/share × 8,750 = $2.43M gain (128% ROI!)
Probability assessment: 30% because credit quality risk in $15B personal loan book hasn't been tested in a recession, aggressive guidance creates high execution bar, and technical damage is significant. The put buyer clearly thinks downside risk is underappreciated.
💡 Trading Ideas
🛡️ Conservative: Wait for Q1 Clarity
Play: Stay on sidelines until after Q1 earnings (May 4th)
Why this works:
- ⏰ Major binary event approaching - Q1 earnings will set direction
- 📉 Stock in established downtrend - don't fight the tape
- 📊 49x forward P/E leaves zero margin for error
- 🐻 $1.9M institutional put buy signals smart money worried
- 💰 Better entry likely post-earnings after direction clarifies
- 🛡️ Preserves capital for higher-conviction opportunities
Action plan:
- 👀 Watch Q1 earnings for revenue trajectory ($1.16B needed for 30% annual target)
- 🎯 Look for pullback to $17-18 gamma support for long entry
- ✅ Need to see credit quality stability before committing capital
- 📊 Monitor S&P 500 inclusion news - catalyst either way
Risk level: Minimal (cash position) | Skill level: Beginner-friendly
⚖️ Balanced: Put Spread for Defined-Risk Bearish Bet
Play: Bear put spread targeting gamma support breakdown
Structure: Buy $19 puts, Sell $17 puts (May 15 expiration - SAME as the $1.9M trade)
Why this works:
- 🎯 Defined risk spread ($2 wide = $200 max risk per spread)
- 📊 Targets gamma support zone where institutions are positioned
- 🤝 Essentially "copying" the smart money at reduced cost
- ⏰ 87 days captures Q1 earnings catalyst
- 🛡️ Protects against "sell the news" on any Q1 disappointment
Estimated P&L:
- 💰 Pay ~$0.90-1.10 net debit per spread (current pricing)
- 📈 Max profit: $0.90-1.10 if SOFI below $17 at May expiration (~100% ROI)
- 📉 Max loss: $0.90-1.10 if SOFI above $19 (defined)
- 🎯 Breakeven: ~$18.00-18.10
Position sizing: Risk only 2-3% of portfolio
Risk level: Moderate (defined risk, bearish) | Skill level: Intermediate
🚀 Aggressive: Sell Cash-Secured Puts at $17 Support
Play: Sell puts at deep gamma support to collect premium or get shares cheap
Structure: Sell $17 puts (May 15 expiration)
Why this could work:
- 💰 Collect premium while willing to own SOFI at $17 (12% below current)
- 📊 $17 has 9.1B gamma support - natural floor level
- 🎯 If assigned, cost basis ~$16.50 (including premium) - attractive entry
- ⏰ 87 days of theta decay working in your favor
- 📈 If stock stabilizes/rebounds, keep premium as pure profit
Why this could fail:
- 😰 Credit quality deterioration could send stock to $12-14 (below analyst low targets)
- 📉 Assigned at $17 when stock trading $14 = immediate -18% loss
- 💸 Ties up ~$1,700 margin per contract
- ⚠️ Requires conviction SOFI won't collapse through support
Estimated P&L:
- 💰 Collect ~$0.50-0.70 per contract ($50-70 per spread)
- 📈 Max profit: Premium collected if SOFI above $17
- 📉 Max loss: $17 × 100 - premium = ~$1,630 per contract (assignment at zero)
- 🎯 Breakeven: ~$16.40
ONLY attempt if:
- ✅ You want to own SOFI at $16.40 cost basis
- ✅ You have $1,700 per contract in cash/margin
- ✅ You can stomach potential further downside post-assignment
Risk level: HIGH (undefined downside) | Skill level: Advanced
⚠️ Risk Factors
Don't get caught by these potential landmines:
-
💳 $15B personal loan book untested in recession: SOFI's core lending business has never experienced a significant job market downturn. Default rates, not interest rates, drive lender valuations. Any uptick in unemployment could trigger credit quality deterioration and valuation compression.
-
💸 Recent dilution from $1.5B capital raise: The December 2025 offering at $27.50/share added ~5% to share count shortly after CEO Noto was buying shares at $24-25. This was the second major raise in 2025 (after July $1.5B), creating ongoing dilution concerns. Use of proceeds remains vague ("general corporate purposes").
-
📊 Aggressive guidance creates high execution bar: Management's 2026 targets - 30% revenue growth, $0.60 EPS (+54%) - leave zero margin for error. At 49x forward P/E, any stumble triggers outsized selloff. Current pullback suggests market skeptical of guidance.
-
🏦 S&P 500 inclusion NOT guaranteed: While Truist says SOFI "meets all criteria", the index committee makes unpredictable decisions. No inclusion = disappointment catalyst. Market may be pricing in inclusion that doesn't materialize.
-
📉 Technical damage significant: Stock broke down from rising trend channel, issued negative double-top signal at $27.16, and trades below all major moving averages. RSI oversold at 29.8 but ADX at 31.7 confirms established downtrend. Momentum firmly bearish.
-
⚖️ Competition intensifying: Chime preparing IPO at $30B+ valuation, Robinhood expanding banking services, Nu Holdings applying for U.S. charter. Traditional banks accelerating digital transformation. Market share battles pressure margins.
-
🐻 $1.9M institutional put buy signals smart money concern: When sophisticated players pay $2.22/share for at-the-money puts instead of buying the dip, it's a major caution flag. The Z-score of 43.47 (extremely unusual) shows this isn't normal positioning - this is conviction.
-
🌍 International expansion adds execution risk: SoFi Pay expansion to 30+ countries and business banking launch add operational complexity. Subscription model transition (SoFi Plus) unproven. Multiple new initiatives increase chances of stumbles.
🎯 The Bottom Line
Real talk: Someone just spent $1.9 MILLION betting SOFI drops below $19 by mid-May. This isn't a hedge on an existing position - this is a directional bearish bet with significant conviction. The Volume/OI ratio of 4.6x and Z-score of 43.47 confirm this is serious institutional activity.
What this trade tells us:
- 🎯 Sophisticated player expects SOFI to break below $19 support (currently $19.28)
- 💰 They're paying $2.22/share (11.5% of stock price) for downside exposure - expensive insurance they expect to pay off
- ⚖️ The timing (87 days to Q1 earnings) shows they see binary risk with negative skew
- 📊 They structured at $19 strike exactly where 31.6B gamma support sits - betting this level breaks
This IS a "more downside ahead" signal for a stock already down 41% from highs.
If you own SOFI:
- ⚠️ Consider trimming position ahead of Q1 earnings
- 📊 Set mental stop at $17 gamma support
- 🛡️ Consider protective puts if holding large position
- 🔄 Re-evaluate after Q1 earnings clarity
If you're watching from sidelines:
- ⏰ May 4th (expected) is the moment of truth - DO NOT catch this falling knife before earnings
- 🎯 Post-earnings pullback to $15-17 would be MUCH better entry than $19
- 📈 Need to see: credit quality stability, member growth continuation, fee revenue acceleration
- ⚠️ 49x forward P/E requires flawless execution - one stumble and $15 is in play
If you're bearish:
- 📊 Put spreads ($19/$17) offer defined-risk way to express view
- 🎯 Key support at $19 (31.6B gamma), $18 (10.3B), $17 (9.1B)
- ⏰ Q1 earnings will be THE catalyst - position accordingly
- ⚠️ Oversold RSI at 29.8 could trigger technical bounce - size appropriately
Mark your calendar - Key dates:
- 📅 February 20 - Weekly/Monthly OPEX (±4.2% implied move)
- 📅 March 20 - Quarterly Triple Witch (±12.5% implied move)
- 📅 May 4 (expected) - Q1 2026 Earnings Report
- 📅 May 15 - This $1.9M put trade expires
Final verdict: SOFI's long-term fintech story - first $1B revenue quarter, 9 consecutive profitable quarters, potential S&P 500 inclusion - remains compelling. BUT, at 49x forward P/E with 41% drawdown from highs, untested credit quality in $15B loan book, and established technical downtrend, the risk/reward is NOT favorable for longs here.
The $1.9M put purchase at exactly the $19 gamma support level is a CLEAR signal: smart money is positioned for more downside. Whether it's credit quality concerns, S&P 500 inclusion disappointment, or Q1 execution wobbles, someone with deep pockets thinks this pullback has further to go.
Be patient. Let Q1 earnings clear. Look for $15-17 entry. The fintech revolution will still be here, and your capital will be better deployed with clearer visibility.
Disclaimer: Options trading involves substantial risk of loss and is not suitable for all investors. This analysis is for educational purposes only and not financial advice. Past performance doesn't guarantee future results. The Z-score of 43.47 reflects this specific trade's unusualness relative to recent SOFI activity - it does not imply the trade will be profitable or that you should follow it. Always do your own research and consider consulting a licensed financial advisor before trading. SOFI has significant credit quality exposure that could deteriorate rapidly in economic downturn.
About SoFi Technologies: SoFi Technologies, Inc. is a digital financial services company operating as a chartered national bank. Founded in 2011 as a student loan refinancer, SoFi has evolved into a comprehensive fintech platform offering personal loans, student loans, mortgages, banking, investing, and B2B infrastructure (Galileo, Technisys). Market cap: $24.78 billion with 13.7 million members and 20.2 million products.