🐋 STX: $32M Calendar Spread Signals Institutional Volatility Play Ahead of Earnings
January 8, 2026 | Unusual Activity Detected
Company Overview
| Metric | Value |
|---|---|
| Company | Seagate Technology Holdings plc |
| Ticker | STX |
| Sector | Computer Storage Devices |
| Market Cap | $67.16B |
| Description | Seagate Technology is a leading supplier of hard disk drives for data storage to the enterprise and consumer markets, maintaining a dominant market position alongside Western Digital. The company has become a major beneficiary of AI-driven data center demand through its HAMR (Heat-Assisted Magnetic Recording) technology leadership. |
The Quick Take
Someone just deployed $32 million in a sophisticated calendar spread on Seagate Technology - buying near-term January 16 calls while aggressively selling February 20 calls at the same $250 strike. This is a classic institutional volatility timing play positioned right before Q2 FY2026 earnings on January 28. The trade structure suggests this trader expects elevated volatility through January expiration but anticipates volatility crush or price normalization by February.
The Option Flow Breakdown
What Just Happened
| Time | Direction | Type | Expiration | Strike | Volume | Premium | Order Type | Z-Score | Option Symbol |
|---|---|---|---|---|---|---|---|---|---|
| 10:11:45 | SELL | CALL | 2026-02-20 | $250 | 2,600 | $14M | STO | 132.0 | STX20260220C250 |
| 10:11:45 | BUY | CALL | 2026-01-16 | $250 | 3,700 | $12M | BTO | 8.69 | STX20260116C250 |
| 10:11:45 | SELL | CALL | 2026-02-20 | $250 | 2,900 | $1.5M | STO | 147.28 | STX20260220C250 |
| 10:11:45 | SELL | CALL | 2026-02-20 | $250 | 3,400 | $1.5M | STO | 172.75 | STX20260220C250 |
| 10:11:45 | SELL | CALL | 2026-02-20 | $250 | 3,700 | $1.5M | STO | 188.04 | STX20260220C250 |
| 10:11:45 | SELL | CALL | 2026-02-20 | $250 | 3,200 | $1.5M | STO | 162.56 | STX20260220C250 |
Total Premium Deployed: $32 million
What This Actually Means
This is a Calendar Spread (also called a Time Spread or Horizontal Spread). Here is how it works:
- Long Position: 3,700 January 16 $250 calls ($12M premium) - Profits if stock moves significantly before January OPEX
- Short Position: 15,800 February 20 $250 calls ($20M premium collected) - Benefits from time decay and volatility crush after earnings
The Z-scores on the February short calls are extraordinarily high (132-188), indicating this volume is roughly 130-188x normal daily activity for these contracts. For context, a Z-score above 3 is typically considered statistically significant, and these trades are 40-60x beyond that threshold.
The Strategy Logic:
- Pre-Earnings Positioning: With Q2 earnings on January 28, the trader is long through January OPEX (Jan 16) to capture any pre-earnings run-up
- Volatility Timing: By selling the February calls, they are betting that implied volatility will collapse after earnings
- Premium Collection: The $20M collected from February sales partially finances the $12M January longs, creating a net credit structure
- Strike Selection: The $250 strike is approximately 11% below current price ($281), suggesting they expect some pullback or are using deep ITM options for reduced theta decay on the long leg
Technical Setup / Chart Check-Up
YTD Performance
STX has been one of the standout performers of 2025, delivering a +218.8% return year-to-date. The stock has transformed from an $86 starting price to the current $275-281 range, driven almost entirely by AI data center demand and HAMR technology adoption.
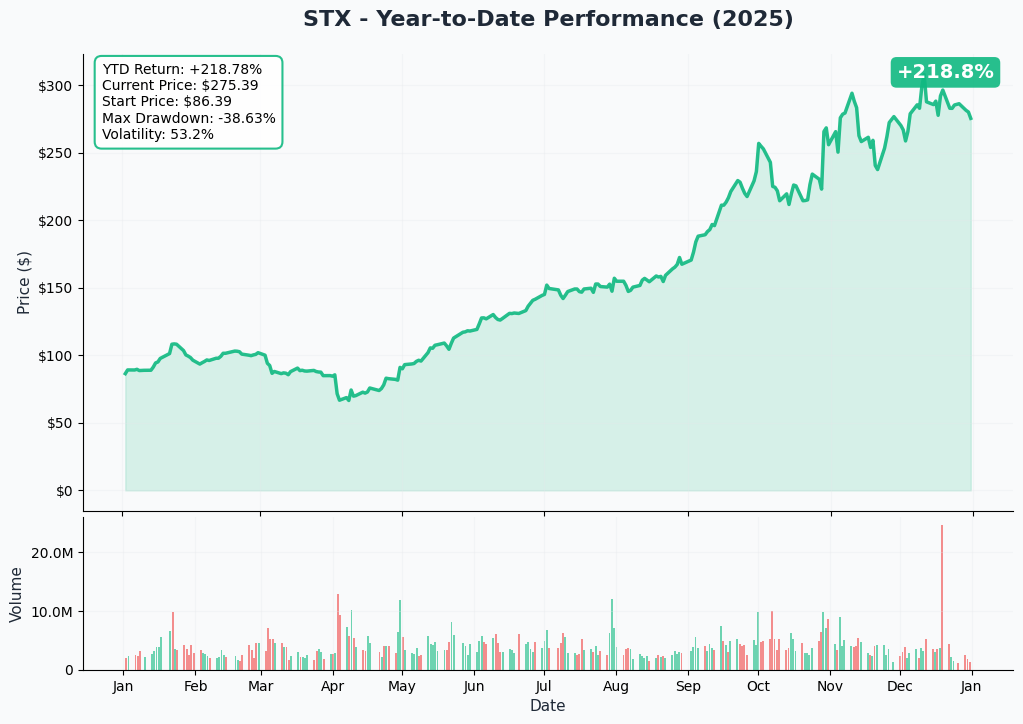
Key Observations:
- 📈 Strong uptrend throughout 2025 with acceleration in Q4
- 💹 Recent consolidation between $270-330 in December/January
- 📊 Volume spike visible in recent sessions, confirming institutional interest
- ⚠️ Max drawdown of -38.6% occurred in April - showing this stock can move violently
- 🎢 Annualized volatility of 53.2% - expect big swings in either direction
Gamma-Based Support & Resistance Analysis
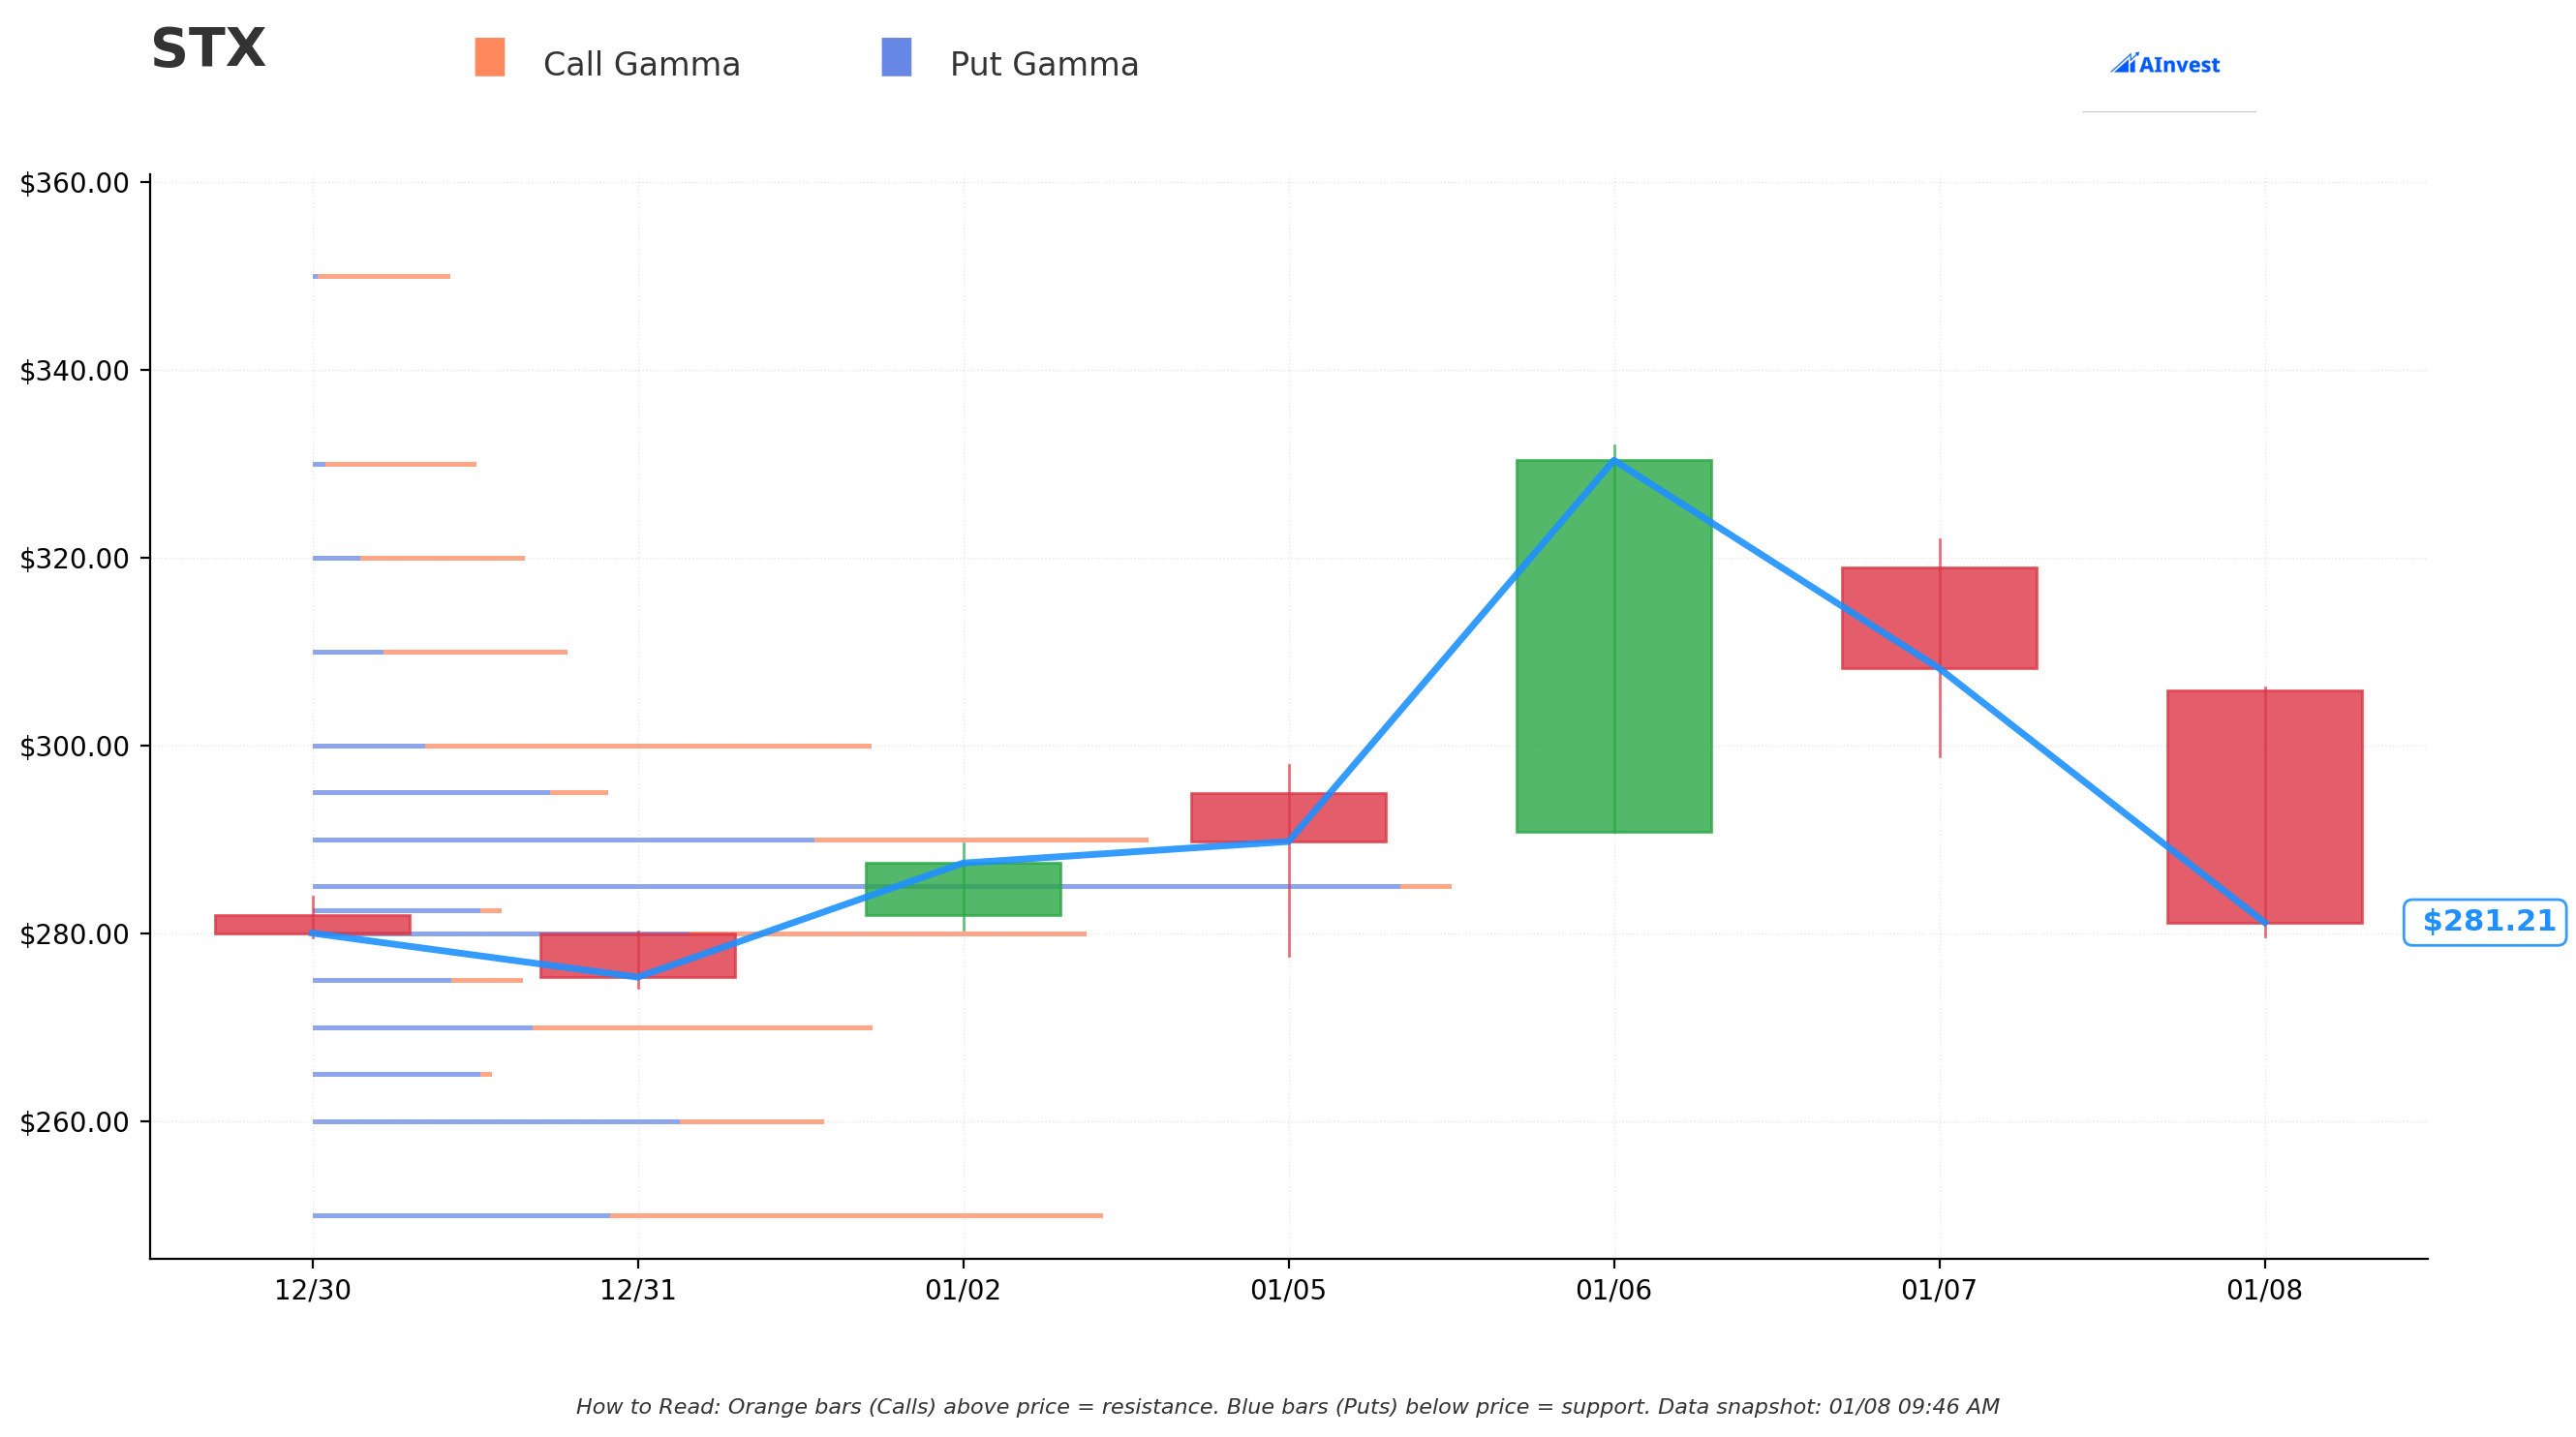
Reading the Gamma Chart:
- 🟠 Orange bars (Call Gamma) above current price = Resistance zones where market makers will sell into rallies
- 🔵 Blue bars (Put Gamma) below current price = Support zones where market makers will buy dips
Key Gamma Levels:
- Major Resistance: $320-340 zone shows significant call gamma concentration
- Current Price Zone: $281 sits in a relatively balanced gamma area
- Support Levels: $260-280 has substantial put gamma providing a floor
- Pin Risk: The $280 level appears to be a potential magnet heading into January expiration
What This Means: Market makers are positioned with significant call exposure above $300, meaning any rally will face selling pressure as they hedge. Conversely, the put gamma below $270 suggests dip-buyers will emerge on any pullback.
Implied Move Analysis
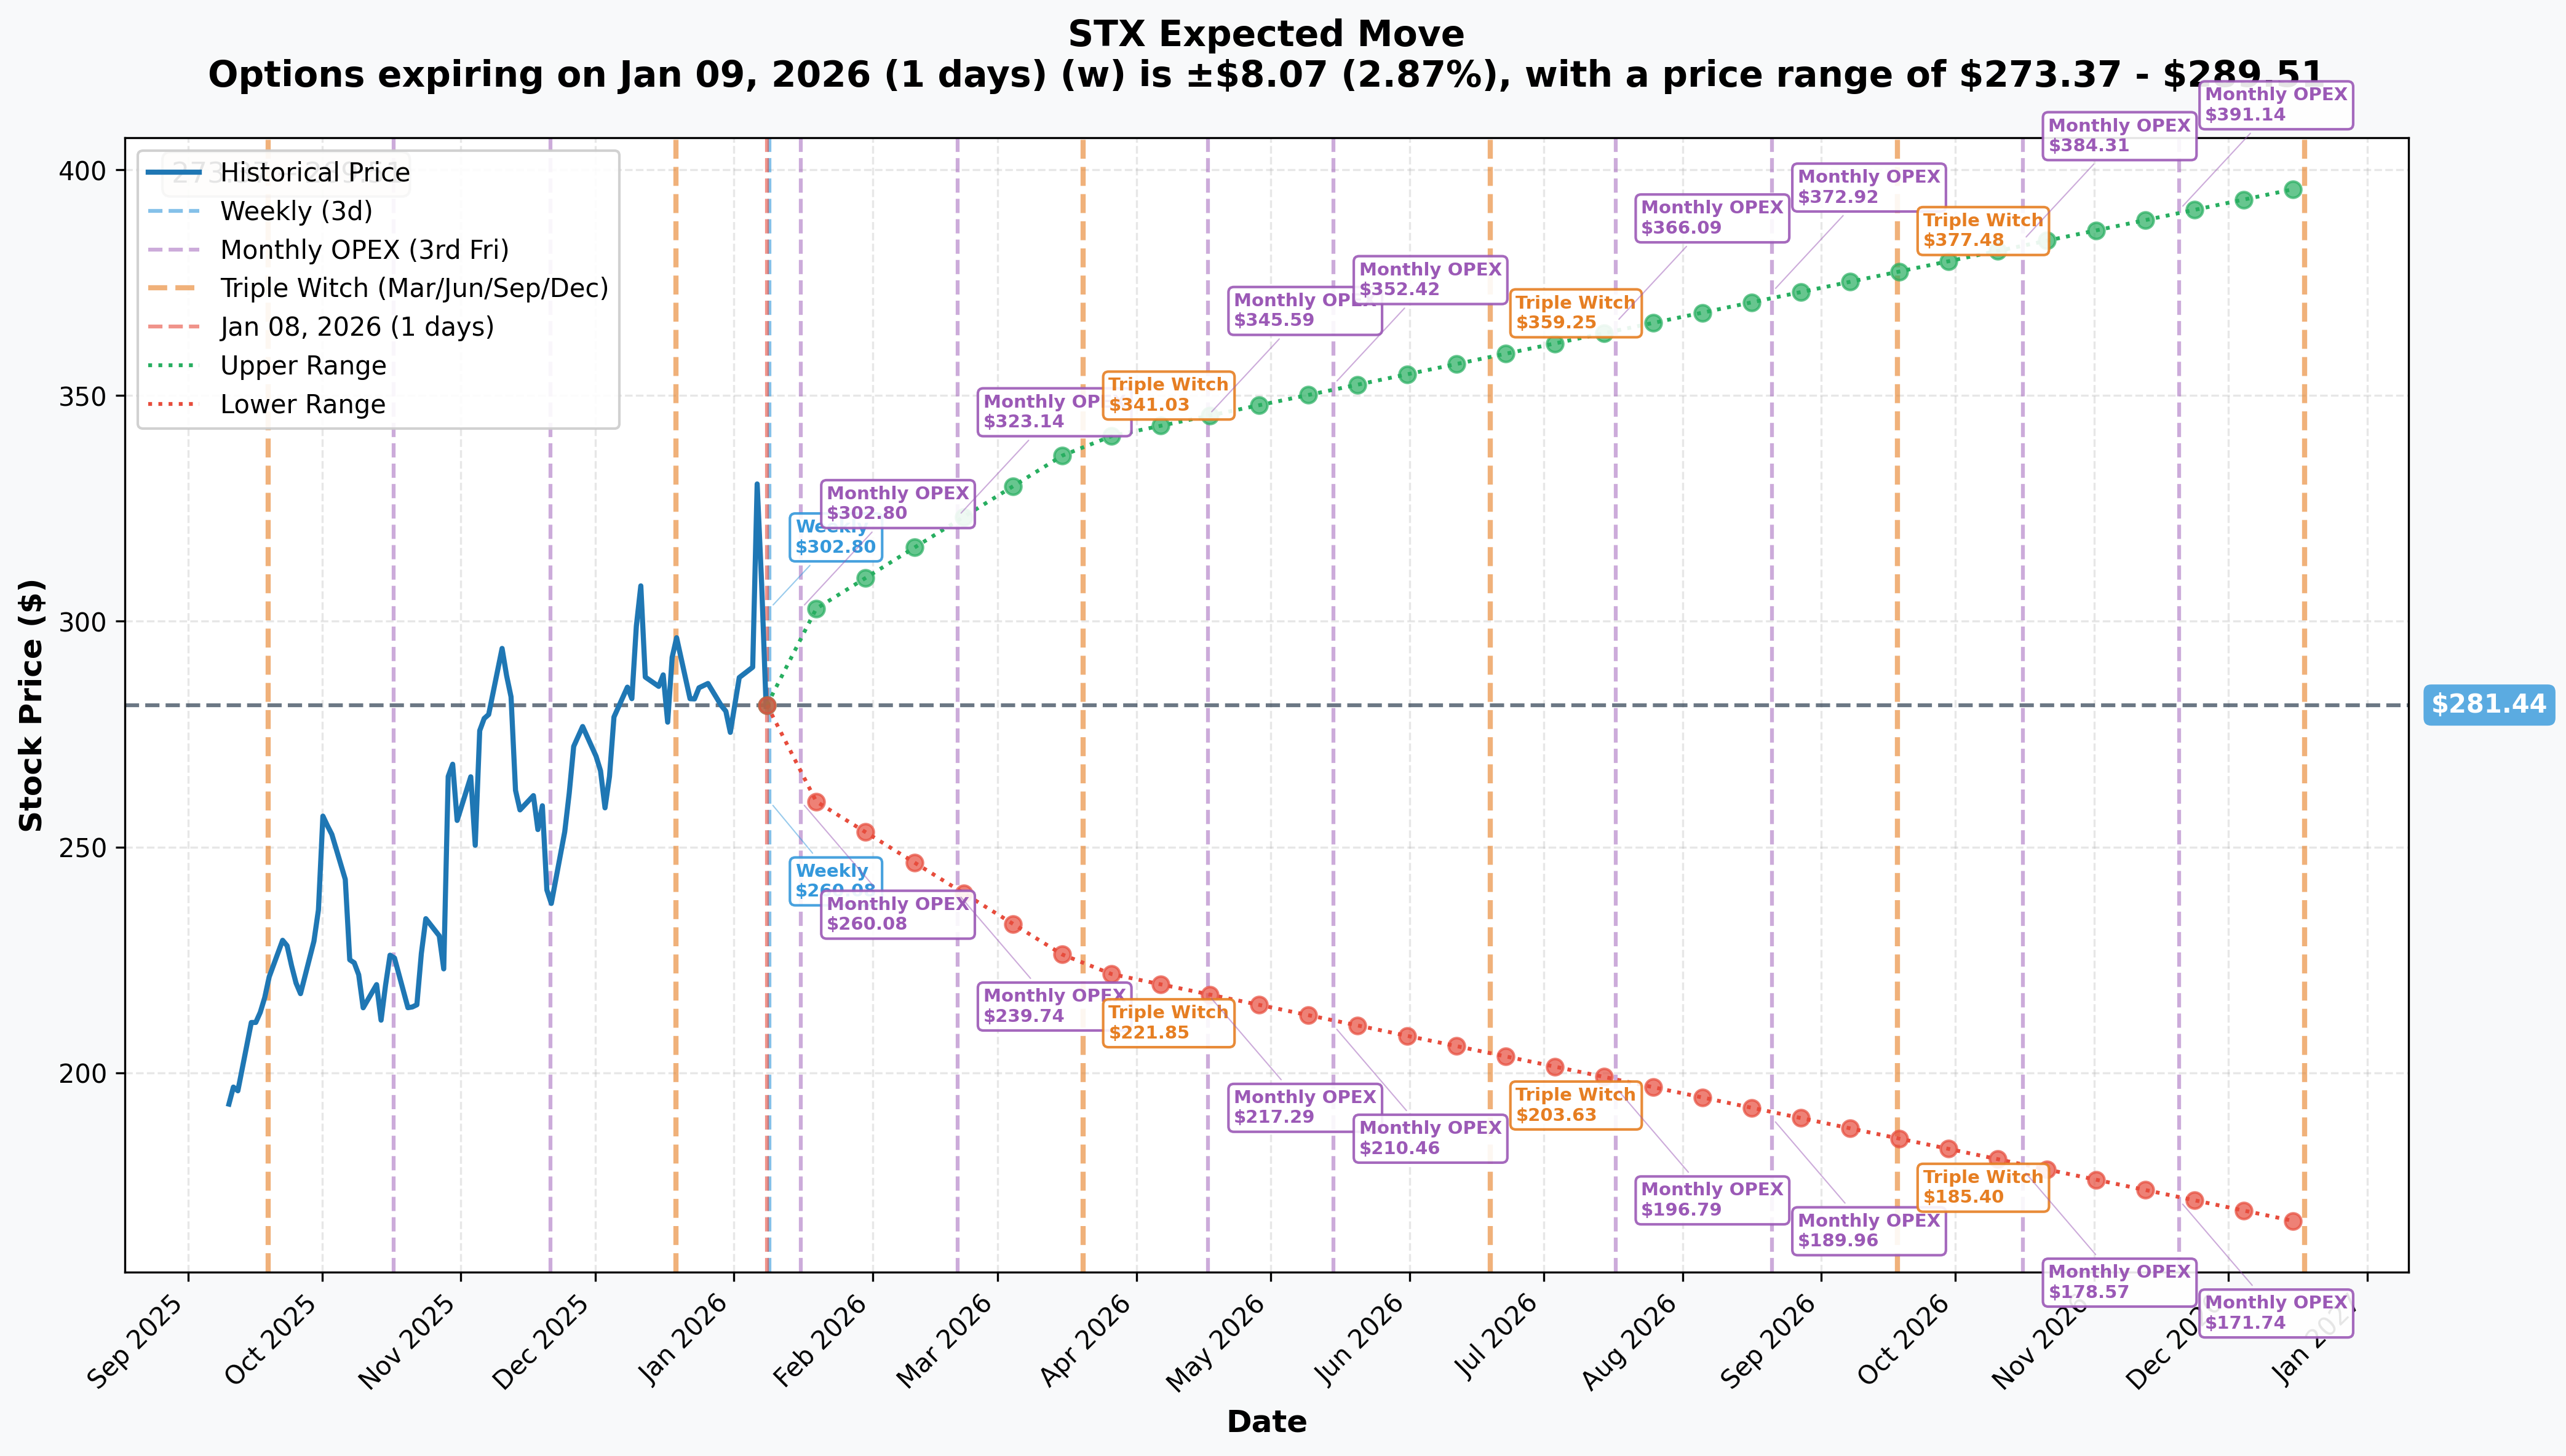
Options Market Expectations by Expiration:
| Timeframe | Expiry | Days Out | Implied Move | Range |
|---|---|---|---|---|
| Weekly | 2026-01-09 | 1 | +/-2.87% | $273.37 - $289.51 |
| Monthly OPEX | 2026-01-16 | 8 | +/-6.93% | $261.93 - $300.95 |
| February OPEX | 2026-02-20 | 43 | ~+/-14.8% | $239.74 - $323.14 |
| Triple Witch | 2026-03-20 | 71 | +/-20.73% | $223.09 - $339.79 |
Key Insight: The $250 strike chosen for this calendar spread is at the lower end of the January implied range ($261.93) and comfortably within the February range. This positioning suggests the trader expects the stock to stay relatively stable or move toward $250-260 by February expiration.
Catalysts
Upcoming Events
| Date | Event | Significance |
|---|---|---|
| January 28, 2026 | Q2 FY2026 Earnings (BMO) | Confirmed - Revenue guidance $2.70B (+/-$100M), EPS $2.75 (+/-$0.20). Nasdaq confirms this is before market open. |
| Mid-2026 | Remaining 3 CSP Qualifications | Blocks and Files reports full Mozaic 3+ adoption with all major cloud providers expected |
| H2 2026 | 50% HAMR Exabyte Crossover | Critical mass adoption inflection point for HAMR technology |
| H2 FY26 | Mozaic 4+ Volume Ramp | 44TB drive production beginning - next generation product cycle |
Recent Catalysts (Last 3 Months)
- Q1 FY2026 Earnings (Oct 28, 2025): Seagate Investor Relations reports record results - Revenue $2.629B (+21% YoY), GAAP Gross Margin 39.4% (record), Non-GAAP EPS $2.61 beat high-end guidance
- Nasdaq-100 Inclusion (Dec 22, 2025): StocksToTrade confirms STX joined the Nasdaq-100 Index, driving passive fund buying
- HAMR Milestone: Blocks and Files reports 1 million+ Mozaic HAMR drives shipped by September 2025
- Analyst Upgrades: MarketBeat shows Morgan Stanley raised to $337, Cantor Fitzgerald at $400, Loop Capital highest at $465
Price Targets & Probabilities
Based on gamma levels, implied move data, and the calendar spread positioning:
Bull Case: $320-340 (Probability: 25%)
Scenario: Strong Q2 earnings beat with raised guidance, HAMR adoption accelerating faster than expected
- Resistance from call gamma at $320-340 would be tested
- Would require break above December highs (~$332)
- Calendar spread would lose money as short Feb calls move deeper ITM
Base Case: $260-290 (Probability: 55%)
Scenario: Solid earnings inline with guidance, stock consolidates in range
- This is where the calendar spread profits most
- January calls expire worthless or with modest value, February calls decay
- Gamma support at $260-280 holds on any dips
- Stock gravitates toward high gamma concentration zones
Bear Case: $220-250 (Probability: 20%)
Scenario: Earnings miss, AI CapEx deceleration concerns, or broader market correction
- Calendar spread $250 strike becomes relevant
- Susquehanna analyst Hosseini maintains Street-low $150 target citing cycle risk
- Put gamma support at $260 could break, accelerating downside
- February implied range extends down to $239.74
Trading Ideas
Conservative: Cash-Secured Put for Entry
Strategy: Sell the February 20, 2026 $250 Put
- Premium: ~$8-12 per contract (estimate based on current IV)
- Max Risk: $25,000 per contract if assigned (stock goes to $0, extremely unlikely)
- Break-even: $238-242
- Why This Works: If STX stays above $250, you keep the premium. If assigned, you own shares at a cost basis well below current price near strong gamma support
- Best For: Investors who want to own STX at a discount with defined risk
Balanced: Calendar Spread (Following Institutional Flow)
Strategy: Replicate the institutional trade on smaller scale
- Trade: Buy Jan 16 $280 Call / Sell Feb 20 $280 Call
- Net Cost: Approximately $3-5 debit per spread
- Max Profit: Occurs if stock is at $280 at January expiration
- Max Risk: Initial debit paid
- Why This Works: Captures time decay differential between expirations, benefits from IV crush post-earnings in February leg
- Best For: Traders comfortable with multi-leg strategies who want defined risk exposure to earnings volatility
Aggressive: Call Spread into Earnings
Strategy: Buy Jan 24 or Jan 31 $290/$320 Call Spread (if weekly options available, otherwise use Feb 20)
- Trade: Buy $290 Call / Sell $320 Call
- Net Cost: ~$8-12 per spread
- Max Profit: $30 minus cost if stock above $320 at expiration
- Risk/Reward: Risking $10 to make $20 = 2:1 potential
- Why This Works: Defines maximum loss while capturing upside into earnings. Gamma levels show $320 as key resistance - selling that strike finances the long
- Best For: Directional traders who believe Q2 earnings will catalyze a move higher
Risk Factors
- Valuation Extended: Stock up 218%+ in 2025, P/S expanded from 1.16x to 3.2x - limited margin of safety
- Insider Selling: Simply Wall St reports CEO sold $7.66M, CFO also reduced stake (though via 10b5-1 plans)
- SSD Substitution Risk: NAND cost declines could accelerate enterprise SSD adoption at expense of HDDs
- Macro Sensitivity: AI CapEx deceleration in 2026-2027 could impact demand - consensus assumes industry downcycle
- Trade War Exposure: U.S.-China tech restrictions could disrupt Asian manufacturing supply chain
- Earnings Risk: Q2 FY2026 on Jan 28 - any guidance miss could trigger sharp correction given elevated expectations
The Bottom Line
Real talk: This $32M calendar spread is a sophisticated institutional volatility play, not a directional bet. The trader is positioned to profit from the time decay differential between January and February expirations, likely expecting earnings-driven volatility to spike through January then crush in February.
Action Plan:
- If you own STX: The institutional positioning suggests this trader expects choppy action through earnings. Consider taking some profits after the 218%+ run or writing covered calls against your position
- If you are watching: Wait for post-earnings volatility to settle. The calendar spread structure suggests smart money expects range-bound action by February
- If you are bearish: The $250 strike selection and February short calls indicate potential for pullback. Put spreads targeting the $250-260 zone align with institutional positioning
Mark Your Calendar: Q2 FY2026 earnings on January 28, 2026 (before market open) is the key catalyst. The institutional trader is positioned for this exact event.
The Lesson: When you see massive premium deployed in calendar spreads ahead of earnings, it often signals expectations for volatility timing rather than directional conviction. This trader is betting they can predict when volatility peaks (January) and when it fades (February).
Disclaimer
This analysis is for educational and informational purposes only and should not be construed as financial advice. Options trading involves substantial risk of loss and is not appropriate for all investors. The unusual options activity described here may represent hedging, complex multi-leg strategies, or institutional positioning that retail traders cannot fully replicate. Past performance does not guarantee future results. Always conduct your own due diligence and consider consulting a qualified financial advisor before making investment decisions.
Analysis generated January 8, 2026