📊 TMF: $25.6M Bearish Bet on Treasuries as Fed Holds Hawkish Stance!
📅 December 22, 2025 | 🔥 Unusual Activity Detected
🎯 The Quick Take
Someone just dumped $25.6 MILLION worth of TMF call options, betting big that this leveraged Treasury ETF won't rally past key strike prices by January 2026. This massive covered call setup at the $20, $25, and $30 strikes signals institutional players are capping their upside exposure while collecting premium - a cautious stance as the Fed's hawkish December guidance limits 2026 rate cuts to potentially just one reduction. With TMF trading at $38.07 and facing massive outflows exceeding $600M over recent months, institutions are positioning defensively ahead of the January 27-28 FOMC meeting.
💰 The Option Flow Breakdown
📊 What Just Happened
Here's the massive institutional activity that hit the tape on December 22, 2025:
🔴 Sold 21,000 TMF January 16, 2026 $25 Calls - $13.0M premium
- Strike: $25.00 | Premium collected: $12.95 per contract
- Volume: 21,000 contracts vs 2,000 open interest (10.5x ratio)
- Spot price: $38.07 - these are deep in-the-money calls
🔴 Sold 25,000 TMF January 16, 2026 $30 Calls - $9.3M premium
- Strike: $30.00 | Premium collected: $7.45 per contract
- Volume: 25,000 contracts vs 2,500 open interest (10.0x ratio)
- Still significantly in-the-money with $8+ of intrinsic value
🔴 Sold 2,900 TMF January 16, 2026 $20 Calls - $3.3M premium
- Strike: $20.00 | Premium collected: $18.05 per contract
- Volume: 2,900 contracts vs 373 open interest (7.8x ratio)
- Deepest in-the-money position, capturing maximum intrinsic value
💵 Total Premium Collected: $25,600,000
🤓 What This Actually Means
This is textbook institutional covered call writing - and it speaks volumes about where smart money sees TMF heading:
🔍 Translation for us regular folks:
These aren't speculative bets by retail traders. When you see someone sell nearly 49,000 call contracts (controlling 4.9 million shares worth $186M at current prices), they're either:
- Holding massive TMF positions and capping their upside to collect $25.6M in premium income
- Betting TMF won't rally significantly above these strikes by January 16, 2026 expiration
- Protecting against downside by using premium to cushion potential losses
The strike selection tells the real story. With TMF at $38.07:
- The $25 strike is 34% below current price
- The $30 strike is 21% below current price
- The $20 strike is 47% below current price
This setup profits if TMF stays flat, drifts lower, or even rallies modestly. The seller only starts losing money if TMF absolutely explodes higher past these strikes plus the premium collected. Given the Fed's hawkish December dot plot showing just one 2026 rate cut, institutions clearly don't expect a Treasury rally that would cause TMF to surge.
Volume/OI Ratios Signal Fresh Positioning: The 10.5x, 10.0x, and 7.8x volume-to-open-interest ratios indicate this is new positioning, not closing existing trades. Someone is actively establishing this bearish/neutral view right now.
📈 Technical Setup
YTD Chart Analysis
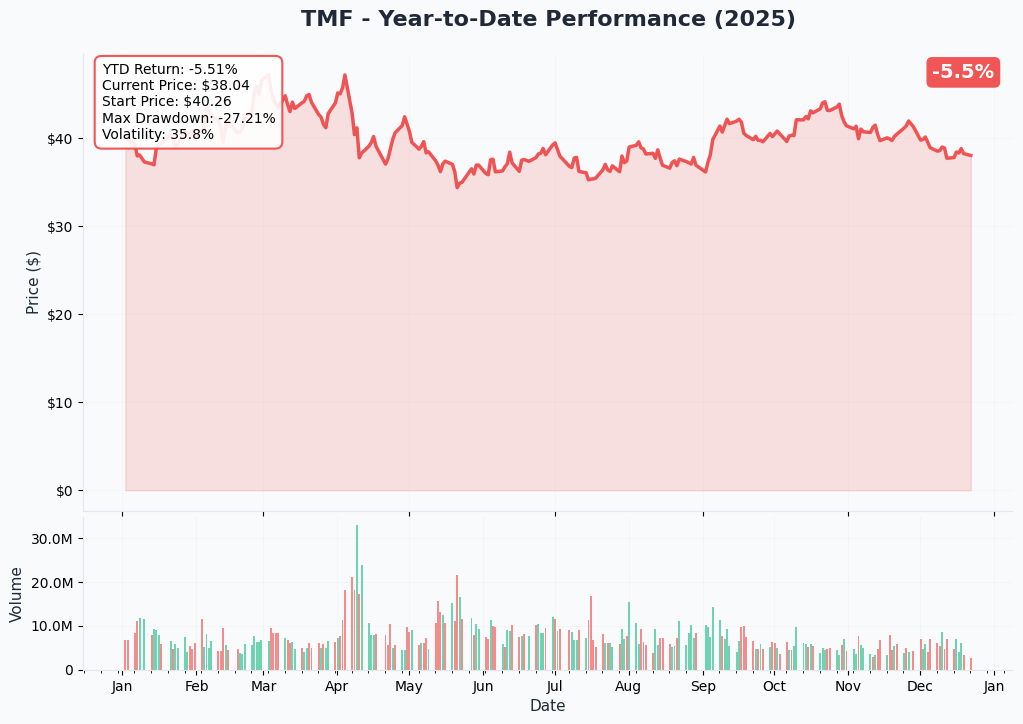
TMF has been in a sustained downtrend throughout 2025, currently trading at $38.25 - down 3.12% year-to-date and sitting 22% below the 52-week high of $48.98 reached earlier this year, according to Yahoo Finance data. The chart shows a clear pattern of lower highs and lower lows as 20-year Treasury yields climbed to 4.77%-4.78% amid persistent inflation and Fed hawkishness.
The leveraged ETF structure (3x daily exposure) has amplified losses as the yield curve steepened in December, with 10-year yields rising 40 basis points and the 2s/10s spread widening 31 bps. This creates significant headwinds for long-duration bonds, which TMF magnifies through its leverage mechanism.
Current positioning near $38 represents a critical support zone that's been tested multiple times in recent months. A break below this level could accelerate selling pressure, while a recovery above $40 would need to overcome substantial resistance from negative fund flows and unfavorable interest rate dynamics.
Gamma-Based Support & Resistance Analysis
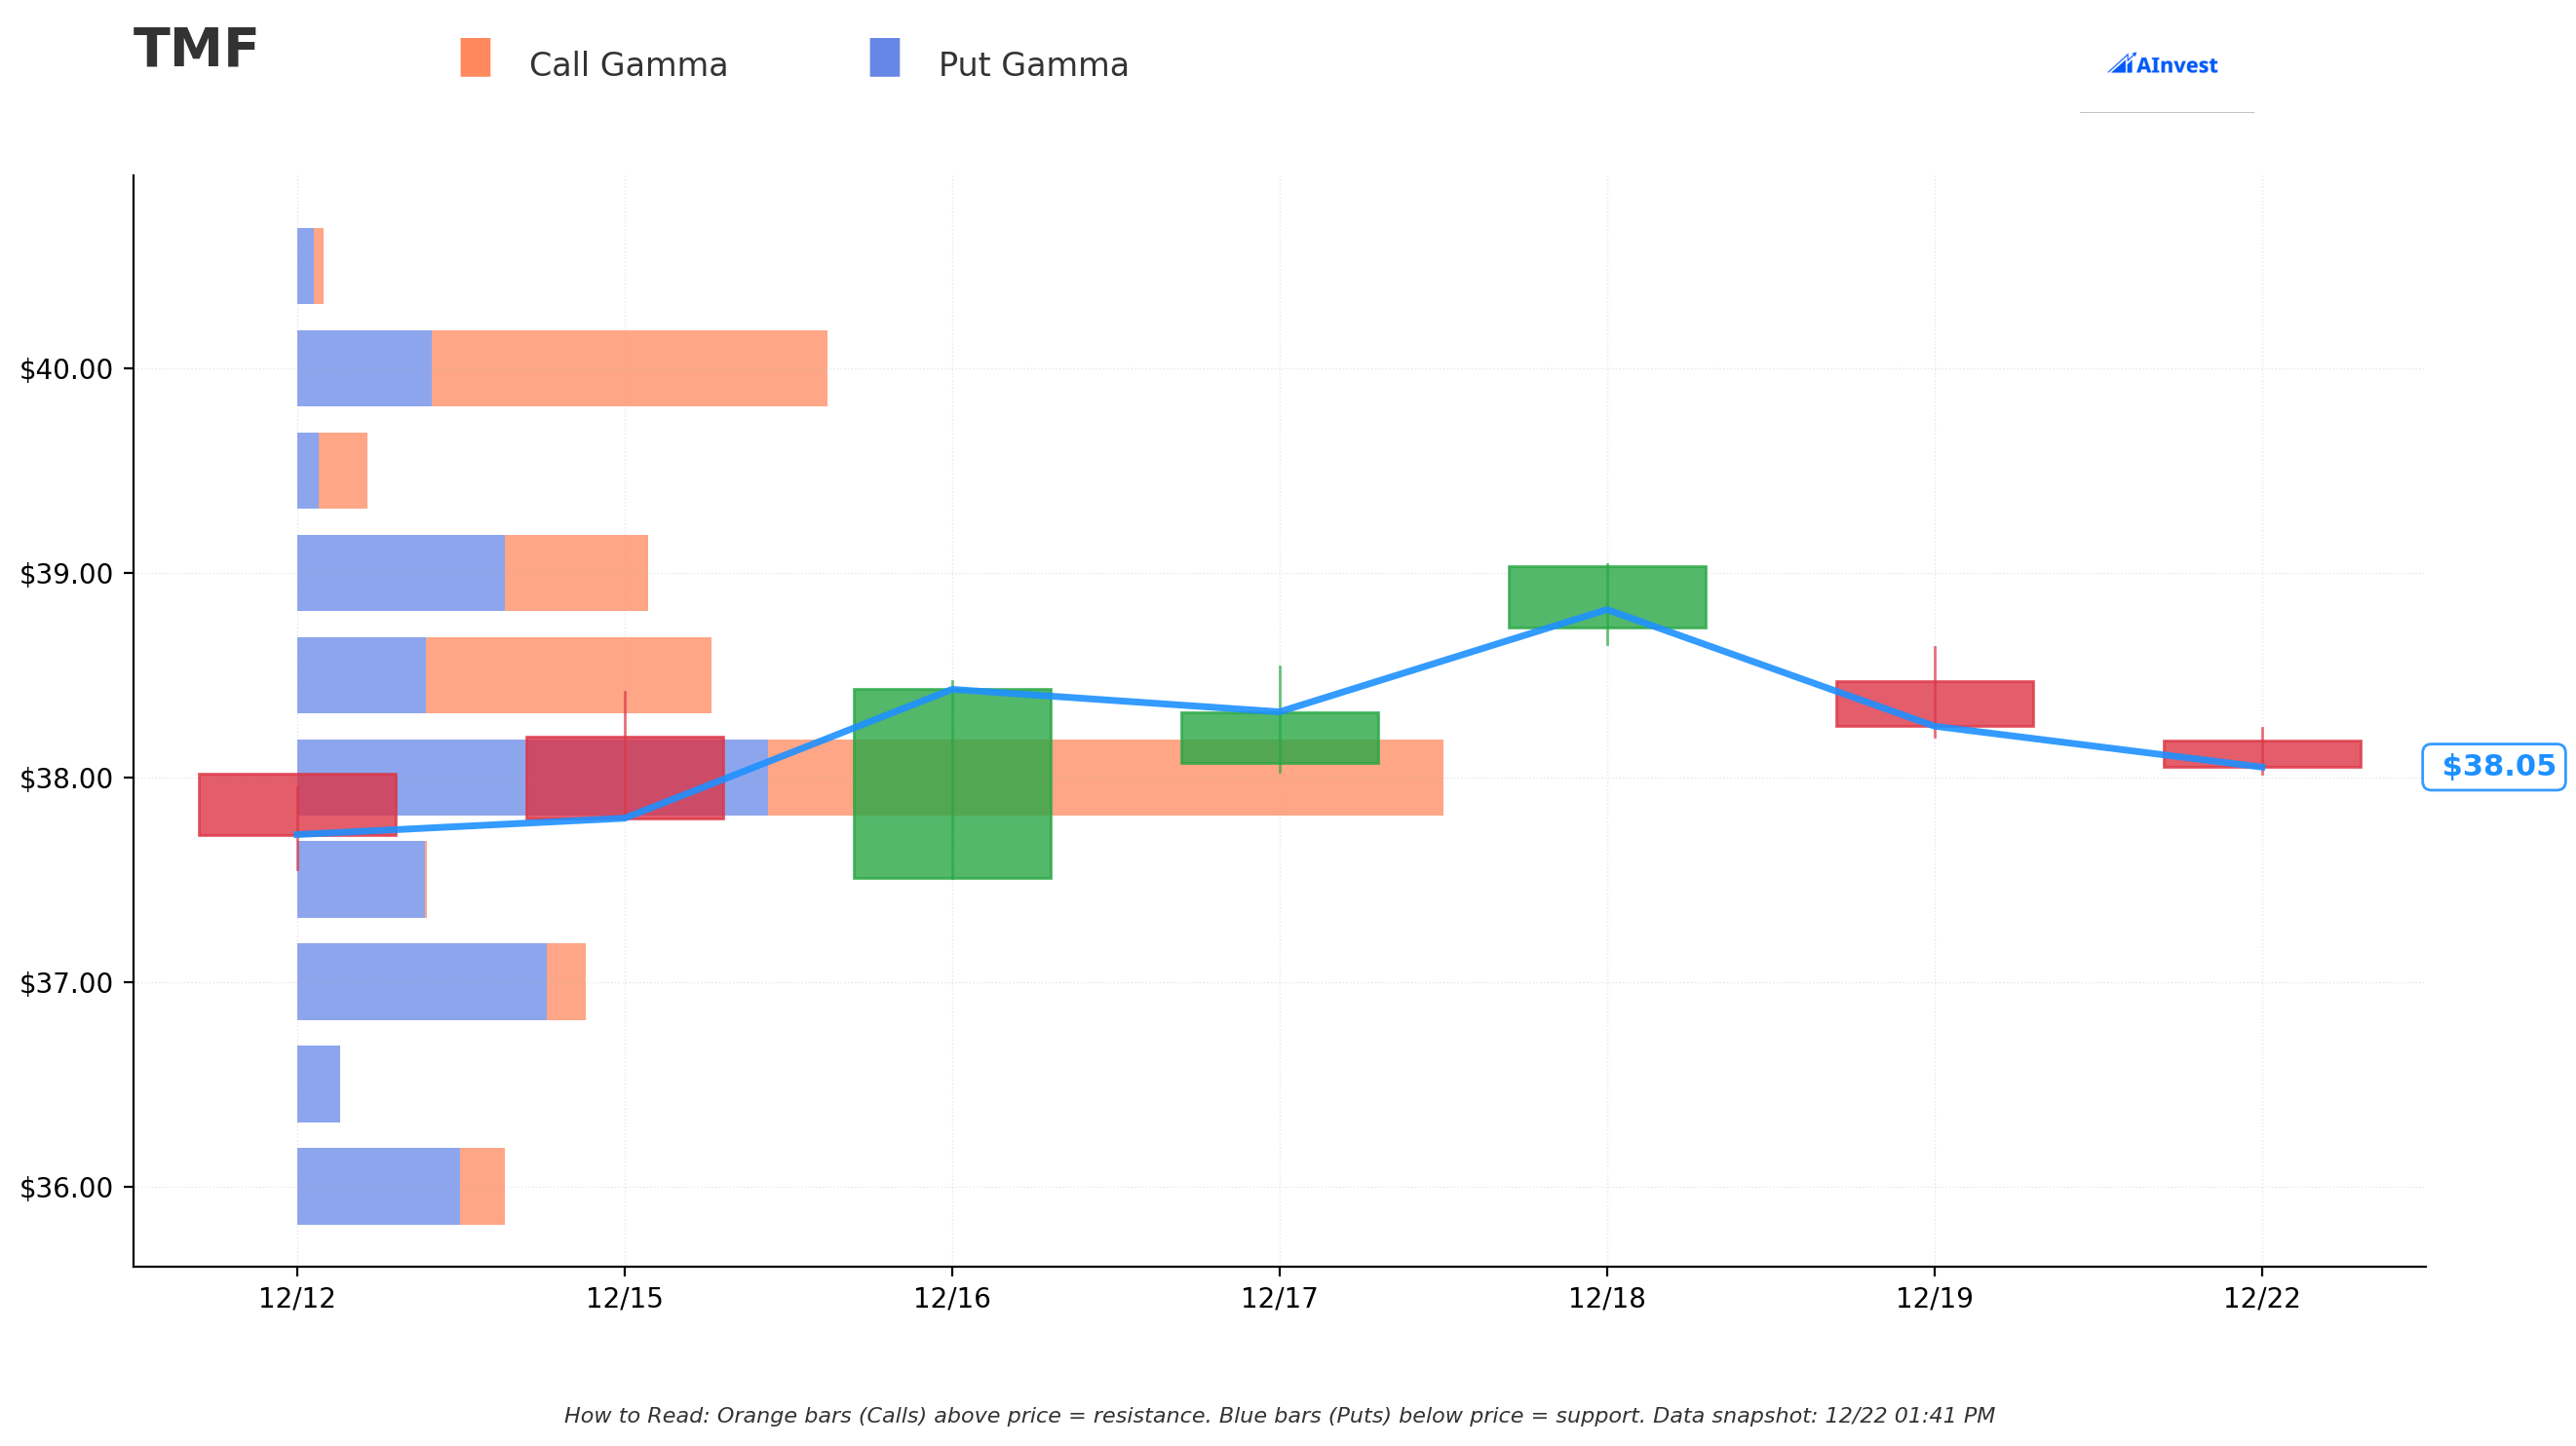
Key Gamma Levels:
🔵 Support Zones (Put Gamma Dominates):
-
$38.00 - Strongest Support (Total GEX: $16.14M) - Just 0.15% below current price, this is the major battleground. Heavy put gamma here means market makers will support prices as they hedge their short put positions. Call GEX of $9.45M vs put GEX of $6.69M creates net positive gamma that should provide price stability.
-
$37.50 (Total GEX: $1.84M) - Secondary support 1.47% lower, dominated by put gamma ($1.82M puts vs just $0.02M calls). Clean put wall here.
-
$37.00 (Total GEX: $4.10M) - Third support level 2.78% down, with $3.54M in put gamma providing a cushion. This represents roughly -3% from current levels.
-
$36.00 (Total GEX: $2.79M) - Fourth support at -5.4%, moderate put gamma concentration
-
$35.00 (Total GEX: $2.86M) - Fifth support at -8.0%, last major defense before more serious breakdown
🟠 Resistance Zones (Call Gamma Dominates):
-
$38.50 - Nearest Resistance (Total GEX: $5.97M) - Just 1.16% above current price with $4.14M in call gamma. This is where the institutional call sellers will start feeling pressure if TMF rallies. The $2.31M net positive gamma suggests some two-way action here.
-
$39.00 (Total GEX: $5.00M) - Secondary resistance 2.47% higher, with $2.95M put gamma actually exceeding $2.06M call gamma (net negative). This creates a more complex dynamic.
-
$40.00 - Major Resistance (Total GEX: $7.58M) - Critical level 5.10% above current price with $5.67M in call gamma. Breaking through $40 would require substantial buying pressure to overcome this wall. The $25.6M in institutional call selling clustered well below this level ($20-$30 strikes) suggests big money doesn't expect TMF to threaten $40 by January expiration.
-
$41.00 (Total GEX: $2.06M) - Additional resistance at +7.7%
-
$42.00 (Total GEX: $1.53M) - Fifth resistance at +10.4%
Net GEX Bias: Slightly bullish ($31.13M call GEX vs $30.09M put GEX), but the positioning is defensive. The gamma profile suggests TMF should trade in a $37-$40 range through January expiration, which aligns perfectly with the institutional covered call strategy we saw in the flow.
Implied Move Analysis
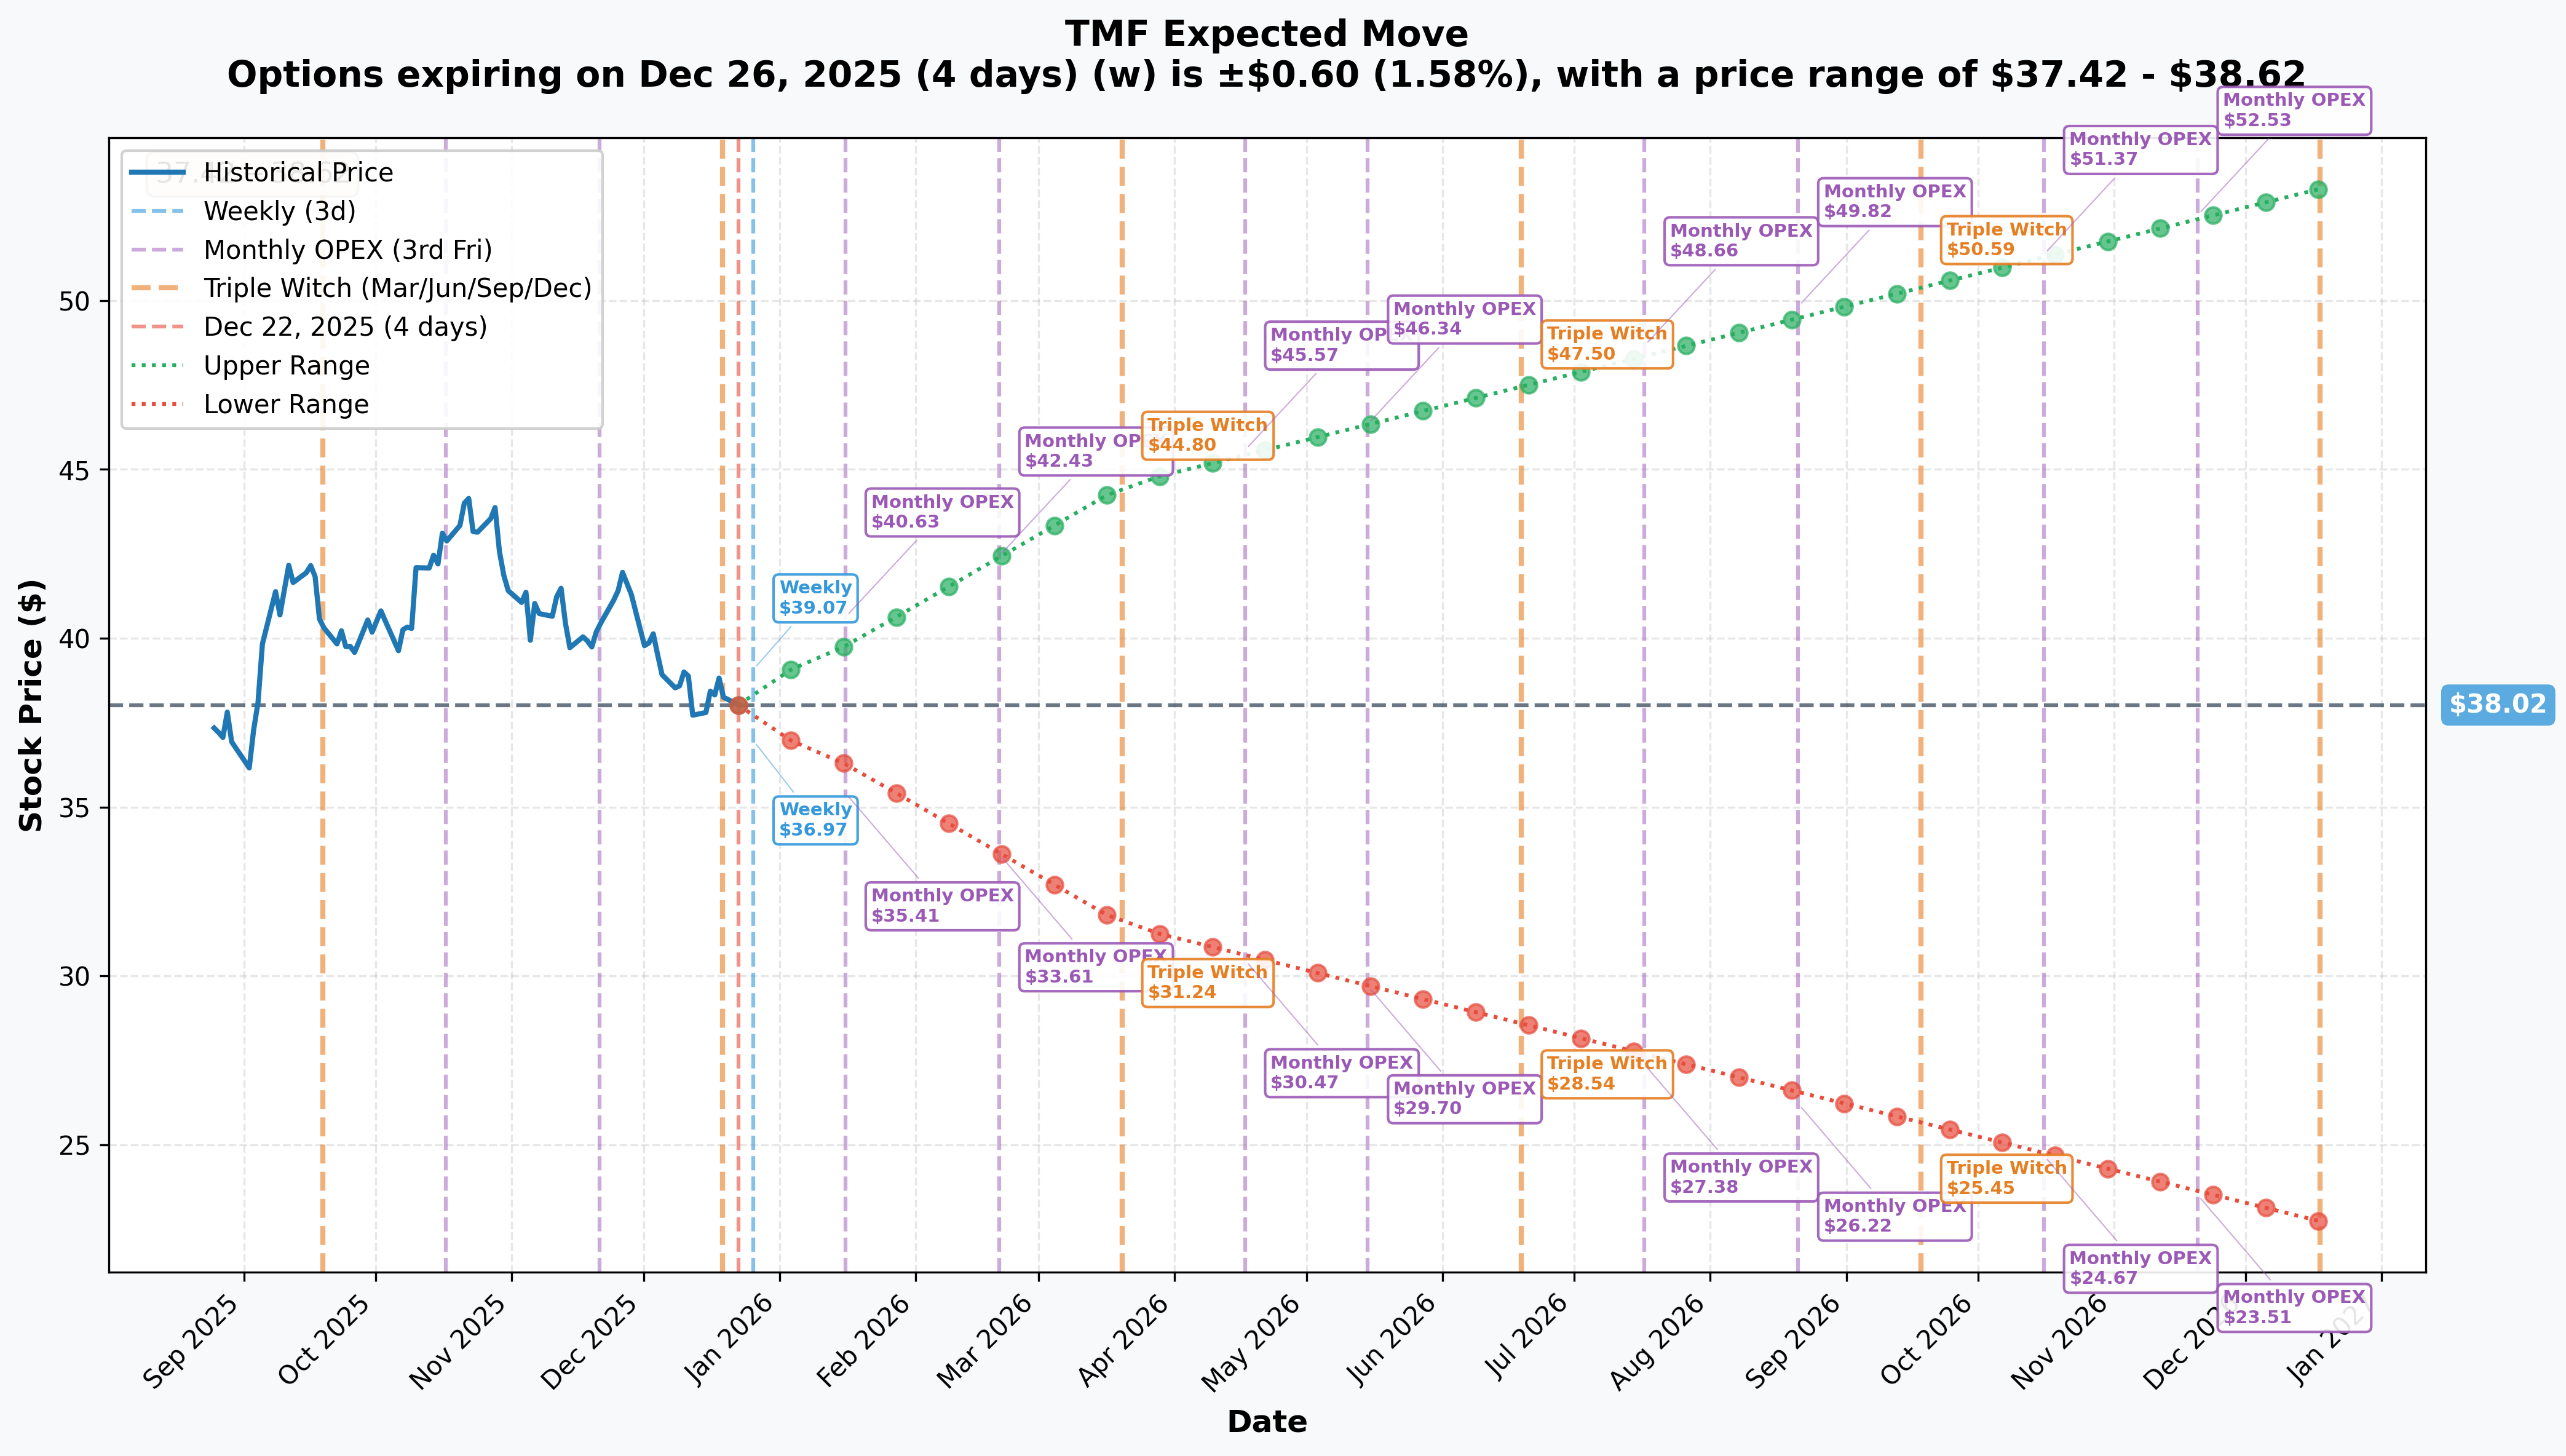
Market-Implied Price Ranges:
📅 Weekly (Dec 26, 2025) - 4 days to expiration
- Implied Move: ±1.58% (±$0.60)
- Expected Range: $37.42 - $38.62
- This narrow range suggests low expected volatility through year-end as markets await January Fed meeting
📅 Monthly OPEX (Jan 16, 2026) - 25 days to expiration
- Implied Move: ±4.68% (±$1.78)
- Expected Range: $36.24 - $39.80
- Critical Insight: The institutional call sales at $25, $30 are all well below even the lower bound of this range. Options market sees minimal probability TMF trades below $36.24 by January expiration, meaning those deep ITM calls will almost certainly be exercised. This is pure premium collection against long stock positions.
📅 Quarterly Triple Witch (Mar 20, 2026) - 88 days
- Implied Move: ±17.15% (±$6.52)
- Expected Range: $31.50 - $44.54
- Much wider range captures potential volatility from Fed meetings, economic data, and Treasury auction results
📅 Yearly LEAPS (Dec 18, 2026) - 361 days
- Implied Move: ±40.27% (±$15.31)
- Expected Range: $22.71 - $53.33
- This massive 12-month range reflects TMF's extreme volatility (7.01 beta) and binary outcomes: recession forcing aggressive Fed cuts could drive TMF toward $50+, while persistent inflation keeping yields elevated could push TMF toward $25-$30 range
Key Takeaway: The January implied move of $36.24-$39.80 perfectly brackets the current gamma support/resistance structure and validates the institutional covered call strategy. With 75.6% probability the Fed holds rates unchanged at the January 27-28 meeting, options pricing suggests TMF remains range-bound through expiration.
🎪 Catalysts
Already Happened (Past 3 Months)
✅ Fed Rate Cut - December 10, 2025
- 25 basis point cut delivered (3.50%-3.75% range)
- But hawkish forward guidance shocked markets - dot plot showed just ONE 2026 cut
- Fed Chair Powell stated "We haven't made any decision about January" - cautious stance
- Impact: Negative for TMF as easing cycle curtailed
✅ Treasury Yield Surge
- 20-year yields climbed to 4.77%-4.78% as of December 19
- December yield curve steepening: 10-year +40 bps, 2s/10s spread +31 bps
- Direct inverse relationship to TMF price given 3x leveraged long exposure
- Impact: Major headwind for TMF performance
✅ Persistent Inflation
- November CPI: 2.7% YoY, core 2.6%
- Core PCE (Fed's preferred measure) at 2.8%, stuck above 2% target
- Trump tariffs adding 0.5-0.7pp to inflation, more pass-through expected
- Impact: Keeps Fed from aggressive easing, pressuring Treasuries
✅ Massive Fund Outflows
- Three consecutive weeks of heavy redemptions totaling $600M+
- Week 1: $280M outflow (-4.9% shares outstanding)
- Week 2: $160M outflow (-3.1% shares)
- Week 3: $174M outflow (-3.5% shares)
- Impact: Technical selling pressure from forced liquidations
Upcoming (Next 6 Months)
🔮 FOMC Meeting - January 27-28, 2026 ⭐⭐⭐⭐⭐
- 75.6% probability of NO CHANGE at current 3.5%-3.75% range
- Policy statement 2:00 PM ET Jan 28, followed by Powell press conference 2:30 PM ET
- Jerome Powell's term expires May 15, 2026 - potential policy uncertainty
- Potential Impact: If Fed holds as expected, TMF faces continued pressure; surprise cut would provide short-term rally catalyst
🔮 Inflation Reports - January-March 2026 ⭐⭐⭐⭐
- December CPI release expected mid-January - critical for tariff impact assessment
- Monthly PCE releases determine if core can trend toward 2% target or stays stuck at 2.8%
- University of Michigan sentiment showed 4.2% year-ahead inflation expectations
- Potential Impact: Lower readings boost rate cut probabilities (bullish TMF); upside surprises severely negative
🔮 Treasury Auction Schedule - January 2026 ⭐⭐⭐
- 20-year bond reopenings and 30-year auctions typically in first half of month
- Weekly bill auctions provide continuous liquidity data
- Nearly $3 trillion U.S. debt maturing in 2026 creates refinancing needs
- Potential Impact: Weak demand (high yields, low bid-to-cover) pressures TMF; strong demand provides support
🔮 Recession Indicators - Q1 2026 ⭐⭐⭐⭐
- 30-42% recession probability for 2026 per major forecasters (vs 15% historical baseline)
- GDP forecasts: 1.9-2.2% real growth with most in H1 2026
- Labor market showing "dead calm" combination - low unemployment but weakest hiring in decades
- Inverted yield curve historically predicts recessions
- Potential Impact: Recession would trigger aggressive Fed cuts (major TMF catalyst); soft landing keeps status quo
🔮 Foreign Treasury Demand Dynamics ⭐⭐⭐
- Foreign investors hold $9T (32% of marketable Treasuries), down from 50%+ peak
- Foreign official institutions reduced dollar reserves $113B since September
- Rising cross-currency hedging costs creating headwinds
- Potential Impact: Increased foreign buying supports TMF; continued selling pressures yields higher
🎲 Price Targets & Probabilities
Based on gamma levels, implied moves, catalysts, and institutional positioning, here's how TMF could trade:
🐂 Bull Case - "Recession Rescue" (20% probability)
Target: $42-44 by March 2026
Economic data deteriorates sharply (unemployment spikes, consumer spending collapses), forcing Fed to abandon hawkish stance and implement emergency rate cuts. Market prices 3-4 cuts in 2026 instead of projected 1 cut. Long-duration Treasury yields plunge 50-75 bps, amplified 3x by TMF's leverage.
Key Levels:
- Break above $40.00 resistance (strong call gamma wall)
- Next target $41-42 zone
- Quarterly implied move upper bound: $44.54
Catalysts Required:
- Weak January/February jobs reports
- Sharp decline in consumer confidence
- Fed policy pivot with dovish language
- Flight-to-safety Treasury buying
Probability Assessment: Low (20%) - requires significant economic deterioration that current data doesn't show. Moody's chief economist warns "no room for error" but base case remains soft landing, not recession.
📊 Base Case - "Range-Bound Grind" (60% probability)
Target: $36-39 through January, $34-40 by March
Fed delivers on dot plot guidance with 1-2 rate cuts in 2026, starting no earlier than March/June. Inflation moderates slowly but stays above 2% target through Q1. Treasury yields trade sideways in 4.5-5.0% range for 20-year duration. TMF remains trapped between strong support at $36-38 and resistance at $39-40.
Key Levels:
- Support: $38.00 (strongest gamma level), then $37.50, $37.00
- Resistance: $38.50, $39.00, $40.00
- Monthly implied move range: $36.24-$39.80 aligns perfectly
Catalysts Driving This:
- Fed holds at January 27-28 meeting (75.6% priced probability)
- Inflation data comes in mixed, neither hot nor cold
- Moderate Treasury auction demand
- Continued TMF fund outflows create technical drag
Probability Assessment: High (60%) - this is what the institutional covered call sellers are betting on. Their strikes at $20-$30 profit handsomely if TMF stays in this range, which market-implied volatility confirms.
🐻 Bear Case - "Stagflation Spiral" (20% probability)
Target: $32-34 by March 2026
Inflation re-accelerates from tariff pass-through, forcing Fed to pause easing cycle indefinitely or even hike rates. 20-year Treasury yields break above 5.0% as foreign selling intensifies and $3T debt refinancing swamps market. TMF's leverage magnifies losses as duration pain intensifies.
Key Levels:
- Break below $37.00 support triggers stop-losses
- Next support $36.00, then $35.00
- Quarterly implied move lower bound: $31.50
Catalysts Required:
- January/February CPI prints at 3.0%+ YoY
- Fed hawkish rhetoric, no cuts through Q1-Q2
- Weak Treasury auctions with rising yields
- Continued fund outflows accelerate
Probability Assessment: Moderate (20%) - Atlanta Fed research shows tariffs explain 40% of cost growth, creating real stagflation risk. However, Fed has already priced this in, limiting downside surprise potential.
💡 Trading Ideas
🛡️ Conservative - "Premium Collection Defense"
Strategy: Sell TMF cash-secured puts at $36 strike, January 2026 expiration
Rationale: With strongest gamma support at $38 and implied move lower bound at $36.24, selling puts at $36 offers attractive risk-reward. You collect premium while positioning to potentially own TMF at a 5.4% discount to current levels if assigned.
Setup:
- Sell TMF Jan 16, 2026 $36 Put (estimate ~$0.80-1.20 premium based on 4.68% implied move)
- Cash requirement: $3,600 per contract
- Break-even: ~$34.80-35.20 (depending on premium collected)
- Return if unassigned: 2.2-3.3% in 25 days (annualized 33-48%)
Why This Works: TMF would need to drop 5.4% below current price to reach $36, requiring either a surprise hawkish Fed pivot or major Treasury selloff. The strong gamma support structure and institutional covered call positioning suggest this is unlikely. Even in bear case, $35 represents fifth support level with substantial put gamma protection.
Risk Management:
- Maximum loss: $3,600 per contract minus premium if TMF crashes to zero (extremely unlikely for a Treasury ETF)
- Be prepared to own TMF at effective cost basis of $34.80-35.20
- Only deploy if you're bullish on long-term Treasury prospects
Probability of Profit: ~70-75% based on $36 being below January implied move range
⚖️ Balanced - "Range-Bound Iron Condor"
Strategy: Iron Condor targeting the $36-40 range through January expiration
Setup:
- Sell TMF Jan 16 $40 Call / Buy Jan 16 $42 Call (credit spread)
- Sell TMF Jan 16 $36 Put / Buy Jan 16 $34 Put (credit spread)
- Net credit collected: Estimate $0.60-1.00 per spread
- Capital at risk: $200 - credit collected = $140-160 per spread
Why This Works: The institutional flow, gamma levels, and implied move data all point to TMF trading between $36-40 through January. You profit if TMF stays in this range:
- Upper boundary: $40 resistance with $7.58M call gamma + institutional covered calls
- Lower boundary: $36 support with $2.79M total gamma
- Implied move: $36.24-39.80 fits perfectly within iron condor wings
- Fed likely holds at Jan 27-28 meeting, reducing volatility catalyst risk
Risk-Reward:
- Maximum profit: $60-100 per spread (if TMF between $36-40 at expiration)
- Maximum loss: $140-160 per spread (if TMF breaks out either direction)
- Return on risk: 37-71% in 25 days if TMF stays range-bound
Adjustment Plan:
- If TMF approaches $40, close call spread early and let put spread expire
- If TMF approaches $36, close put spread and let call spread expire
- Consider taking profits at 50% of max gain (~$30-50) to reduce risk
Probability of Profit: ~60% based on base case scenario and range-bound expectations
🚀 Aggressive - "Volatility Expansion Straddle"
Strategy: Long straddle targeting the January FOMC meeting volatility
Setup:
- Buy TMF Jan 16 $38 Call
- Buy TMF Jan 16 $38 Put
- Total debit: Estimate $3.00-3.50 based on 4.68% implied move
- Break-even points: $34.50-35.00 (downside) and $41.00-41.50 (upside)
Why This Works: If you believe the market is underpricing the January 27-28 FOMC meeting volatility, a straddle captures profit from big moves in either direction:
Bull Scenario: Fed surprises with dovish pivot, TMF rallies to $42-44
- Call profit: $4-6 per contract
- Put loss: Limited to $1.50-1.75 premium paid
- Net gain: $2.25-4.25 per straddle
Bear Scenario: Inflation data forces hawkish Fed stance, TMF drops to $34-35
- Put profit: $3-4 per contract
- Call loss: Limited to $1.50-1.75 premium paid
- Net gain: $1.25-2.25 per straddle
What Could Go Wrong: This is a bet against the 60% base case of range-bound trading. If TMF stays between $36-40 through expiration, both options expire worthless and you lose the full $3.00-3.50 premium paid per straddle. The implied volatility is already pricing a 4.68% move, so you need TMF to move MORE than $1.78 in either direction to profit.
Risk Management:
- Maximum loss: $300-350 per straddle if TMF stays near $38
- Consider taking profits early if TMF makes a 5%+ move before expiration
- Watch for post-FOMC volatility crush (Jan 28) - may want to exit before meeting
Probability of Profit: ~40% - this is a contrarian bet that something unexpected happens (recession data OR inflation spike)
Better Aggressive Alternative: If you're directionally bullish on recession scenario, skip the straddle and just buy $40-42 call spreads for March expiration, targeting the quarterly implied move of $44.54. Lower cost, defined risk, higher leverage to bull case.
⚠️ Risk Factors
Leveraged ETF Decay Risk 🎢 TMF's 3x daily rebalancing creates volatility drag in choppy markets. The mathematical erosion formula (Geometric mean = Arithmetic mean - StdDev²/2) means TMF underperforms even if underlying 20+ year Treasuries are flat over time. Five leveraged inverse ETFs lost 80%+ in 2025 due to extreme volatility. TMF is designed for short-term tactical trades (days to weeks), not buy-and-hold positions.
Hawkish Fed Policy Risk 🦅 Fed's December dot plot projects just ONE rate cut in 2026, drastically limiting the easing cycle. If inflation remains sticky at 2.6-2.8%, the Fed could pause rate cuts indefinitely or even pivot back to hikes. Chair Powell's "wait and see" approach creates uncertainty and potential for sharp policy reversals based on individual data prints.
Persistent Tariff-Driven Inflation 📈 Trump tariffs added 0.5-0.7 percentage points to inflation, with more pass-through expected in 2026. The effective tariff rate hit 11.2% (highest since 1943), and J.P. Morgan estimates average rates at 23%+. This $400B revenue impact (1.3% of GDP) represents the largest tax increase since 1968, keeping inflation elevated and preventing aggressive Fed easing.
Foreign Treasury Selling Pressure 🌍 Foreign official institutions reduced Treasury holdings by $113B since September, coinciding precisely with the yield reversal. While foreign private demand remains robust, continued official selling creates marginal pressure on prices. Rising cross-currency hedging costs add further headwinds to foreign demand.
Stock-Bond Correlation Breakdown 💔 The traditional 25-year stock-bond correlation broke down in 2025, with Treasuries failing to rally despite equity drops and recession fears. April 2025 saw "rare and jarring volatility" across both asset classes following Trump's tariff announcements. This eliminates the traditional flight-to-safety bid that would normally support TMF during equity market stress.
Debt Refinancing Tsunami 🌊 With nearly $3 trillion in U.S. debt maturing in 2026 and the national debt at $37 trillion, there are legitimate questions about Treasury market absorption capacity. Weak auction demand could force yields higher even if the Fed cuts rates, creating a toxic environment for long-duration bonds.
Extreme Volatility Profile ⚡ TMF's 7.01 beta means it experiences 7x the volatility of broad market indices. The 20+ year Treasury bonds underlying TMF have duration of 17-20 years; the 3x leverage magnifies interest rate sensitivity dramatically. A 10 basis point move in yields can trigger 3-5% swings in TMF daily. Position sizing must reflect this extreme volatility to avoid catastrophic losses.
🎯 The Bottom Line
Real talk: The $25.6M institutional covered call sale tells us everything we need to know about where smart money sees TMF heading - nowhere fast.
These aren't speculative trades by retail gamblers. When institutions sell 49,000 call contracts at strikes 21-47% below current price, they're betting on range-bound trading or modest weakness through January expiration. The setup profits if TMF stays flat, drifts lower, or even rallies moderately - they only lose if TMF absolutely explodes higher past the strikes plus premium collected.
The market structure confirms this bearish/neutral view:
- ✅ Strong gamma support at $38 but resistance at $40 creates defined range
- ✅ Implied move of $36.24-39.80 brackets current price tightly
- ✅ 75.6% probability Fed holds at January meeting reduces volatility catalyst
- ✅ Sustained $600M+ fund outflows signal institutional rotation away from long-duration exposure
If you own TMF: Consider following the institutional playbook - sell covered calls at $40-42 strikes to collect premium and cap your upside. The risk-reward doesn't favor holding naked long exposure given hawkish Fed stance and persistent inflation. Alternatively, tighten stops below $37 support.
If you're watching TMF: The attractive entry point would be on a breakdown below $36 support IF accompanied by clear recession signals (unemployment spike, consumer spending collapse). That scenario could force aggressive Fed cuts and create the 40-60% rally potential that TMF's leverage delivers. Until then, the path of least resistance is sideways-to-lower.
If you're bearish: The institutional covered call strategy makes more sense than buying puts outright. Selling call credit spreads (like $40-42 for January) offers better risk-reward than paying premium for puts, especially given the volatility decay characteristics of this leveraged ETF.
Mark Your Calendar: 📅
- January 16, 2026 - Monthly options expiration (watch for gamma unwind)
- January 27-28, 2026 - FOMC meeting (75.6% hold probability, but watch for surprises)
- Mid-January 2026 - December CPI release (critical inflation data)
The Lesson: When you see nine-figure premium collection in covered calls, institutions are signaling their base case. They're not betting on fireworks - they're collecting income in an expected low-volatility environment. Trade accordingly, size positions for TMF's extreme volatility (7.01 beta), and remember this is a tactical trading vehicle, not a long-term investment.
⚠️ Disclaimer: Options trading involves substantial risk and is not suitable for all investors. TMF is a 3x leveraged ETF that uses daily rebalancing and is designed for short-term trading, not buy-and-hold strategies. Leveraged ETFs can lose value over time due to volatility decay even if the underlying asset is flat. The analysis above is for educational purposes only and does not constitute financial advice. Past performance does not guarantee future results. Always conduct your own due diligence and consider consulting with a licensed financial advisor before making investment decisions.
Analysis generated December 22, 2025 | Data sources: ThetaData, Yahoo Finance, Federal Reserve, Tax Foundation, CNBC | Options flow detected via institutional block trade monitoring