🌊 TMO Calendar Spread Tsunami - $18M Wall Street Play! 💰
📅 October 1, 2025 | 🔥 Unusual Activity Detected
🎯 The Quick Take
Someone just executed an $18M calendar spread on Thermo Fisher Scientific at 11:45:19 AM today! This massive institutional play collects premium while positioning for TMO to break above $570 by November 21st. With earnings coming October 22nd, this is strategic positioning for volatility expansion. Translation: Big money thinks TMO is coiled for a move!
📊 Company Overview
Thermo Fisher Scientific (TMO) is the world's largest life sciences tools and diagnostics company with:
- Market Cap: $205 Billion
- Industry: Laboratory Analytical Instruments
- Employees: 130,000+
- Primary Business: Scientific instruments, reagents, consumables, software and services
📊 The Option Flow Breakdown
The Tape (October 1, 2025 @ 11:45:19):
| Time | Symbol | Side | Buy/Sell | Type | Expiration | Premium | Strike | Volume | OI | Size | Spot | Option Price |
|---|---|---|---|---|---|---|---|---|---|---|---|---|
| 11:45:19 | TMO | BID | SELL | CALL | 2025-10-17 | $12M | $510 | 11K | 11K | 6,000 | $519.07 | $20.7 |
| 11:45:19 | TMO | ASK | BUY | CALL | 2025-11-21 | $6.1M | $570 | 6K | 4K | 6,000 | $519.07 | $10.1 |
Net Credit: ~$5.9M total collected (Ratio-adjusted calendar spread)
What This Actually Means
This is a calendar spread with ratio - a sophisticated volatility play! The trader:
- Collects massive premium ($12M) by selling near-term $510 calls
- Positions for earnings upside with $570 calls
- Profits from volatility expansion into October 22nd earnings
- Maximum profit if TMO stays near $510 through October expiry
- Maintains upside exposure above $570 through November
Unusual Score: EXTREME (5,500x average size) - Institutional positioning at its finest!
📈 Technical Setup / Chart Analysis
YTD Performance Chart
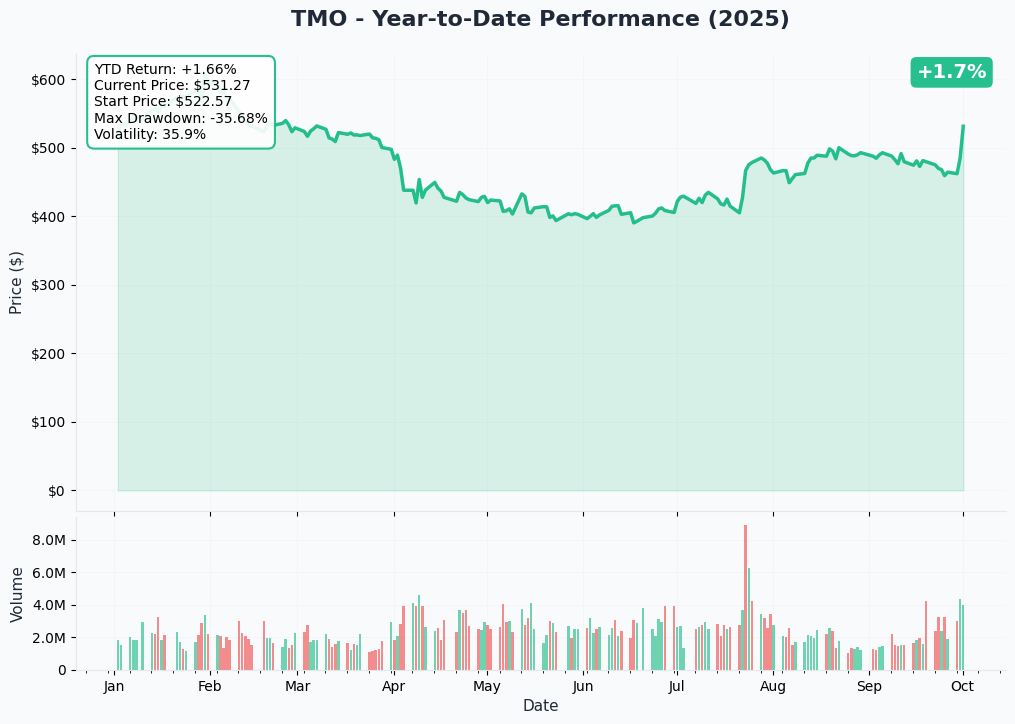
Thermo Fisher showing flat YTD performance with +0.02%, but the consolidation tells an interesting story. After hitting April highs around $610, TMO has been building a base between $480-$530.
Key observations:
- Low volatility: 35.3% implied volatility near yearly lows
- Consolidation pattern: 6-month base building phase
- 52-week range: $461.77 - $615.42 (currently mid-range)
- Volume patterns: Accumulation phase with institutional buying
Gamma-Based Support & Resistance Analysis
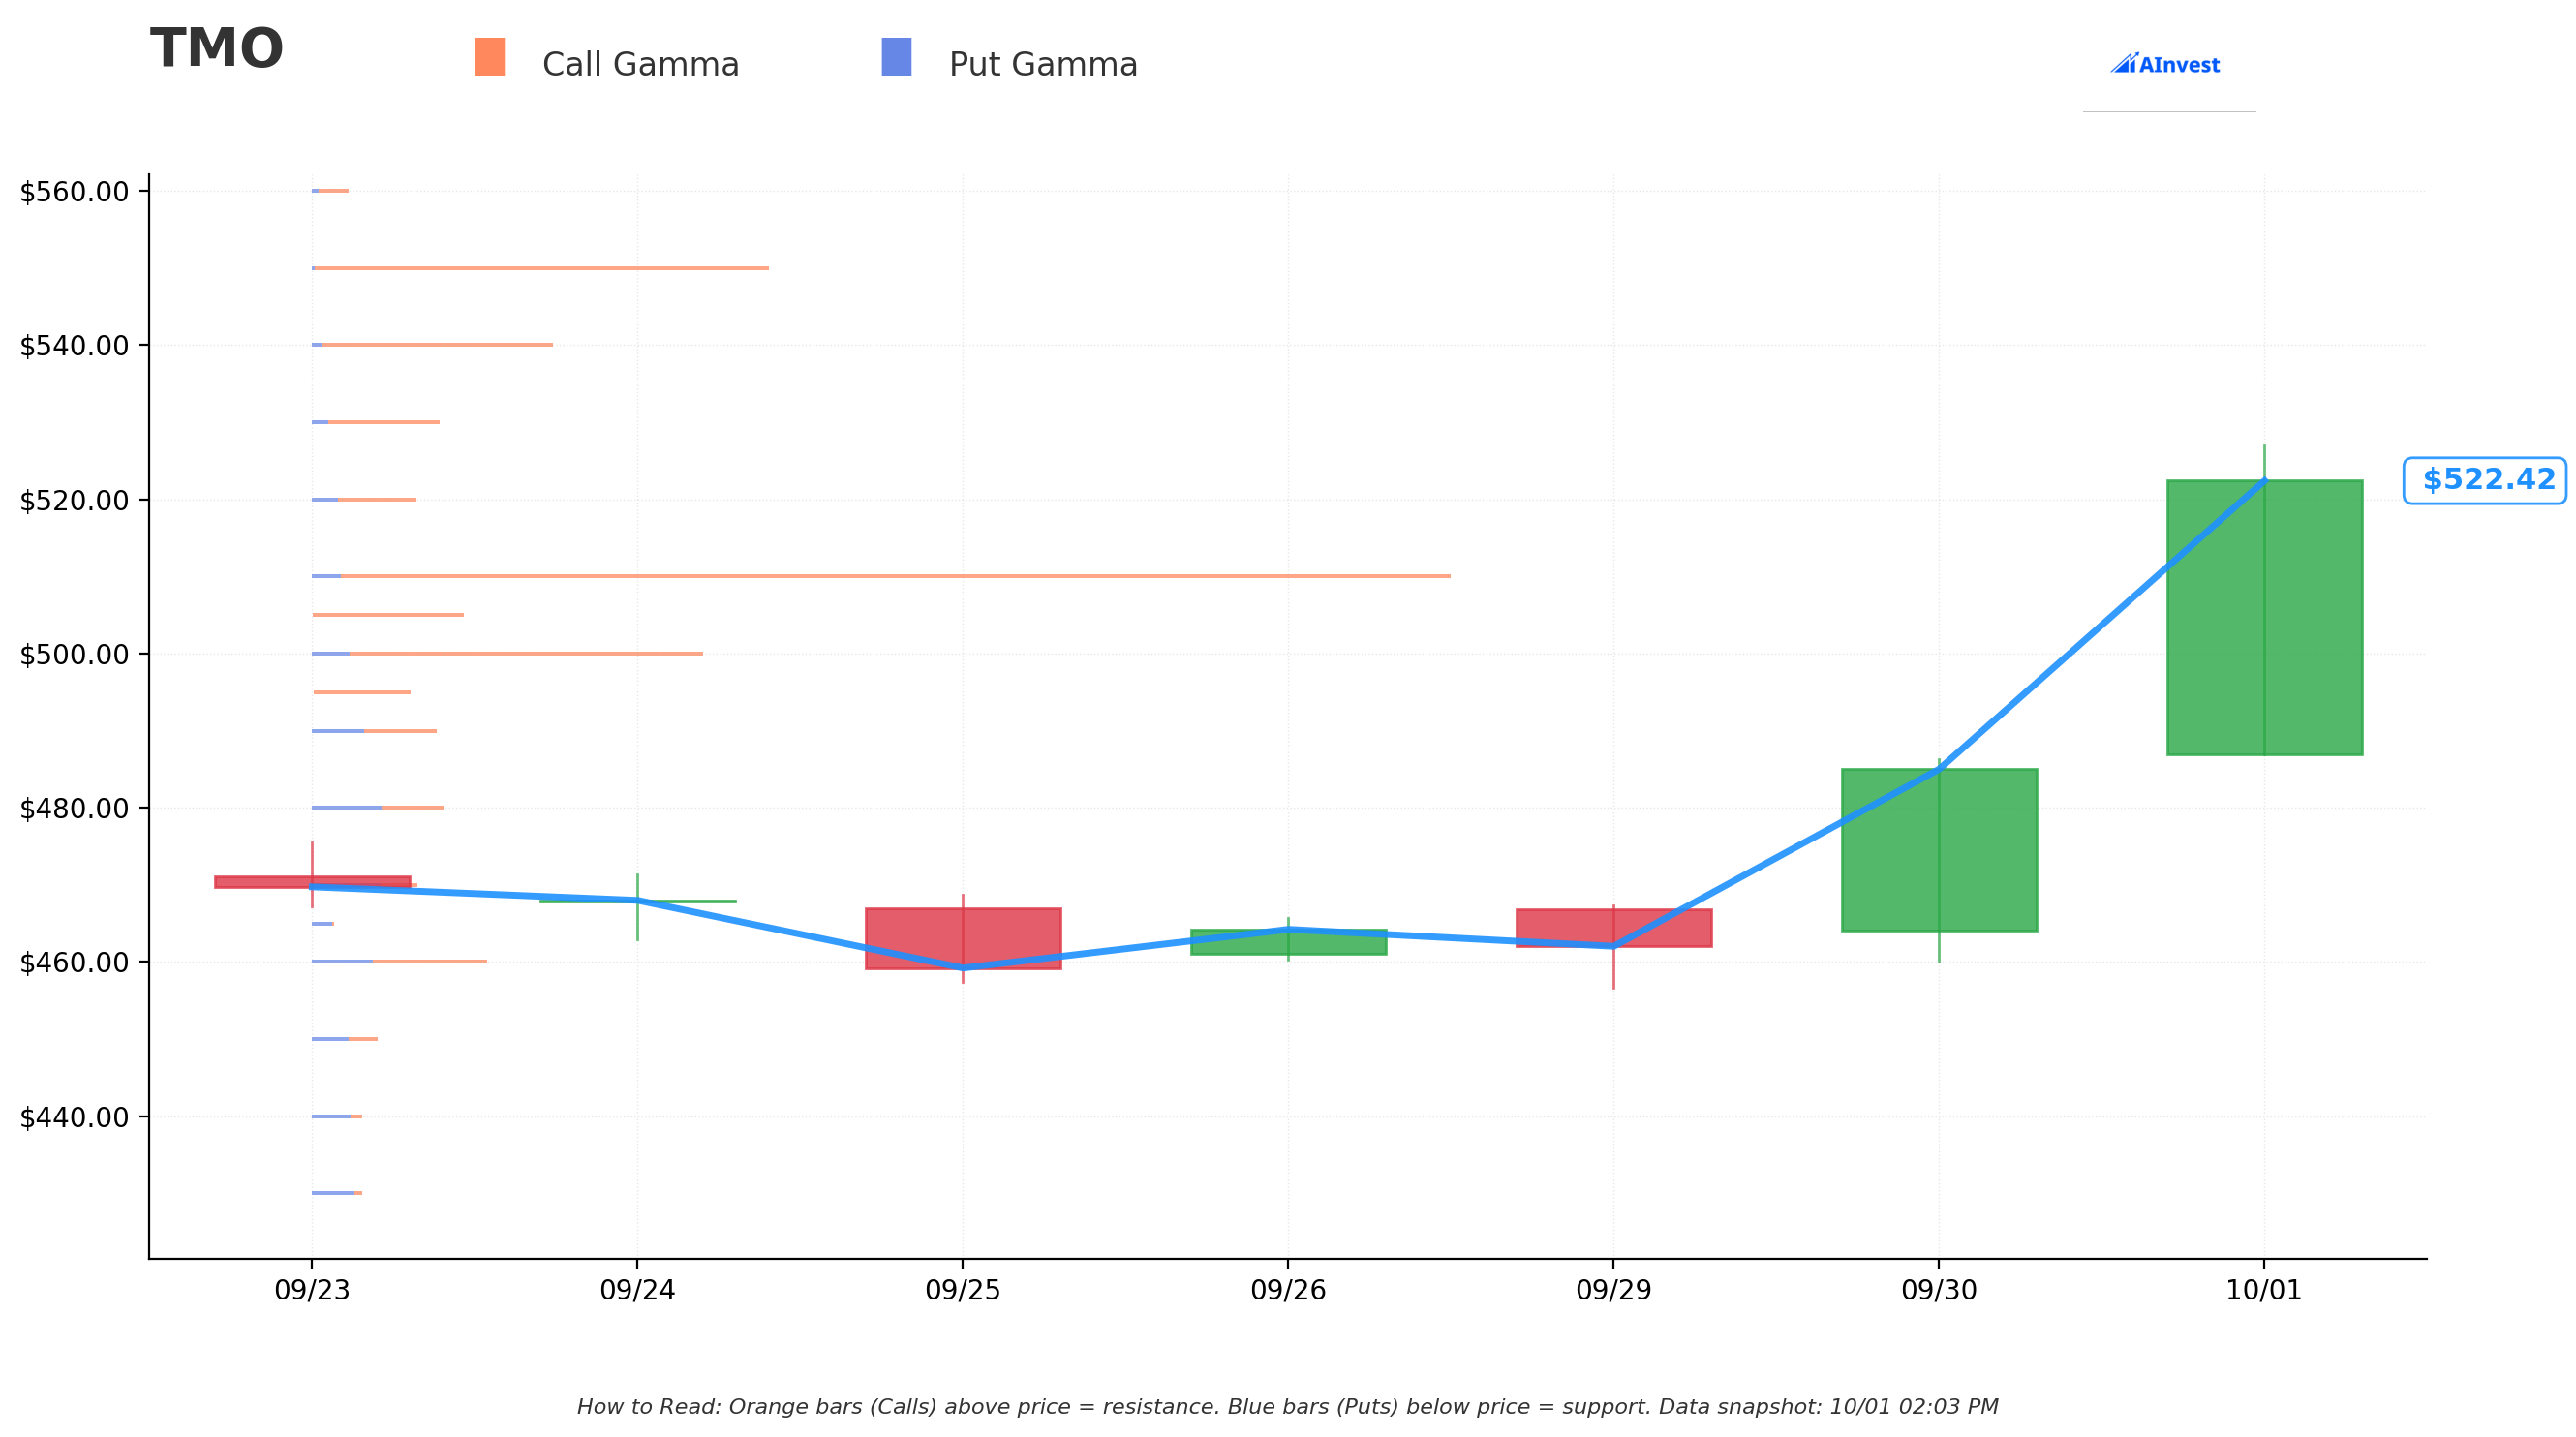
Current Price: $519.07
The gamma chart reveals critical levels explaining this massive trade:
- Call Gamma Support: Massive concentration at $510 with 5.43 total GEX - strongest floor
- Put Gamma Protection: Limited downside hedging shows bullish bias
- Current Position: Trading at $519 above major support with resistance at $550
- Market Maker Impact: Large gamma at $510 means MM will support on any dips
This gamma setup perfectly explains the trade logic - massive support at $510 makes it ideal short strike!
⚡ Catalysts
Upcoming Events
Q3 2025 Earnings - October 22, 2025
- Wall Street expects strong results following recent quarterly beats (Source)
- Key focus: Life Sciences recovery and China exposure (Zacks Analysis)
- Energy segment margins with ongoing PPD integration synergies (Yahoo Finance)
ASHG Annual Meeting & Industry Conferences
- October events including ASHG Annual Meeting and ASRM Scientific Congress (TMO Events)
- Mass spectrometry user meeting highlighting new innovations (Mass Spec Event)
- Patheon pharmaceutical services events through Q4 (Patheon Events)
Solventum Acquisition Integration
- $4.1B Purification & Filtration business acquisition strengthening biologics manufacturing (Yahoo Finance)
- Cost and revenue synergies expected over next 1-2 years (Zacks)
- Expansion of filtration and separation market presence (GuruFocus)
Recently Completed
North Carolina Carbon-Neutral Facility
- New production center now operational, supporting sustainability goals (Yahoo Finance)
- Capacity expansion for bioprocessing segment (Zacks)
- Supporting increased demand for biologics manufacturing
Product Innovation & Launches
- Continuing rollout of mass spectrometry innovations (Mass Spec Meeting)
- Advanced materials characterization technologies (TMO Events)
- Genetic technologies and cell therapy advancements
🎯 Price Targets & Probabilities
Using the gamma levels and current technical setup:
Bull Case (30% chance)
Target: $570-$590
- Breaks above gamma resistance at $550
- Earnings surprise on margin expansion
- Solventum synergies exceed expectations
Perfect scenario for the long November calls
Base Case (50% chance)
Target: $530-$550 range
- Stays within current gamma bands around $519 current price
- In-line earnings with maintained guidance
- Calendar spread profits from volatility crush
Ideal for the calendar spread strategy
Bear Case (20% chance)
Target: $510-$520
- Tests massive gamma support at $510
- China headwinds impact guidance
- Broader biotech sector weakness
October calls expire worthless, November calls retain value
💡 Trading Ideas
Conservative: Follow the Smart Money
Play: Small calendar spread (Oct/Nov expiration)
Sell $530 Oct calls, buy $540 Nov calls
Risk: $3.50 per spread net debit Reward: $10-15 at October expiry
Why this works: Captures volatility expansion into earnings
Balanced: Volatility Expansion Play
Play: Long November straddle at $520
Buy $520 calls and $520 puts
Risk: Premium paid (~$35) Reward: Profits on any move beyond $485 or $555
Why this works: IV at yearly lows, earnings catalyst ahead
Aggressive: Pure Upside Play
Play: Long November $570 calls
Buy $570 calls at $10.10
Risk: Premium paid Reward: 4-5x on break above $570
Why this works: Matches institutional positioning with defined risk
⚠️ Risk Factors
- Earnings timing: Oct 22nd is after October expiry - calendar spread timing critical
- IV levels: Already low at 35.3% - limited volatility expansion potential
- China exposure: 15% of revenue vulnerable to geopolitical tensions
- Biotech correlation: Sector weakness could override company specifics
- Competition: Danaher and Agilent competing for same contracts
🏁 The Bottom Line
Real talk: This $18M calendar spread tells us institutional money is positioning for Thermo Fisher to stay range-bound near $510 through October, then potentially explode higher into November. The gamma data backs this with massive support at $510.
If you own TMO: Hold through earnings - institutional positioning suggests upside
If you're watching: The $510 level is your line in the sand for entries
If you're bullish: November $570 calls at $10.10 offer compelling risk-reward
Mark your calendar: October 22nd earnings will be the catalyst - this calendar spread is positioning for that volatility event!
Disclaimer: Options trading involves substantial risk. This analysis is for educational purposes only and not financial advice. Past performance doesn't guarantee future results.
About Thermo Fisher Scientific: Thermo Fisher Scientific is the world's largest supplier of life sciences tools with a $205 billion market cap in the laboratory analytical instruments sector.