🎢 UPST Put Protection Avalanche - $9.9M Institutional Hedging! 💰
📅 September 30, 2025 | 🔥 Unusual Activity Detected
🎯 The Quick Take
Someone just dropped $9.9M on Upstart put options at 1:00:07 PM today! Two massive institutional trades targeting $52.50 and $47.50 strikes for October 17th expiration. With UPST currently at $51.10 and Q3 earnings coming November 6th, this looks like major protection ahead of uncertainty. Translation: Big money is buying insurance against a potential drop!
📊 Company Overview
Upstart Holdings, Inc. (UPST) is an AI-powered lending platform revolutionizing credit decisions with:
- Market Cap: $5.07 Billion
- Industry: Finance Services
- Primary Business: Cloud-based AI lending platform connecting borrowers with 100+ banks
- Key Innovation: AI models analyze 1,600+ data points vs traditional FICO's 15-20
📊 The Option Flow Breakdown
The Tape (September 30, 2025 @ 13:00:07):
| Time | Symbol | Side | Buy/Sell | Type | Expiration | Premium | Strike | Volume | OI | Size | Spot | Option Price |
|---|---|---|---|---|---|---|---|---|---|---|---|---|
| 13:00:07 | UPST | MID | BUY | PUT | 2025-10-17 | $6.7M | $52.5 | 22K | 17K | 15,984 | $51.1 | $4.17 |
| 13:00:07 | UPST | ABOVE ASK | BUY | PUT | 2025-10-17 | $3.2M | $47.5 | 21K | 646 | 15,984 | $51.1 | $1.99 |
Total Premium: $9.9M in defensive positioning
What This Actually Means
This is protective put buying - someone's hedging massive exposure! The trader:
- Bought near-the-money $$52.50 puts for immediate protection
- Added out-of-money $$47.50 puts for catastrophic insurance
- Both expire October 17th - right before Q3 earnings on November 6th
- The ABOVE ASK buying shows urgency - they wanted fills NOW
Unusual Score:
- $52.50 Put: VOLCANIC (2,668x average size) - This happens maybe once a year!
- $47.50 Put: EXTREME (1,274x average size) - Incredibly rare activity!
📈 Technical Setup / Chart Analysis
YTD Performance Chart
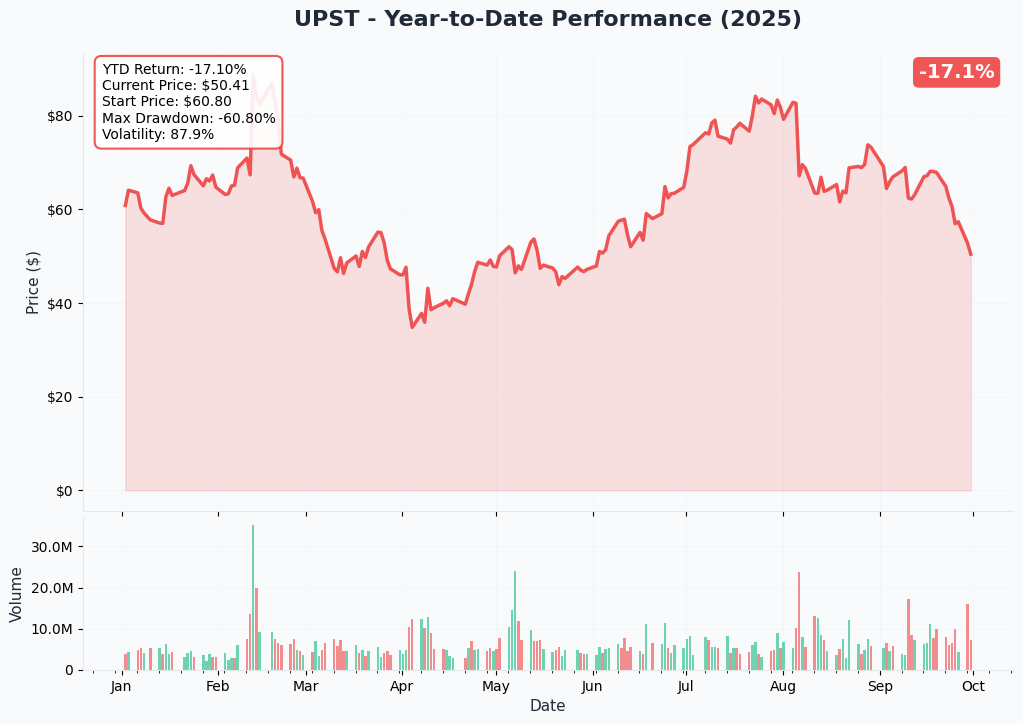
Upstart is having a rough 2025 with -17.1% YTD performance, though recovering from deeper lows. The stock peaked around $85 in August before crashing back down to current levels around $51.
Key observations:
- High volatility: 87.9% implied volatility signals massive moves expected
- Recent breakdown: Failed to hold above $60 resistance multiple times
- 52-week range: Currently trading near the middle of its range
- Volume spikes: Heavy institutional activity during recent decline
Gamma-Based Support & Resistance Analysis
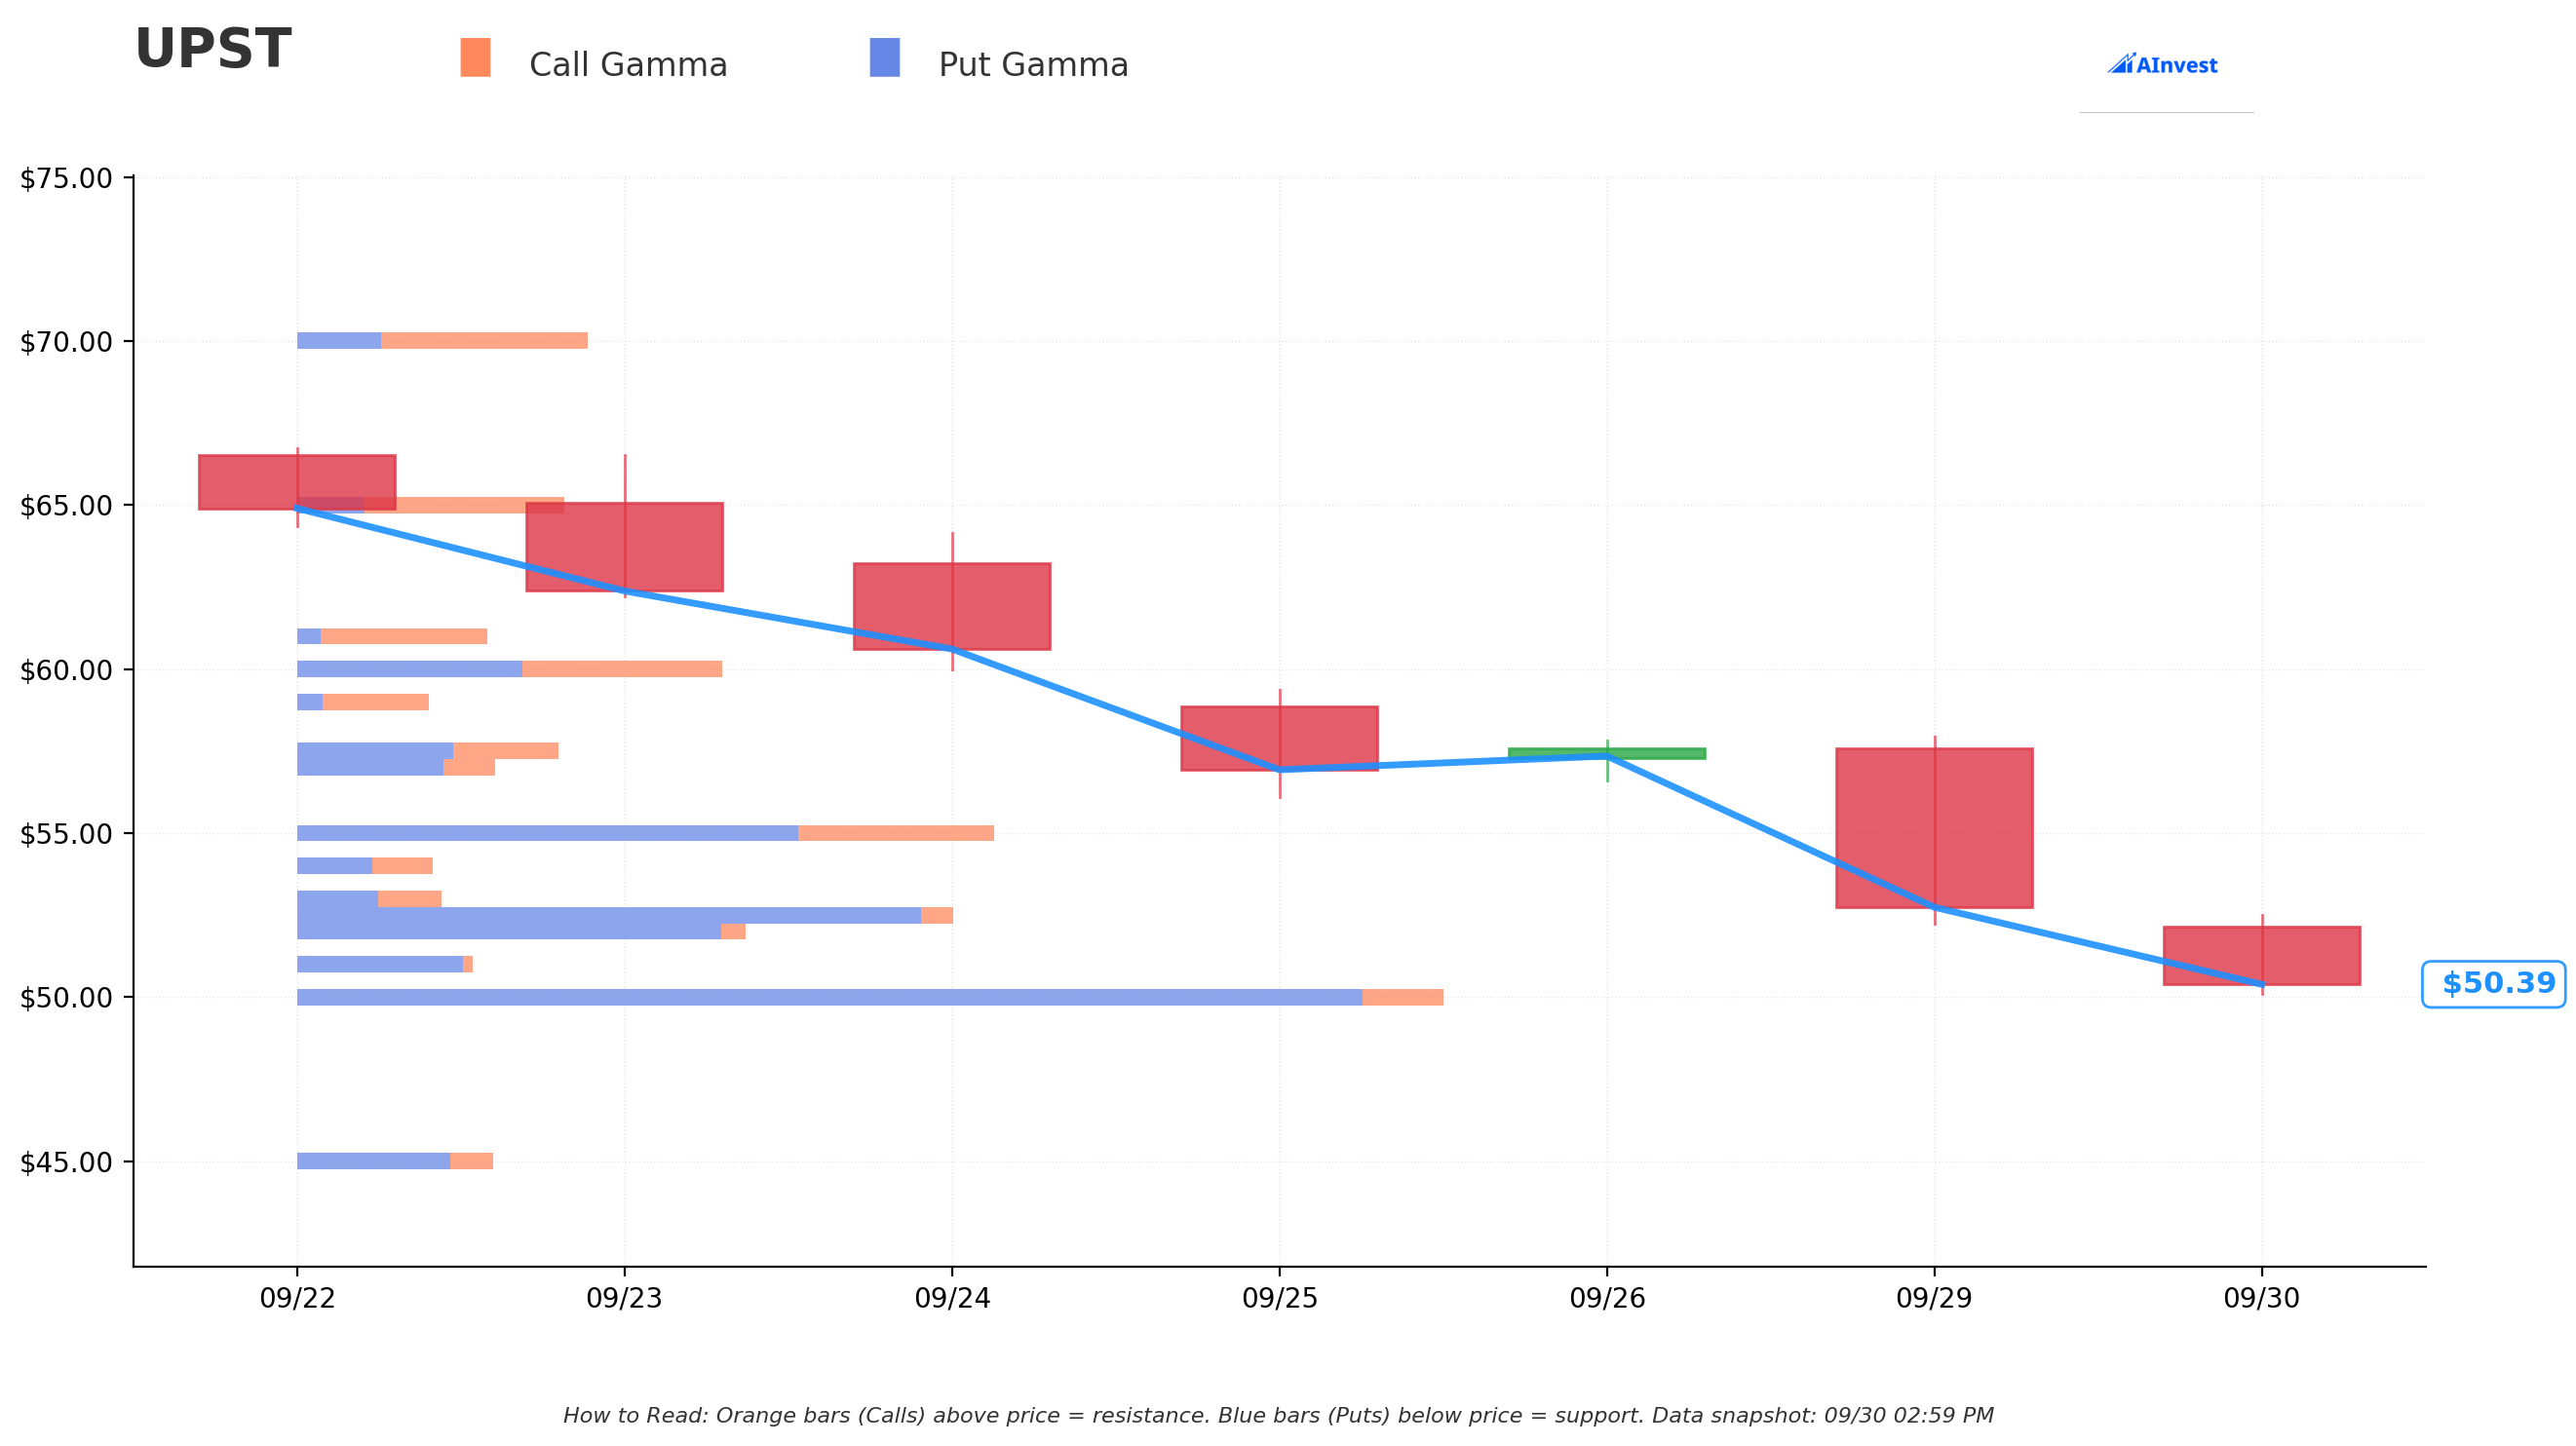
Current Price: $50.39
The gamma chart reveals critical levels explaining this defensive positioning:
- Put Gamma Support: Massive wall at $50 with 7.07 put gamma - strongest support level
- Call Gamma Resistance: Building at $52-$55 zone, with major wall at $55
- Current Position: Trading right at the $50 gamma support level
- Market Maker Impact: Heavy put gamma at $50 means MMs will defend this level, but break below could accelerate selling
The $52.50 put strike aligns perfectly with resistance, while $47.50 provides protection below the $50 gamma wall!
⚡ Catalysts
Upcoming Events
Q3 2025 Earnings - November 6, 2025
- Wall Street expects revenue of ~$280M with GAAP net income of ~$9M (Source: MarketBeat)
- Key focus: Maintaining 100%+ YoY revenue growth momentum
- AI Model 22 improvements driving 24% conversion rates
Product Expansion Milestones
- Auto loans growing 42% sequentially
- HELOCs expanding 52% quarter-over-quarter
- Small business lending targeting $1.2T addressable market
Capital Strategy Evolution
Recently Completed
$600M Convertible Notes (August 2025)
- $600M raised in convertible senior notes due 2032
- Strengthened balance sheet and reduced 2026 debt obligations
- Capped call transactions to minimize dilution
Q2 2025 Results
- First GAAP profitable quarter since 2022
- Revenue doubled YoY to $257M
- Loan originations up 154% to $2.8B
🎯 Price Targets & Probabilities
Using the gamma levels and current technical setup:
Bull Case (20% chance)
Target: $55-$60
- Breaks above gamma resistance at $52-$55
- Q3 earnings beat on AI model improvements
- Product expansion accelerates growth
- Fed rate cuts boost lending demand
Risk to put buyers: Options expire worthless
Base Case (50% chance)
Target: $47-$52 range
- Stays within current gamma bands
- Mixed Q3 results with guidance concerns
- Continued volatility around $50 support
Put buyers profit moderately in this range
Bear Case (30% chance)
Target: $40-$45
- Break below $50 gamma support triggers selling
- Q3 disappointment or guidance cut
- Competition concerns from traditional banks adopting AI
- High valuation concerns materialize
Maximum profit scenario for put buyers
💡 Trading Ideas
Conservative: Small Put Spread
Play: Buy $50/$45 put spread (Oct 17th)
Risk: Premium paid (~$2 per spread) Reward: Max $5 if below $45
Why this works: Follows institutional positioning with defined risk
Balanced: Straddle the Volatility
Play: Buy $50 straddle (Nov 15th for earnings)
Buy $$50 calls and $$50 puts
Risk: Premium paid Reward: Profits from big move either direction
Why this works: 87.9% IV suggests massive move coming
Aggressive: Counter-Trade Recovery
Play: Sell cash-secured puts at $45
Sell $$45 puts (Oct 17th)
Risk: Assignment at $45 if drops Reward: Keep premium if stays above $45
Why this works: Collect premium from elevated IV, own at discount if assigned
⚠️ Risk Factors
- Earnings volatility: Q3 report November 6th could cause explosive moves
- Competition intensifying: Traditional banks and fintechs adopting AI
- Valuation concerns: Stock up 207% in 6 months raises bubble fears
- Economic sensitivity: Lending demand tied to macro conditions
- Recent 28% decline: Stock already correcting from August highs
🏁 The Bottom Line
Real talk: This $9.9M put buying tells us institutional money is seriously worried about Upstart heading into Q3 earnings. The gamma data shows $50 as critical support - we're sitting right on it now.
If you own UPST: Consider hedging or trimming position - smart money is buying protection
If you're watching: Wait for clarity after October 17th expiration or Q3 earnings
If you're bearish: The put buyers might be onto something - consider spreads for defined risk
Mark your calendar: November 6th Q3 earnings will be the real catalyst - these puts expire October 17th, suggesting traders expect volatility before then!
Disclaimer: Options trading involves substantial risk. This analysis is for educational purposes only and not financial advice. Past performance doesn't guarantee future results.
About Upstart: Upstart is a cloud-based AI lending platform with a $5.07 billion market cap in the finance services sector, revolutionizing credit decisions through advanced machine learning.