🏗️ VRT $10M Risk Reversal - Institutional AI Infrastructure Play with Capped Upside! ⚡
📅 December 11, 2025 | 🌋 EXTREMELY UNUSUAL - Multi-Leg Strategy Detected
🎯 The Quick Take
A sophisticated trader just constructed a $10 MILLION+ multi-leg position on Vertiv (VRT) - the picks and shovels of the AI data center boom! This massive 3-part structure combines a $200/$250 call spread with a short $140 put, creating a Risk Reversal/Collar that generates ~$600K NET CREDIT while expressing bullish conviction. With VRT trading at $176.48 and positioned as the liquid cooling leader for AI infrastructure, someone's betting on continued upside to $250 (+42%) while selling downside protection at $140 (-21%). This is institutional-grade positioning ahead of Q1 2025 earnings and multiple AI data center catalysts!
📊 Company Overview
Vertiv Holdings Co (VRT) is a global leader in critical digital infrastructure and continuity solutions - essentially the cooling and power backbone enabling the AI revolution:
- Market Cap: $69.5 Billion
- Current Price: $181.82 (as of December 10, 2025)
- Industry: Critical Data Center Infrastructure & Liquid Cooling Solutions
- YTD Performance: +50-60% in 2025, outpacing major indices
- Key Technology: Direct-to-chip liquid cooling, power distribution, thermal management
Vertiv provides the mission-critical infrastructure that keeps AI data centers running. As GPU clusters push rack densities from 40kW to 120-132kW today and potentially 600kW+ by 2027, traditional air cooling can't cut it. Vertiv's liquid cooling capacity expanded 40x in 2024 to meet this explosive demand!
💰 The Option Flow Breakdown
The Tape (December 11, 2025):
Trade 1: Long $200 Call (The Bullish Base)
| Metric | Details |
|---|---|
| Strike | $200 |
| Expiration | February 20, 2026 (71 days) |
| Contracts | 7,200 |
| Premium | $5.8M |
| Type | BTO (Buy to Open) |
| Z-Score | 135.55 "EXTREMELY_UNUSUAL" 🌋 |
Trade 2: Short $250 Call (The Profit Cap)
| Metric | Details |
|---|---|
| Strike | $250 |
| Expiration | February 20, 2026 (71 days) |
| Contracts | 7,100 |
| Premium | $1.2M (collected) |
| Type | STO (Sell to Open) |
| Z-Score | 253.87 "EXTREMELY_UNUSUAL" 🌋 |
Trade 3: Short $140 Put (The Income Generator)
| Metric | Details |
|---|---|
| Strike | $140 |
| Expiration | February 20, 2026 (71 days) |
| Contracts | 7,100 |
| Premium | $4M (collected) |
| Type | STO (Sell to Open) |
| Z-Score | 67.6 "EXTREMELY_UNUSUAL" 🌋 |
🤓 What This Actually Means
This is a sophisticated RISK REVERSAL / COLLAR structure that screams institutional positioning! Here's the breakdown:
The Structure:
- Long $200 Call: Bullish bet on VRT reaching $200+ (13% upside from current $176.48)
- Short $250 Call: Caps maximum profit at $250 (42% upside)
- Short $140 Put: Obligates buyer to purchase VRT at $140 if it falls (21% downside)
The Economics:
- Net Premium: ~$600K CREDIT (they got PAID to be bullish!)
- Cost Basis: $5.8M (long calls) - $1.2M (short calls) - $4M (short puts) = -$600K net credit
- Maximum Profit: ~$2.9M if VRT is between $200-$250 at expiration
- Breakeven on Upside: $194 (accounting for net credit received)
- Risk Below $140: Must buy 710,000 shares at $140 ($99.4M capital requirement!)
Why This Matters:
This trader is expressing controlled bullish conviction on VRT's AI infrastructure growth story while:
- ✅ Getting paid ~$600K upfront via net credit
- ✅ Capturing 42% upside from current levels to $250
- ✅ Capping risk at defined levels rather than unlimited downside
- ⚠️ Willing to own shares at $140 - suggesting strong conviction in VRT's value floor
The timing is critical - positioned through Q1 2025 earnings (late April), multiple product launches (CoolPhase Flex, CoolChip CDU family), and potential S&P 500 inclusion speculation!
Unusual Score: 🌋 VOLCANIC (All three legs scoring Z-Scores of 67.6-253.87) - This represents institutional-scale positioning rarely seen in VRT!
📈 Technical Setup / Chart Analysis
YTD Performance Chart
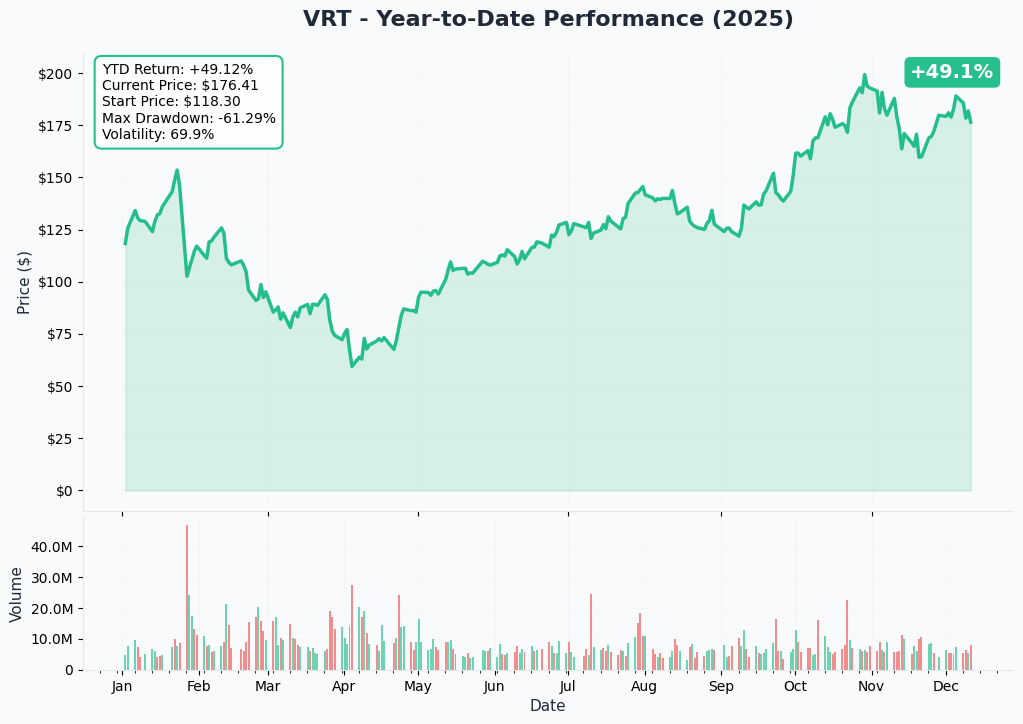
Vertiv has been an absolute rocket ship in 2025! The chart tells the story of a company riding the AI infrastructure supercycle:
Key Observations:
- Monster Rally: Up 50-60% YTD in 2025, dramatically outpacing the market
- Current Price: $181.82, approaching 52-week high of $202.45
- Consecutive Guidance Raises: Pattern of beat-and-raise quarters throughout 2025
- Volatility: Recent 3.2% drop on S&P 500 exclusion shows sensitivity to index inclusion narratives
- Volume Surges: Heavy institutional accumulation on every dip
The Trade Context: The $200 call strike sits just 10% above the recent high, while the $140 put is 23% below current levels - this trader believes in consolidation followed by a measured move higher, NOT a parabolic moonshot.
Gamma-Based Support & Resistance Analysis
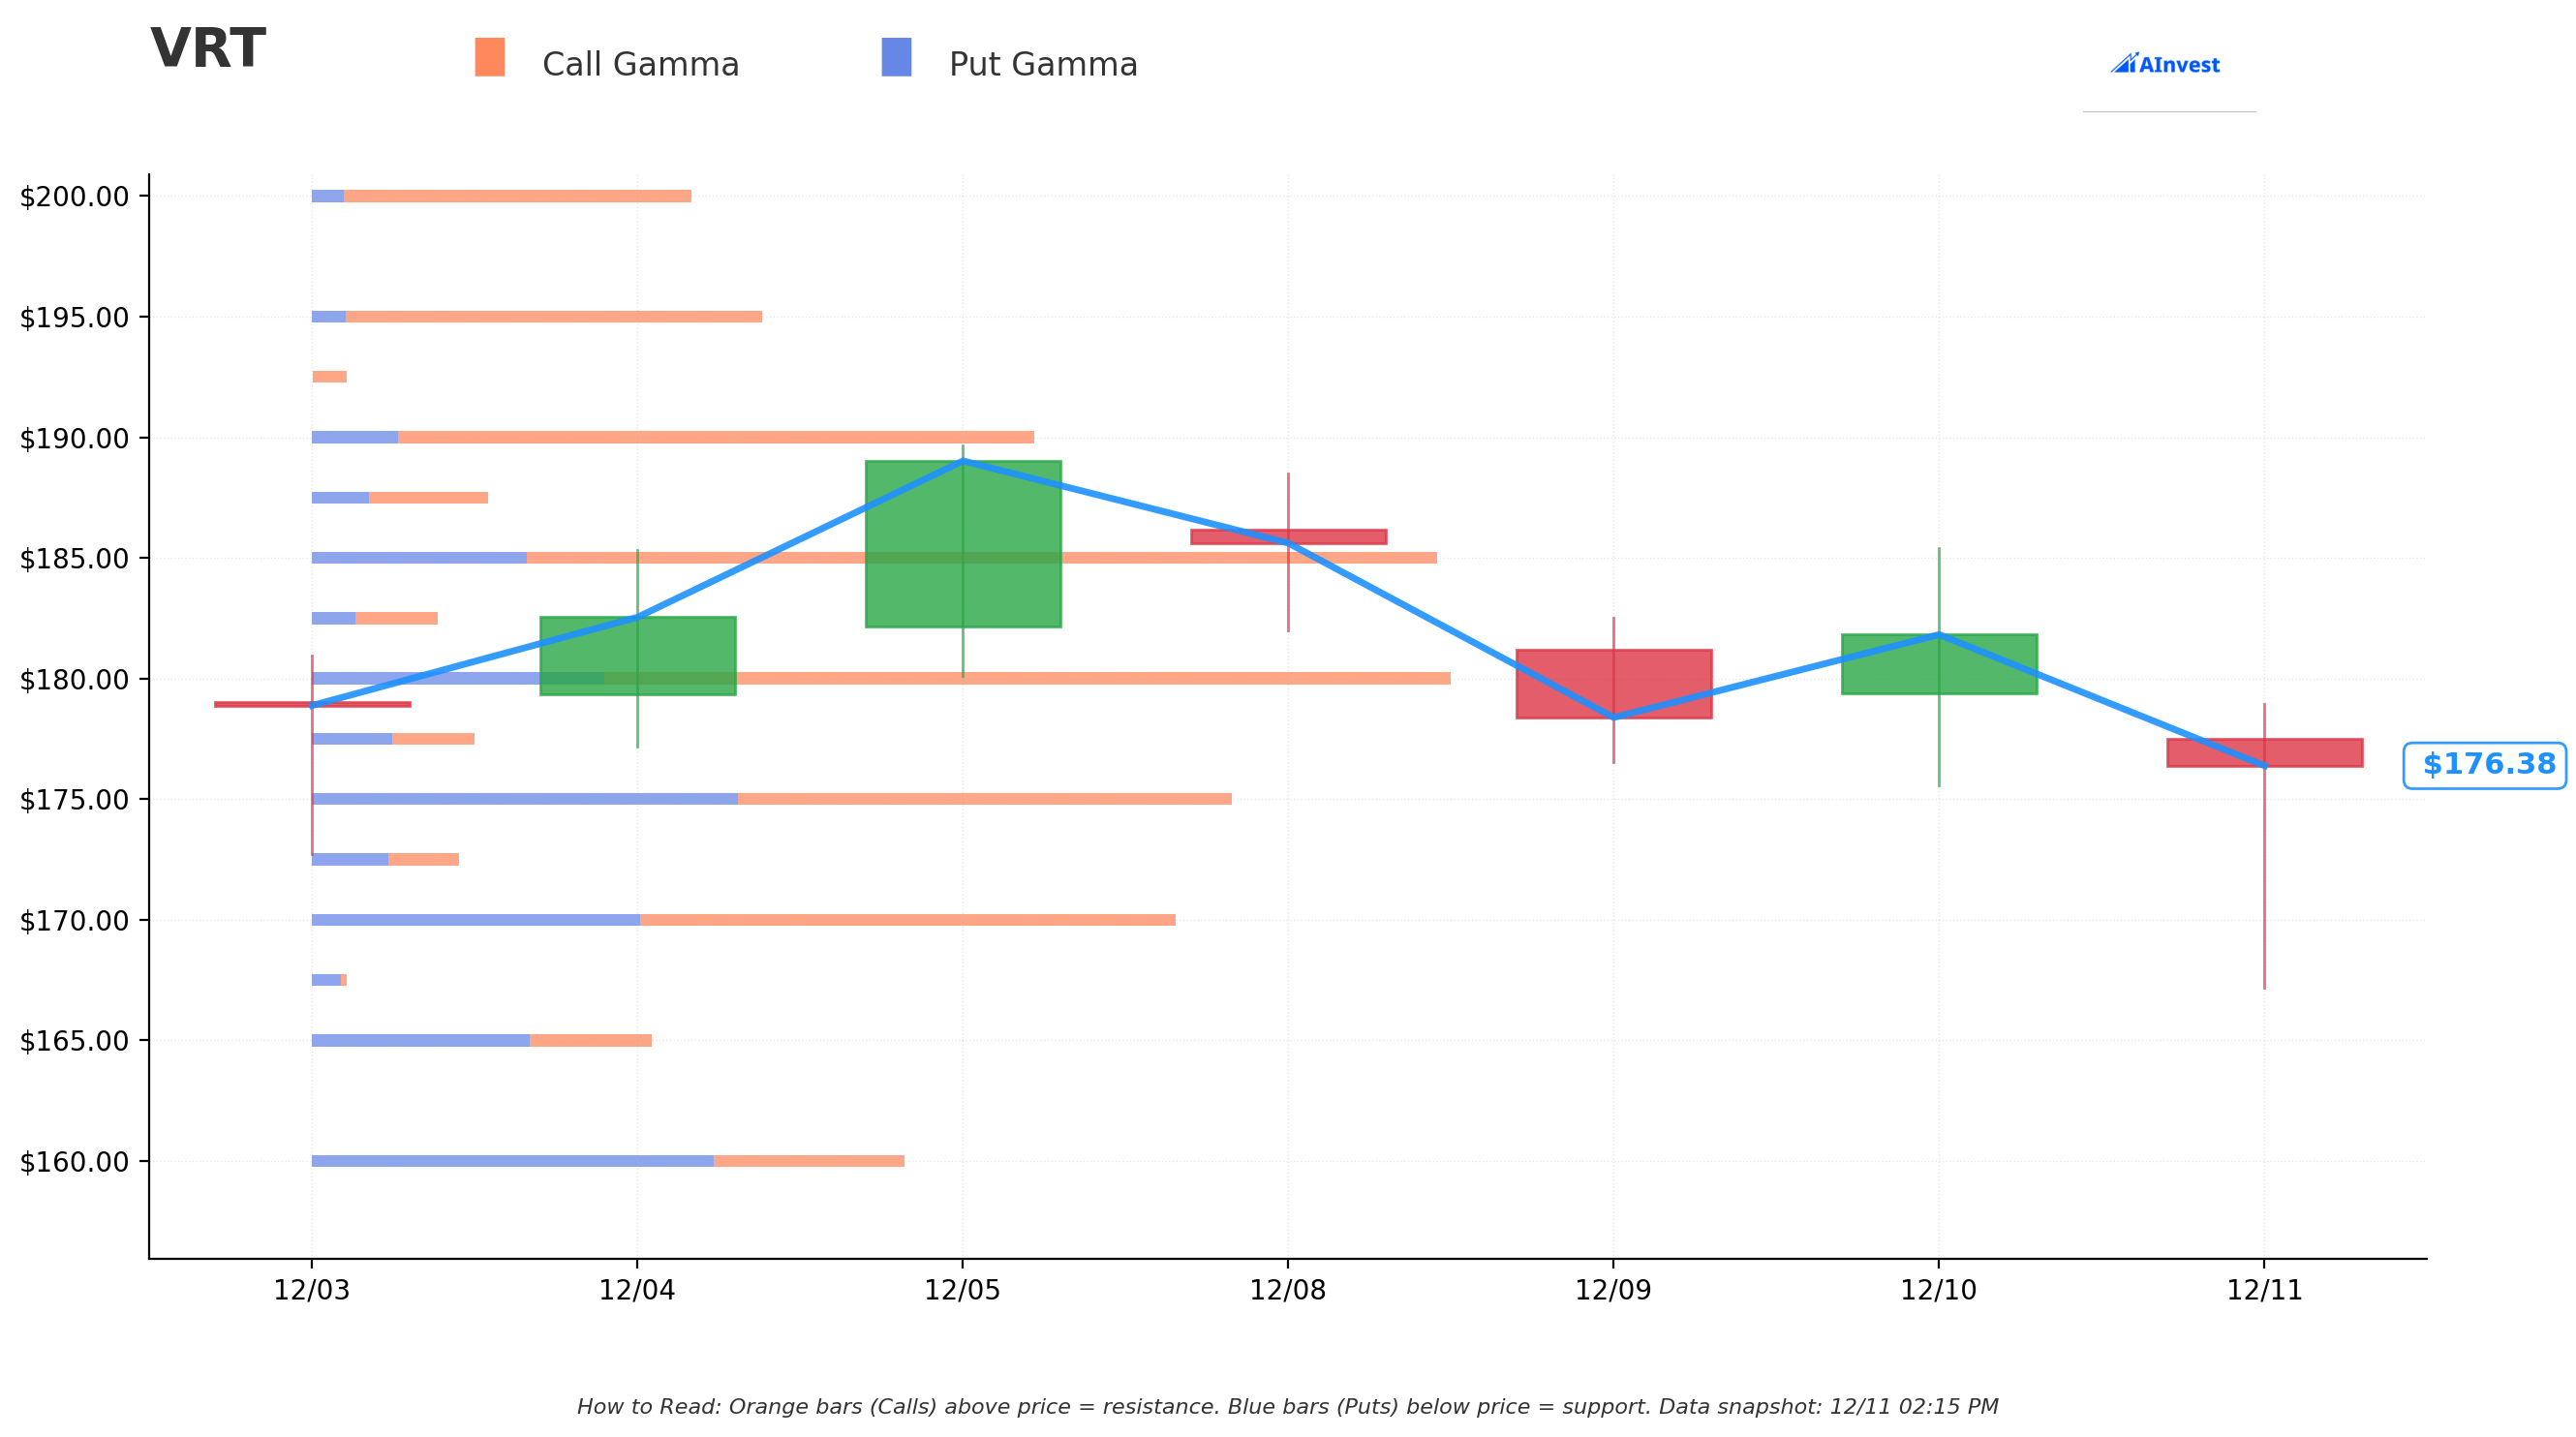
Current Price: $176.48
The gamma analysis reveals why these strike selections make perfect sense:
🔵 Support Levels (Put Gamma):
- $175.00: STRONGEST support with 5.40 net GEX - current consolidation zone! ⭐
- $170.00: Secondary support at 5.06 net GEX - first bounce level
- $165.00: Third support at 2.00 net GEX - minor floor
- $160.00: Major support at 3.48 net GEX - psychological level
- $155.00: Below remains supported but weakening
🟠 Resistance Levels (Call Gamma):
- $180.00: STRONGEST resistance at 6.69 net GEX - immediate ceiling! ⭐
- $185.00: Secondary resistance at 6.59 net GEX - tight clustering
- $190.00: Major resistance at 4.24 net GEX
- $195.00: Lighter resistance at 2.64 net GEX
- $200.00: Target strike at 2.23 net GEX - trade's profit zone begins!
- $210.00: Heavy resistance at 4.64 net GEX
Net GEX Bias: BULLISH (Call GEX: 41.63 vs Put GEX: 21.27) - Market makers positioned for upside!
Trade Implications:
- The $200 call strike sits above significant gamma resistance, requiring real momentum to reach
- The $140 put is DEEP below the strongest support at $175, providing a massive cushion
- The $250 short call caps upside at levels with minimal current gamma concentration
- Net bullish GEX bias suggests dealer positioning aligns with the trade's bullish tilt
🎯 Implied Move Analysis
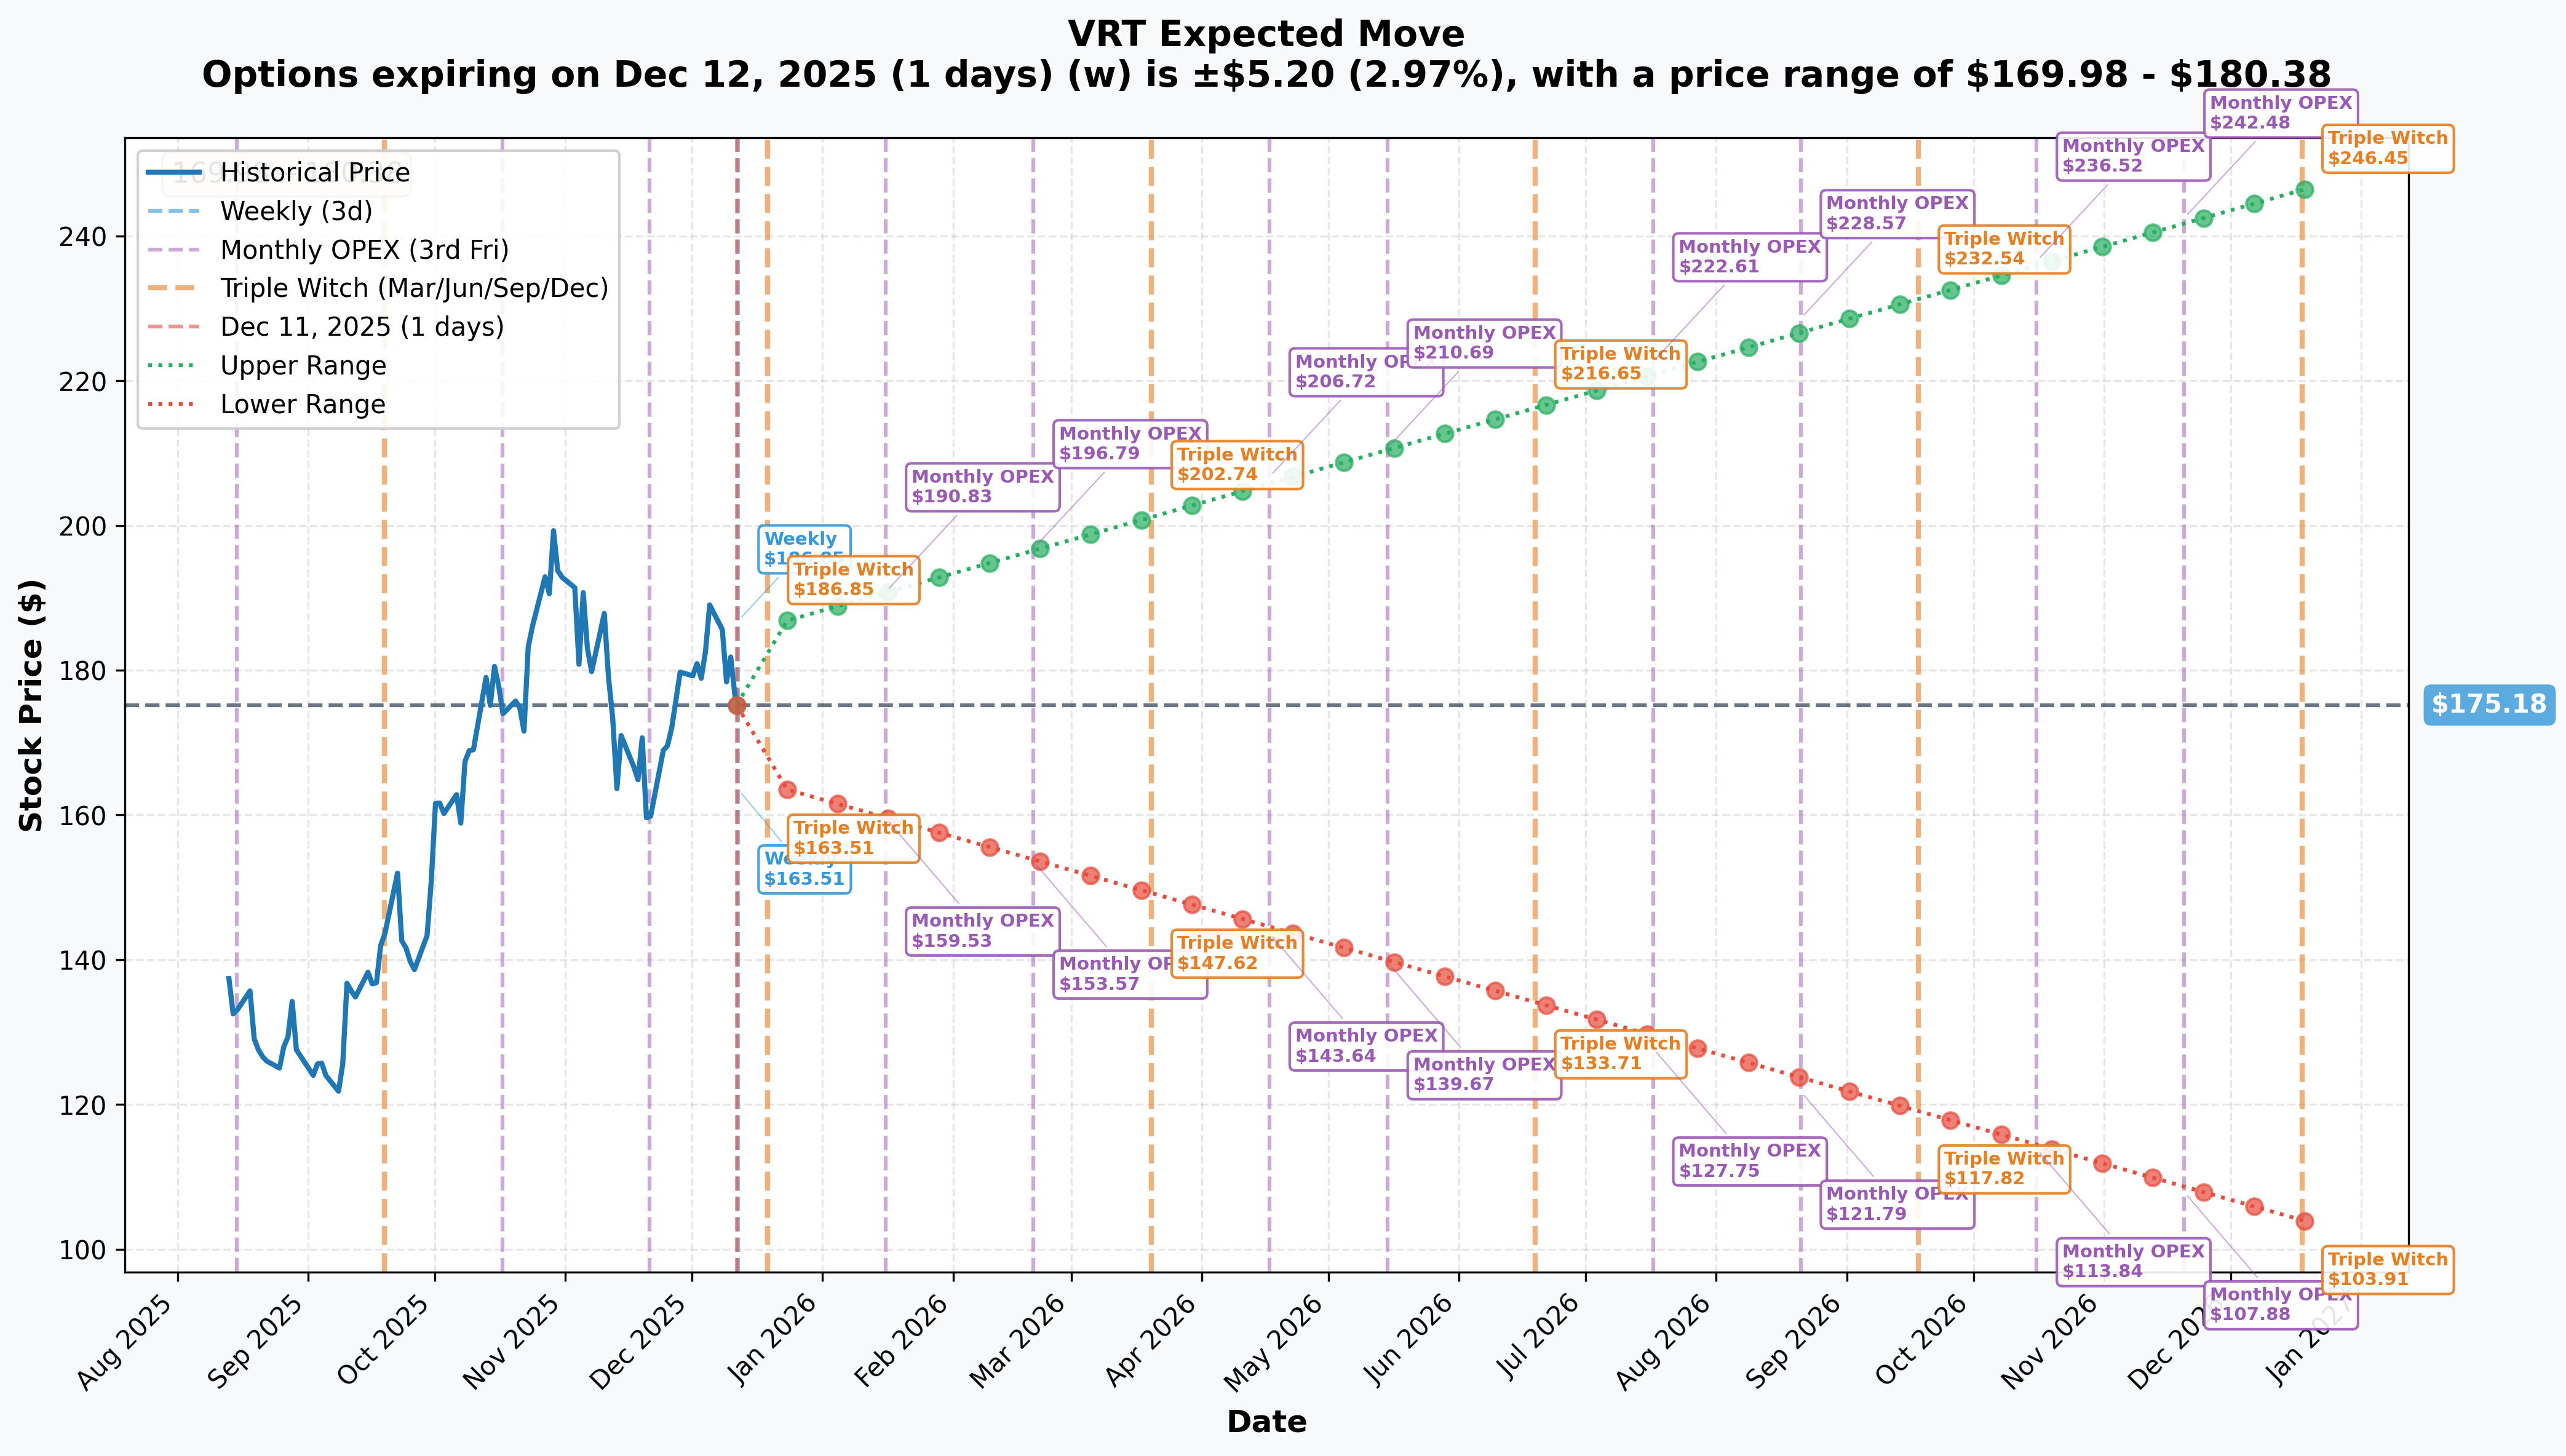
What the Options Market is Pricing:
Near-Term Moves
- Weekly (Dec 12): ±2.97% ($169.98-$180.38) - Range-bound consolidation
- Monthly OPEX (Dec 19): ±6.28% ($164.17-$186.19) - Still below $200 strike
- February Expiration: ~±10-12% estimated - Positions around $160-$200 range
Trade Expiration (Feb 20, 2026)
- LEAPS (Dec 2026 proxy): ±40.69% ($103.91-$246.45) - Fully encompasses trade strikes!
- Interpretation: The market sees both $140 (downside) and $250 (upside) as realistic outcomes
Risk Reversal Context: The implied volatility suggests this trade structure makes sense - there's enough expected movement to justify the collar, but not so much that the short options are mispriced. The trader is essentially saying: "I'll collect premium on the wings ($140 put, $250 call) and use it to finance the $200 call leg, betting on modest upside without extreme moves."
🎪 Catalysts
Upcoming Events (Critical for This Trade)
Q1 2025 Earnings Release - Late April/Early May 2025 🎯
Expected Timing: Based on historical quarterly reporting patterns
What's Expected:
- Full Year 2025 Guidance (from Feb 2025):
- Pattern of Guidance Raises: VRT has raised guidance every quarter in 2025
- Key Metrics to Watch:
- Backlog growth (was $9.5B in Q3 2025, +30% YoY)
- Liquid cooling revenue penetration and margins
- Book-to-bill ratio (recent 1.4x indicating strong demand)
- Operating margin progress toward 25% 2029 target
Why it matters: Q4 2024 showed +26% revenue growth and +77% EPS growth. If Q1 2025 continues this trajectory, the $200 strike becomes very achievable!
CoolPhase Flex Deployment - Q1 2025 🧊
- First units scheduled for installation at Compass Datacenters facility
- Industry's first packaged system integrating liquid and air-cooling technologies
- Part of multi-year, multi-billion-dollar supply agreement
- Revenue impact: De-risking massive backlog conversion to revenue
Liquid Cooling Services Portfolio Launch - February 2025 🔧
- Global launch of comprehensive lifecycle services
- Backed by 240+ service centers, 3,500+ field engineers, 190+ technical specialists
- Margin opportunity: High-margin recurring revenue stream from installed base
Caterpillar Strategic Alliance - Ongoing Momentum 🚜
- Announced November 2025, stock rose 5.7%
- Integrated, modular energy optimization for data centers
- Combines Vertiv cooling + Caterpillar power generation
- Market expansion: Full-stack data center solutions increase wallet share
Potential S&P 500 Inclusion - Next Rebalancing 📊
- Status: Recently passed over (Ares Management selected), causing 3.2% drop
- Market Cap: $68.5-69.5B makes VRT a strong candidate
- Next Opportunities: March, June, September 2026 quarterly rebalancings
- Catalyst Potential: Barron's highlighted as inclusion candidate, passive flows could drive 5-10% pop
50% Dividend Increase Impact 💰
- Announced November 2024: $0.10 → $0.15 annual ($0.0375 quarterly)
- Q4 2024 dividend payable December 19, 2024
- Signal: Management confidence in durable cash flow generation
Recently Completed (Building Momentum)
Q4 2024 Earnings Blowout - February 12, 2025 🚀
- Revenue: $2.346B (+26% YoY, +$481M)
- Adjusted EPS: $0.99 (+77% YoY vs Q4 2023)
- Operating margin: 21.5%, expanded 380 basis points
- Organic orders: +30% YoY (TTM)
Q3 2025 Results - October 2025 📈
- Net sales: $10.2B (27% organic growth)
- Adjusted operating profit: $2.06B (+33% YoY)
- Adjusted EPS: $4.10 (+44% vs 2024)
- Raised guidance to $4.07-$4.13 (+$0.30 at midpoint)
Analyst Activity - Overwhelmingly Bullish ⬆️
- Goldman Sachs: Raised PT to $204 from $182, Buy rating
- Citi: Raised PT to $220 from $198
- Morgan Stanley: Raised PT to $200 from $165
- Consensus: 21-24 Buy ratings, average PT $196.83-$201.88
- Lone Downgrade: Wolfe Research to Hold on valuation (P/E 13x→36x expansion)
Recent Acquisitions - Portfolio Expansion 🤝
- BiXin Energy (2024): Chiller technology for liquid cooling
- CoolTera (2023): Liquid-cooling infrastructure
- PurgeRite (Dec 2025): $1B acquisition to enhance portfolio
Market Position & Growth Drivers
Liquid Cooling Market Leadership 🥇
- Vertiv market share: 16.3% (Top 3 position)
- Gained 6% market share in 2024 from cloud partnerships
- Classified as "Star" in data center liquid cooling market
Explosive Market Growth 📊
- Liquid cooling market: $2.84B (2025) → $21.14B (2032) at 33.2% CAGR
- Adoption surge: 2% today → 30% by 2028
- AI data center capacity rising 33% annually through 2030
- Goldman Sachs: AI could drive 165% increase in DC power demand by 2030
Technology Partnerships 🤖
- NVIDIA: Collaborated on AI cooling for COOLERCHIPS program
- Intel: Liquid/air solutions for Gaudi3 AI accelerator
- Compass Datacenters: Multi-billion dollar supply agreement
🎲 Price Targets & Probabilities
Using gamma levels, catalyst timing, options positioning, and market dynamics:
🚀 Bull Case (35% chance)
Target: $220-$250 by February 20, 2026
What needs to happen:
- Q1 2025 earnings crush estimates with 27%+ organic growth continuing
- CoolPhase Flex deployment generates major enterprise wins and validates multi-billion backlog
- S&P 500 inclusion announcement (March 2026 rebalancing) drives 5-10% passive buying
- Operating margins exceed 23%, accelerating path to 25% target
- Major hyperscale customer announcement (Meta, Amazon, Microsoft data center deal)
- Liquid cooling revenue hits 30%+ of mix vs ~20% currently
Technical path: Break $180 gamma resistance → test $185-$190 → clear $200 (long call strike profitable) → push toward $220-$250 range
Options Outcome:
- ✅ Long $200 calls: Worth $35-50/contract ($2.5M-$3.6M profit on $5.8M cost)
- ✅ Short $250 calls: Exercised/assigned but profits capped ($3.6M max profit)
- ✅ Short $140 puts: Expire worthless, keep $4M premium
- Total P&L: ~$2-3M profit + $600K net credit = $2.6-3.6M total gain
😐 Base Case (45% chance)
Target: $185-$210 range-bound through expiration
What needs to happen:
- Q1 earnings meet expectations but don't meaningfully accelerate growth
- Backlog conversion steady but not spectacular
- No S&P 500 inclusion in March, speculation continues
- Book-to-bill holds around 1.4x but doesn't expand
- Competition from Schneider Electric (17.2% share) and others intensifies
- Valuation concerns (63.5x P/E) limit upside momentum
- Market digests 50-60% YTD gains with consolidation
Technical path: Oscillate between $180 resistance and $175 support → occasional pops to $190-200 → settle around $195-205
Options Outcome:
- ✅ Long $200 calls: Breakeven to modest gains ($0-$800K profit)
- ✅ Short $250 calls: Expire worthless, keep $1.2M premium
- ✅ Short $140 puts: Expire worthless, keep $4M premium
- Total P&L: ~$0.6-1.4M profit (mostly from collected premiums)
🐻 Bear Case (20% chance)
Target: $140-$165 by February 20, 2026
What needs to happen:
- Q1 earnings disappoint with operational inefficiencies recurring
- Backlog conversion stalls due to customer project delays
- Heavy insider selling ($23.4M last 3 months, $5.2B since 2018) signals peak valuations
- AI infrastructure buildout slowdown on macro concerns
- Competitive pressure from Schneider, Lenovo, Rittal erodes pricing power
- S&P 500 rejection triggers technical selling
- Tariff impacts pressure margins more than expected
Technical path: Break $175 support → test $170 → cascade to $160 → potentially $140-145 capitulation
Options Outcome:
- ❌ Long $200 calls: Expire worthless ($5.8M loss)
- ✅ Short $250 calls: Expire worthless, keep $1.2M premium
- ❌ Short $140 puts: ASSIGNED - forced to buy 710,000 shares at $140 ($99.4M)
- Total P&L: -$4.6M on options + forced stock purchase at 21% below entry
- Capital at Risk: Massive - requires $99.4M to take delivery of shares
💡 Trading Strategies
Strategy 1: Conservative Income Collection 💵
For: Risk-averse traders bullish on VRT floor but wanting premium income
The Play:
- Sell Feb 21, 2026 $150 put at current ~$8-10 premium
- Collect $800-1,000 per contract ($1.6-2M for 2,000 contracts to scale partially)
Rationale:
- $150 is 15% below current $176.48, well above $140 institutional floor
- Strong gamma support at $175, $170, $165, $160
- 89.92% institutional ownership provides downside support
- Book-to-bill 1.4x and $9.5B backlog support valuations
Max Profit: Premium collected ($800-1,000/contract) Max Risk: Forced to buy VRT at $150 (could lose entire capital if VRT→$0) Breakeven: $140-142 (strike - premium received)
When to Take Profit: 50% premium decay or VRT rallies to $190+
Strategy 2: Balanced Call Spread 📊
For: Moderately bullish traders targeting Q1 earnings upside
The Play:
- Buy Feb 21, 2026 $180 call at ~$12-15
- Sell Feb 21, 2026 $210 call at ~$5-7
- Net debit: $7-10/contract ($700-1,000)
Rationale:
- Captures move from current $176.48 to $210 (19% upside)
- Lower cost than naked call due to $210 short
- Positioned through Q1 earnings catalyst
- $210 sits above heavy gamma resistance, realistic but not greedy
Max Profit: $30 spread - $10 debit = $2,000/contract (200% return) Max Loss: $700-1,000 premium paid Breakeven: $187-190 (lower strike + net debit)
When to Take Profit: 100% gain ($1,400 profit) or if VRT hits $205+ before expiration
Strategy 3: Aggressive Synthetic Risk Reversal 🚀
For: Conviction traders replicating the institutional position at smaller scale
The Play:
- Buy Feb 21, 2026 $190 call at ~$8
- Sell Feb 21, 2026 $240 call at ~$2
- Sell Feb 21, 2026 $145 put at ~$5
- Net credit: ~$1/contract (or breakeven)
Rationale:
- Mirrors the institutional structure with adjusted strikes
- Gets you PAID (small credit) to be bullish
- Captures $190-$240 upside range (36% move)
- Willing to own VRT at $145 (18% below current)
Max Profit: ~$4,900/contract if VRT between $190-$240 at expiration Max Risk: Must buy stock at $145 if VRT crashes (potentially -$14,500+ per contract) Breakeven: ~$189 upside, ~$144 downside
When to Take Profit: Close entire spread if VRT hits $220+ or roll short strikes if approaching assignment
⚠️ Risk Factors to Watch
Valuation Risk 💸
- Premium Multiple: 63.5x P/E vs 26.52x sector average (139% premium)
- NTM P/E Expansion: From 13x (Dec 2022) to 36x currently
- Analyst Concern: Wolfe Research downgrade cited "limited upside" after 14x appreciation
- Implication: Any execution misstep could trigger 20-30% correction to "fair value"
Execution & Operational Challenges 🏗️
- Acknowledged Issues: "Operational inefficiencies and execution challenges" in Q2 2025
- Supply Chain: "Higher than anticipated tariff mitigation costs"
- Scale-Up Risk: 40x capacity expansion in liquid cooling creates quality control pressure
- Implication: Backlog conversion could disappoint, margins compress
Insider Selling Warning 📉
- Recent Activity: $251M sold by single executive (Philip O'Doherty) in Nov 2024
- 3-Month Total: $23.4M in insider sales
- Since 2018: $5.2B sold vs $3.8M purchased
- Implication: Those closest to business capitalizing on current valuations - potential top signal
Competition Intensifying 🥊
- Market Share Battle: Schneider Electric 17.2% vs Vertiv 16.3%
- Emerging Threats: Lenovo showing "substantial product innovations"
- Stock Reaction: Recent 5.49% drop on "increased competition concerns"
- Implication: Pricing power erosion, margin pressure as market commoditizes
S&P 500 Inclusion Speculation ⚖️
- Recent Rejection: Ares Management selected instead, VRT dropped 3.2%
- Speculative Positioning: Barron's article drove buying on inclusion hopes
- Risk: If excluded again in March/June rebalancings, could trigger -5-8% selloff
- Implication: Technical rather than fundamental driver, but material to short-term price action
AI Buildout Dependency 🤖
- Revenue Concentration: Heavy reliance on AI data center capex continuation
- Customer Risk: Hyperscale concentration - if Meta, Google, Amazon slow builds, VRT feels it immediately
- Market View: Goldman Sachs 165% DC power demand increase by 2030 is optimistic case
- Implication: Any AI spending slowdown narrative could crater stock 20-40%
🧮 The Bottom Line
What This Trade is Really Saying:
An institutional player (likely hedge fund or prop desk) is making a controlled bullish bet on Vertiv's AI infrastructure story while protecting against downside and capping costs. They're saying:
-
✅ VRT reaches $200-250 (13-42% upside): High conviction based on 27% organic growth, $9.5B backlog, liquid cooling market 33% CAGR
-
✅ Willing to own at $140 (-21% from current): Strong fundamental floor given 1.4x book-to-bill, 89.92% institutional ownership, strategic value
-
⚠️ Not expecting parabolic move: Capping upside at $250 suggests measured expectations, not moonshot hopes
-
💰 Getting paid to wait: ~$600K net credit means time decay works FOR them, not against
The AI Infrastructure Thesis:
Vertiv is the ultimate picks-and-shovels play on AI. While everyone chases NVIDIA, hyperscalers, and AI software, VRT provides the unglamorous but ESSENTIAL infrastructure:
- ⚡ Power distribution: Data centers need reliable electricity at scale
- 🧊 Liquid cooling: 120-132kW racks today → 600kW+ by 2027 requires liquid, not air
- 🔄 Thermal management: Continuous operation depends on heat removal
- 📊 Monitoring/orchestration: AI-driven infrastructure optimization
The company has executed flawlessly with consecutive beat-and-raise quarters, margin expansion (380bps in Q4), and strategic partnerships with Caterpillar, NVIDIA, Intel.
The Risks Are Real:
At 63.5x P/E, VRT prices in perfection. The heavy insider selling, competition from Schneider/Lenovo, and acknowledged operational challenges mean this isn't a free lunch.
But the options positioning suggests smart money believes the bull case is more likely than not, with specific catalysts (Q1 earnings, CoolPhase deployment, potential S&P inclusion) driving the stock higher through February.
For retail traders: This is a template for sophisticated positioning. You don't need to risk $10M+ - the strategies outlined above let you participate at your scale while managing risk intelligently.
📚 Related Resources
- VRT Stock Analysis - TS2 Tech - Comprehensive overview of recent catalysts
- VRT Earnings History - SEC Edgar - Official Q4 2024 results and 2025 guidance
- Liquid Cooling Market Report - GlobeNewswire - Industry growth forecasts
- VRT Investor Relations - Official company updates
- VRT Analyst Ratings - Yahoo Finance - Consensus price targets
Disclaimer: This analysis is for educational and informational purposes only and should not be considered investment advice. Options trading involves substantial risk and is not suitable for all investors. Past performance does not guarantee future results. Always conduct your own due diligence and consider consulting with a licensed financial advisor before making investment decisions. The author may or may not hold positions in the securities discussed.
Analysis Date: December 11, 2025 | Data as of market close unless otherwise noted